
Figure 8. Jablonski diagram of chlorophyll showing the possible fates of the S1 and S2 excited states and timescales of the transitions involved.
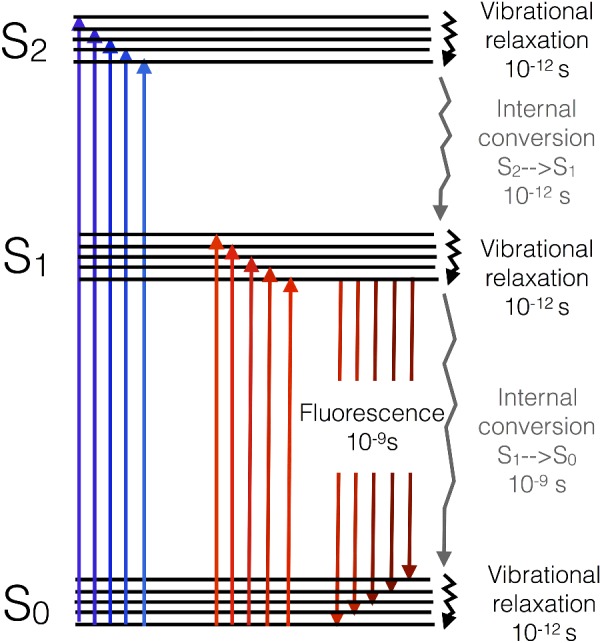
Photons with slightly different energies (colours) excite each of the vibrational substates of each excited state (as shown by variation in the size and colour of the arrows).