Abstract
Growth-regulated oncogene-alpha (GRO-α) has been reported to be over-expressed in a series of human cancers including colorectal cancer, melanoma, gastric cancer, hepatocellular carcinoma, and ovarian cancer and was known to regulate multiple biologic activities associated with tumor progression. But the role in human pancreatic cancer remains unclear. To examine the expression of GRO-α and its clinical significance in pancreatic cancer (PC), a total of 12 fresh PC specimens and 12 surrounding normal tissues to detect GRO-α mRNA expression were measured by quantitative real-time polymerase chain reaction (qRT-PCR). Immunohistochemical analysis of GRO-α protein was performed in 160 formalin-fixed, paraffin-embedded PC tissue samples and 68 control specimens, including 37 matched normal surgical margins and 31 benign pancreatic lesions. Kaplan–Meier survival and Cox regression analyses were performed to evaluate the prognosis of PC patients.
Expression of GRO-α mRNA in PC tissues was significantly compared with that in adjacent normal tissues (1.399 ± 0.165 vs. 0.870 ± 0.103 t = 1.75, P = 0.012), GRO-α protein expression in cytoplasm of cancer cells and stroma was detected in 41.88% and 40.63% PC specimens, respectively, and was significantly higher than that in corresponding normal tissues (P = 0.008, P = 0.002, respectively). High GRO-α expression in the cytoplasm of cancer cells was related to tumor location (P = 0.047), tumor status (T classification; P = 0.001), distant metastasis (P < 0.001), and tumor node metastasis (TNM) stage (P < 0.001). High GRO-α expression in the stroma correlated with perineural invasion (P = 0.010), T classification (P = 0.006) and TNM stage (P = 0.004), and was marginally associated with metastasis (P = 0.056). Elevated expression of GRO-α in cytoplasm of cancer cells (hazard ratio [HR] = 5.730, P = 0.007) and stroma (HR = 3.120, P = 0.022) were independent prognostic factors of pancreatic cancer. T classification (HR = 2.130, P = 0.023), lymphatic metastasis (HR = 4.211, P = 0.009) and TNM classification (HR = 0.481, P = 0.031) were also prognostic predictors in PC patients.
GRO-α expression was elevated in pancreatic cancer tissues and might be a potential therapeutic target and prognostic marker in patients with pancreatic cancer.
Keywords: Growth-regulated oncogene-alpha, Pancreatic cancer, Prognosis
1. Introduction
Pancreatic cancer (PC) ranks the fourth principal reason of cancer-related death in western countries[1] and the sixth in China.[2] Of all malignant pancreatic tumors, pancreatic ductal adenocarcinoma (PDA) that originates in the pancreatic ductal epithelium constitutes more than 90% and presents a high degree of malignancy and more than 50% of cases presents distant metastasis when initially diagnosed, leading to an unfavorable death within 1 year.[3] The 5-year survival rate of patients with PC are less than 5% if without any treatment.[4] While optimal surgical resection could improve 5-year survival rate up to 25% to 35% after surgery which has been considered to provide the only chance of long-term survival.[5] However, although patients with PDA had accepted curative surgical resection, the prognosis remains poor since the disease generally advances or recurs, resulting in only 10% to 20% of 5-year survival rate.[6] Unfortunately, only 15% to 20% of diagnosed PC patients can be potentially curative resection since PC is often advanced when initially diagnosed.[7] Although the treatment strategy of the disease has been remarkably improved, the treatment outcome is rather limited and prognosis of patients with PC remains extremely poor.
Chemokines play an important role in regulating wound healing and inflammation by recruiting neutrophils to inflammatory sites. Growth regulated oncogene (GRO) belongs the chemokine ligand family and there are 3 different kinds of subtypes (GRO-α, GRO-β, and GRO-γ, respectively) and now are also described as CXCL1, CXCL2, and CXCL3, accordingly. Among these proteins, all 3 ligands bind to the common receptor CXCR2, a G protein-coupled chemokine receptor, while GRO-α/CXCL1 has the highest affinity. GRO-α is a 73-amino acid 8-kDa protein which is structurally and functionally related to GRO-β/CXCL2, GRO-γ/CXCL3, and interleukin-8.[8] Originally, the GRO-α protein was extracted and purified from supernatant of a cultured human melanoma cell line as a autocrine growth factor[9] and was found to be an inflammatory factor that plays a critical role in wound healing by modulating cell migration and angiogenesis,[10] GRO-α was also shown to be an oncogene in a Chinese hamster embryonic fibroblasts model by subtractive hybridization technology[11] and has multiple effects on cell proliferation, tumor angiogenesis, invasion, and metastasis.[12,13]
GRO-α has been reported to be over-expressed in a series of human cancers including colorectal cancer,[14] melanoma,[15] breast cancer,[16] bladder cancer,[17] gastric cancer,[18] hepatocellular carcinoma,[19] and ovarian cancer.[20] Furthermore, GRO-α is known to regulate multiple biologic activities associated with tumor progression including primary tumor growth, tumor angiogenesis, tumor cell proliferation, and development of metastatic disease, and some studies have suggested a role in tumor prognosis.[18,19,21,22] To the best of our knowledge, GRO-α expression in pancreatic cancer along with its correlation with clinicopathologic characteristics have not been evaluated to date. In the current study, 24 fresh frozen-tissues (including 12 pancreatic cancer tissues and 12 normal control tissues) were prepared to examine the expression of GRO-α mRNA by quantitative real-time polymerase chain reaction (qRT-PCR). Additionally, 160 formalin-fixed, paraffin-embedded (FFPE) samples of pancreatic cancer tissue and 68 control specimens, including 37 matched normal surgical margins and 31 benign pancreatic lesions were prepared for tissue microarrays (TMA) construction and determined the expression of GRO-α protein using immunohistochemistry (IHC). Finally, we analyzed the relationship between GRO-α and clinical characteristics of patients with PC. Our findings suggest that the GRO-α protein level represents a novel indicator of poor prognosis and may be a potential target gene for cancer therapy in patients with PC.
2. Materials and methods
2.1. Collection of clinical information and preparation of tissue microarrays
All patients who were hospitalized with pancreatic cancer between January 2004 and May 2012 were enrolled by the Department of Pathology, Affiliated Hospital of Nantong University, Jiangsu, China. Each patient had undergone pancreatectomy and none of patients had treated with radio therapy or chemotherapy before operation. All resected specimens were diagnosed with pancreatic cancer and then determined the pathological tumor node metastasis (TNM) stage using the criteria of the seventh version of the Union for International Cancer Control (UICC) TNM Classification Of Malignant Tumors, 2009. All patients had been closely follow-up after surgical treatment until their death or the beginning of this article. Subsequently, we selected 12 fresh pancreatic cancer tissues and 12 surrounding normal tissues as controls for mRNA determination by qRT-PCR. Another 160 FFPE tissue samples of pancreatic cancer and 68 control specimens, including 37 matched normal surgical margins and 31 benign pancreatic lesions, were prepared as TMA for GRO-α protein detection by IHC method.
The current study was authorized by the Human Ethical Research Committee. Informed consent was in advance attained from all patients.
2.2. RNA extraction and qRT-PCR analyses
As previously described,[23] 24 fresh frozen tissues (including 12 fresh pancreatic cancer and 12 surrounding normal tissues) were prepared for RNA extraction by RNeasy Plus Mini Kit (74134, Qiagen, Germany). Total RNA was subsequently reverse transcribed into complementary DNA (cDNA). 18S rRNA (4453320, Life Technologies) was purchased and applied as an internal standard. qRT-PCR was presented with the SYBR Green PCR Master Mix (Toyobo, Osaka, Japan) according to the standard protocol and amplified with target gene-specific primers. The primer sequences for GRO-α were 5′- GAT TGT GCC TAA TGT GTT -3′ (sense) and 5′- ATC CAG ATT GAA CTA ACT TG -3′ (antisense). The reaction cycles were as follows: 10 minutes at 95 °C for Taq activation, after that, 40 cycles were carried out with 15 seconds at 95 °C and 60 seconds at 60 °C. The whole process was done in triplicate.
2.3. Tissue microarray construction
As previously described,[23] a total of 160 FFPE PC tissues and 68 matched normal tissues were used for TMA construction. The Tissue Microarray System (Quick-Ray, UT06, UNITMA, Korea) was performed to manufacture 2 mm thick, FFPE pancreatic cancer TMA sections. Then, the individual TMA sections were moved to the new slides and numbered in sequence, preparing for IHC staining.
2.4. Immunohistochemical staining and scoring
IHC staining was performed as previously described.[23] Firstly, deparaffinage, antigen retrieval, and quenching the activity of endogenous peroxidase with 3% H2O2 for 20 minutes were carried through in turn for the TMA slides. Then the slides were incubated with the primary anti-GRO-α antibody (0.5 μg/mL, ab 86436, Abcam, Hong Kong) at 4 °C overnight. After washing with phosphate-buffered saline (PBS), horseradish peroxidase (HRP) labeled anti-rabbit secondary antibody was subsequently added at room temperature for 30 minutes. Finally, slides were colorized using 3,3-diaminobenzidine (DAB) and restained with hematoxylin. For negative controls, PBS was used instead of the primary antibody.
The results of IHC staining were evaluated under an optical microscope by 2 independent, trained pathologists in a double-blind method. Expression levels of GRO-α protein were analyzed as previously described.[24] Briefly, in each individual TMA section, the percentage of GRO-α positive cell was scored as follows: 0 represents 0% staining, 1 represents 1% to 33%, 2 represents 34% to 66%, and 3 represents 67% to 100%. The intensity of GRO-α staining was also scored as follows: 0 represents no color, 1 represents mild staining, 2 represents moderate positive staining, and 3 represents intensely positive staining. Thus, we defined that the product of above 2 components as the final score for further data analysis.
As previously described,[23] the X-tile software was performed to determine the cutoff value for GRO-α protein expression score which was statistically significantly correlated with overall survival (OS).
2.5. Statistical analyses
The SPSS20.0 software was presented to calculate for data statistical analysis. A paired t test was performed for comparison of GRO-α mRNA expression and a Pearson χ2 test was performed to differ from GRO-α expression between cancerous pancreatic tissues and normal pancreatic tissues, and for the correlation between GRO-α and clinicopathologic characteristics. Univariate and multivariate analyses were presented with the Cox proportional hazards regression model. The Kaplan–Meier method was performed to construct overall survival curves. In the current study, of all analyses, P < 0.05 was deemed to be statistically significant.
3. Results
3.1. Analysis of GRO-α mRNA expression in pancreatic cancer by qRT-PCR
qRT-PCR was performed to detect the expression of GRO-α mRNA in pancreatic cancer and corresponding adjacent normal tissues. We observed that the expression of GRO-α mRNA relative to expression of the 18 seconds internal control rRNA was higher in pancreatic cancer tissues than that in adjacent normal tissues (1.399 ± 0.165 vs. 0.870 ± 0.103; t = 1.75, P = 0.012). The average level of GRO-α mRNA was 1.61-fold higher in pancreatic cancer compared with tumor-adjacent normal tissues (Fig. 1).
Figure 1.
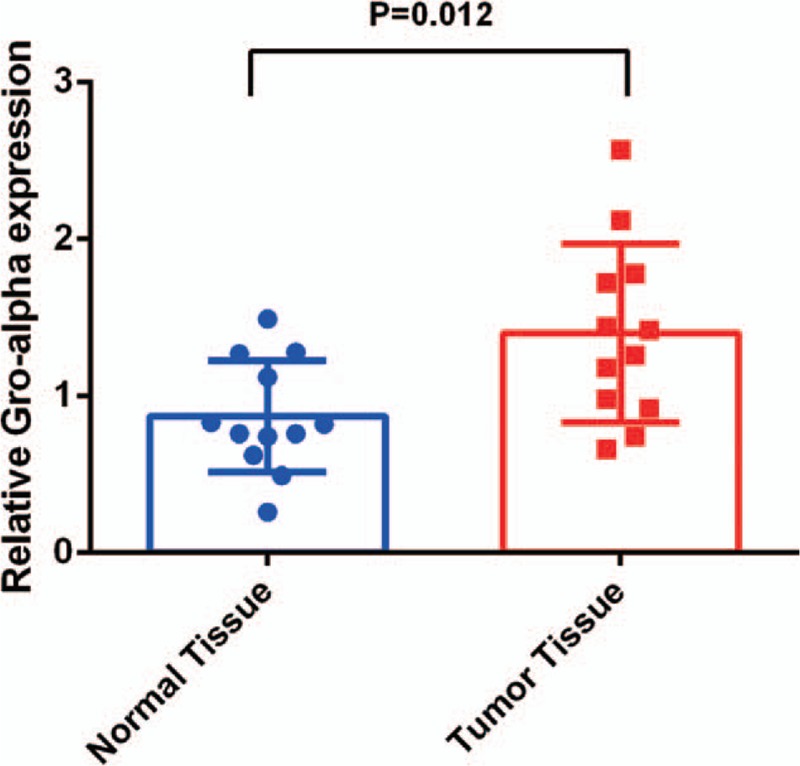
Mean GRO-α mRNA expression level normalized to that of 18S rRNA by qRT-PCR. GRO-α = growth-regulated oncogene-alpha, qRT-PCR = quantitative real-time polymerase chain reaction.
3.2. Detection of GRO-α expression in pancreatic cancer by IHC
To investigate the expression levels and location of GRO-α protein in cancer tissues, IHC was performed on TMA paraffin-fixed of 160 pancreatic cancer tissues and 68 matched non-cancerous specimens. GRO-α protein was primarily expressed in the cytoplasm of cancer cells and stromal cells, presented as brown particles, while low or no positive signals were detected in the nuclei of cancer cells and no positive signals in normal pancreatic ductal epithelial cells (Fig. 2).
Figure 2.
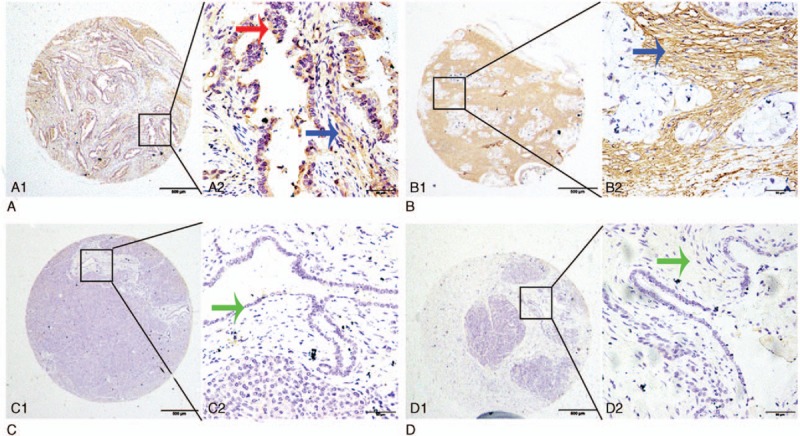
Representative pattern of GRO-α expression in pancreatic cancer (PC), adjacent noncancerous tissue, and benign pancreatic disease tissues by immunostaining of TMA sections. A1 and A2, Strong positive tumor cytoplasmic immunohistochemical staining (red arrow) and stromal staining (blue arrow) of GRO-α in PC samples. B1 and B2, Strong stromal immunohistochemical staining (blue arrow) of GRO-α in PC samples. C1 and C2, Negative staining for GRO-α in epithelial cells (green arrow) in adjacent noncancerous tissue. D1 and D2, Negative immunohistochemical staining for GRO-α in benign pancreatic stromal cells (green arrow). Original magnification ×40 (bar = 500 μm) in A1, B1, C1, and D1; ×400 (bar = 50 μm) in A2, B2, C2, and D2. GRO-α = growth-regulated oncogene-alpha.
Here, we defined 60% as the cutoff point in GRO-α level in cytoplasm of cancer cells and in stroma (P = 0.008 and P = 0.002, respectively) by using X-tile software program. Finally, we defined that the score from percentage and intensity which was higher than 60% as high expression, on the contrary, the score which was lower than 60% was considered as low expression. High GRO-α expression in the cytoplasm of cancer cells was detected in 41.88% (67/160, Table 1) of cancerous samples, compared with 8.8% (6/68, Table 1) of matched control samples, and high expression of GRO-α in the stroma was detected in 40.62% (65/160, Table 1) of cancerous samples compared with 25.00% (17/68, Table 1) of normal control samples.
Table 1.
Cytoplasmic and stromal staining of GRO-α expression in pancreatic benign and cancerous tissues.

3.3. GRO-α protein expression in pancreatic cancer
Although high GRO-α protein expression was detected in benign pancreatic lesions and normal surgical margins, the frequency of high GRO-α protein expression in the cytoplasm of cancer cells and stroma was significantly higher in pancreatic cancers (P < 0.001 and P = 0.030, respectively; Table 1).
3.4. Relationship between GRO-α protein expression and clinical characteristics
The relationship between levels of GRO-α protein and the clinicopathologic parameters of pancreatic cancer is shown in Table 2. Pearson χ2 analysis showed that positive GRO-α expression in the cytoplasm of cancer cells was inversely correlated with tumor location (P = 0.047), but positively correlated with T classification (P = 0.001), distant metastasis (P < 0.001), and TNM stage (P < 0.001, Fig. 3). In contrast, no significant correlation was found for sex, age, degree of differentiation, perineural invasion, vascular invasion, and lymphatic metastasis (Table 2). High GRO-α expression in the stroma was correlated with perineural invasion (P = 0.010), T classification (P = 0.006) and TNM stage (P = 0.004, Fig. 3), and was marginally associated with distant metastasis (P = 0.056), while there was no significant correlation with sex, age, tumor location, degree of differentiation, vascular invasion, or lymphatic metastasis (Table 2).
Table 2.
Relationship between the expression of GRO-α and clinicopathological characteristics in pancreatic cancer.
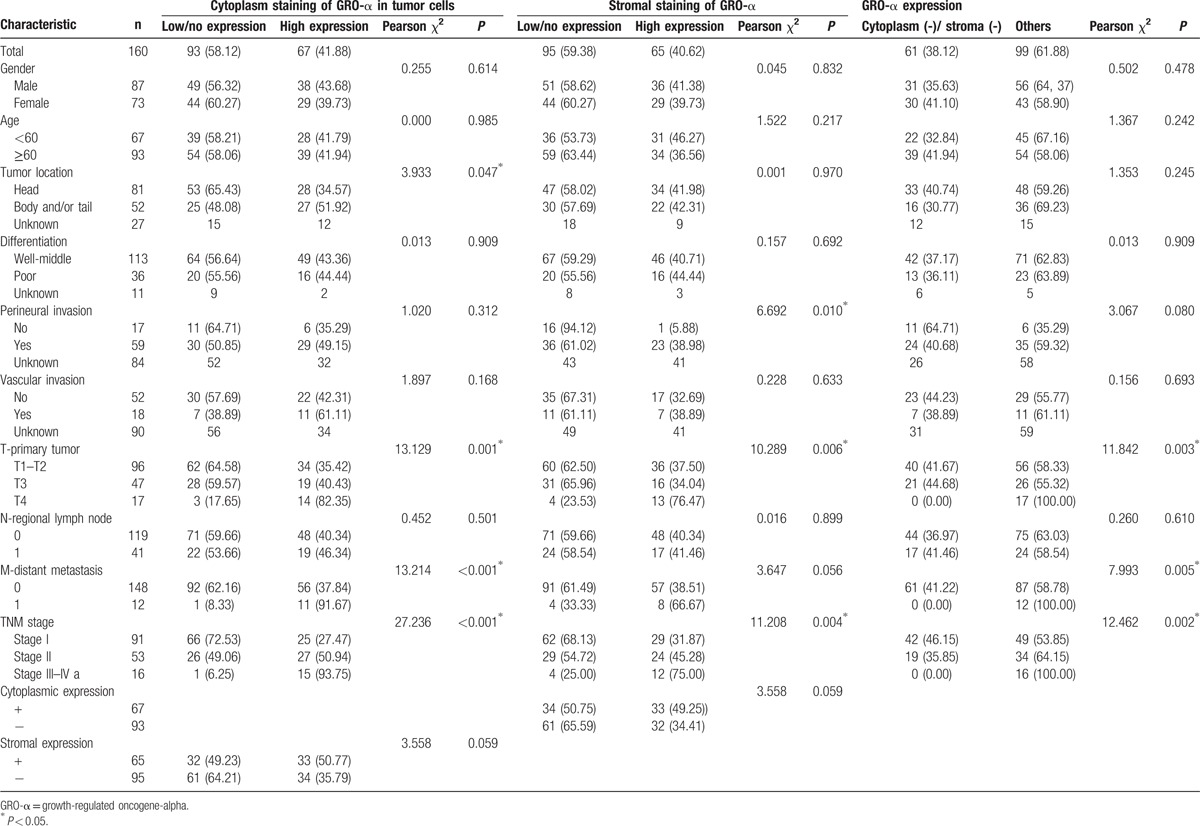
Figure 3.
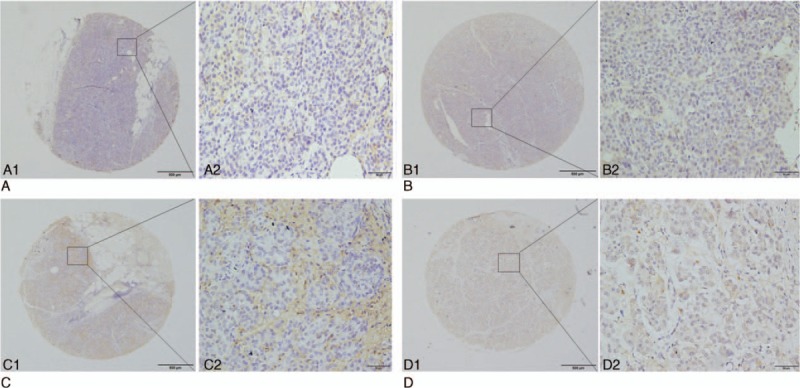
GRO-α expression in pancreatic cancer (PC) with different TNM stages by IHC. A1 and A2 (PC patient with TNM stage I A) showed light positive expression of GRO-α, and B1 and B2 (TNM stage II A) showed mild to moderate positive expression of GRO-α, while C1 and C2 (TNM stage III) and D1 and D2 (TNM stage IV) showed strong positive expression of GRO-α. Original magnification ×40 (bar = 500 μm) in A1, B1, C1, and D1; ×400 (bar = 50 μm) in A2, B2, C2, and D2. GRO-α = growth-regulated oncogene-alpha, IHC = immunohistochemistry, TNM = tumor node metastasis.
Low or absent GRO-α expression in both the cytoplasm of cancer cells and stroma (61/160 patients) was associated with T classification (P = 0.003), distant metastasis (P = 0.005), and TNM stage (P = 0.002; Table 2).
3.5. Over-expression of GRO-α in pancreatic cancer is associated with poor prognosis
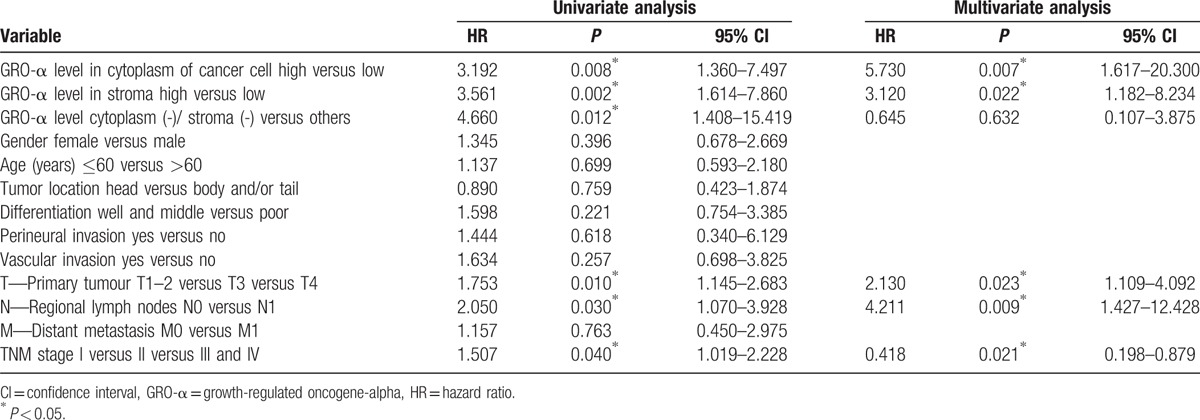
Univariate analysis showed a correlation between T classification (P = 0.010), lymph node metastasis (P = 0.030), TNM classification (P = 0.040), low or absent GRO-α co-expression (P = 0.012), and positive GRO-α expression in the cytoplasm of cancer cells (P = 0.008) or stroma (P = 0.002) and the lifespan of patients with pancreatic cancer (Table 3). Multivariate Cox regression analysis further demonstrated that high GRO-α expression in the cytoplasm of cancer cells (HR = 5.730, P = 0.007) or stroma (HR = 3.120, P = 0.022), T classification (HR = 2.130, P = 0.023), lymphatic metastasis (HR = 4.211, P = 0.009), and TNM classification (HR = 0.481, P = 0.031) were independent prognostic factors for overall survival (Table 3).
Table 3.
Univariate and multivariate analysis of prognostic markers for overall survival in pancreatic cancer patients.
Kaplan–Meier survival curves showed that pancreatic cancer patients with positive GRO-α expression in the cytoplasm of cancer cells exhibited significantly poorer survival time than those with negative GRO-α expression (Fig. 4a), and that high levels of GRO-α in the stroma were also associated with an unfavorable survival time (Fig. 4b). In addition, the OS rate in patients with advanced stage of TNM (Stage II [green line] and Stage III–IV [yellow line]) was significantly lower than that of patients with early-stage disease (Stage I, [blue line]) (Fig. 4c). Moreover, patients who underwent node metastasis (green line) had a significantly poorer survival time than those with no node infiltration (blue line; Fig. 4d).
Figure 4.
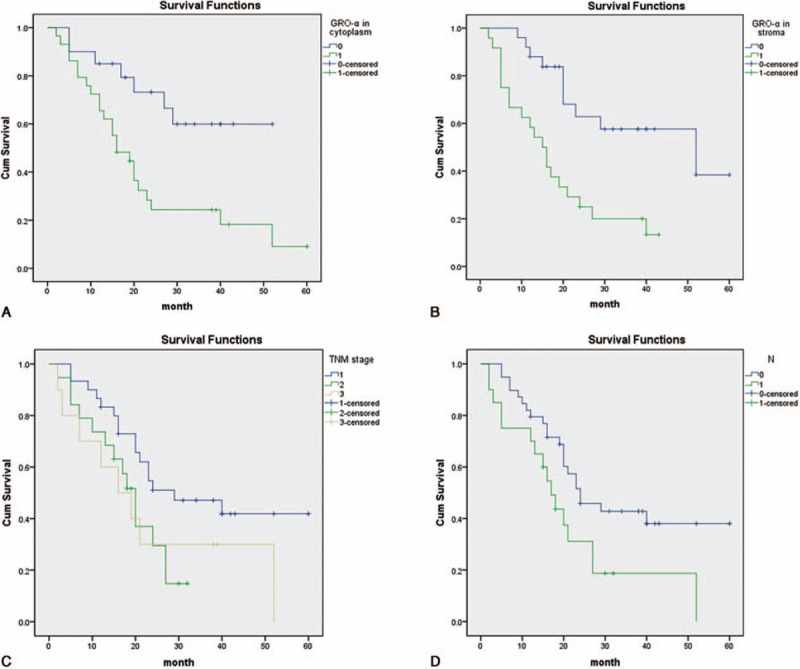
Survival analysis of PC patients by the Kaplan–Meier method and log-rank test. (A) Overall survival rate in patients with high cytoplasmic GRO-α expression (green line) was significantly lower than that in patients with low or no cytoplasmic GRO-α expression (blue line). (B) Overall survival rate in patients with high stromal GRO-α expression (green line) was significantly lower than that in patients with low or no stromal GRO-α expression (blue line). (C) Overall survival rate in patients with advanced stage of TNM (Stage II [green line] and Stage III–IV [yellow line]) was significantly lower than that of patients with early stage (Stage I, blue line). (D) Overall survival rate in patients with node metastasis (green line) was significantly lower than that in patients with no node metastasis (blue line). GRO-α = growth-regulated oncogene-alpha, TNM = tumor node metastasis.
4. Discussion
To date, potential predictive molecular markers for pancreatic cancer have been extensively investigated and some are identified to be significantly correlated with clinicopathologic characteristics and survival,[25] but there is little information on the prognostic value of GRO-α.
Members of GRO protein family are detected in many cancer types, and GRO-α is frequently over-expressed in many cancers, including squamous cell carcinoma,[13] colorectal cancer,[14] breast cancer,[16] prostate cancer,[17] and ovarian cancer.[20] In addition, GRO-α is involved in many biologic activities. For example, GRO-α is involved in carcinogenesis of melanoma.[15] In epithelial ovarian cancer, GRO-α activates the mitogen-activated protein kinase signaling via trans-activating the epidermal growth factor receptor (EGFR), thus leading to cancer cell proliferation.[26] In gastric cancer, GRO-α reinforces expression of vascular endothelial growth factor (VEGF) via activating the JAK2-STAT3 signaling and ultimately stimulates angiogenesis and tumor growth.[27] Additionally, this chemokine was found to act as an effective mediator of tumor-associated angiogenesis in Kaposi's sarcoma[10] and colorectal,[28] breast[29], and non-small-cell lung cancers (NSCLC).[30] In a previous study,[31] researchers detected that levels of CXCL1, 2, 3, 5, and 8 were elevated in tumor cells and high expression of CXCL1 tend to inhibit cell viability, invasion, and proliferation via down-regulating the most markedly up-regulated group member conduced by ShRNA. And down-regulation of CXCL1 led to strongly preventing from tumor growth in vivo. Altogether, these evidences confirm that CXCL1/GRO-α plays an important role in various malignant tumors through its involvement in tumor generation, proliferation, migration, and invasion. On the basis of these findings, we suggest that GRO-α expression might also act as a considerable accelerator in pancreatic cancer. In the current study, firstly the qRT-PCR was performed in small samples of cancerous and benign pancreatic tissues to examine the expression of GRO-α mRNA and showed a markedly increased level in cancerous tissues. Further, we generated tissue microarrays from resected pancreatic cancer specimens and normal control samples for IHC staining. Consistent with the qRT-PCR result, higher GRO-α protein expression was found in pancreatic cancer than in adjacent noncancerous tissues, indicating that GRO-α promoted development of pancreatic cancer.
Furthermore, we investigated the correlation between GRO-α expression and OS in patients with pancreatic cancer. Multivariate analysis showed that positive GRO-α expression in cytoplasm of cancer cells, positive GRO-α expression in stroma, T classification, lymphatic metastasis, and TNM classification were markedly correlated with the OS of patients with pancreatic cancer. Kaplan–Meier analysis indicated that the OS of PC patients with positive GRO-α expression was evidently shorter compared with those of negative expression.
CXCR2, the receptor of CXCL1, CXCL2, and IL8, has primarily been studied in leukocytes, including neutrophils,[32] monocytes,[33] and macrophages,[34] in association with inflammatory diseases and immune responses. However, up-regulation of CXCR2 has also been correlated with tumorigenesis, cancer tissue angiogenesis, and metastasis of several cancers, including prostate,[35,36] ovarian,[20] and pancreatic[37] cancers. Over-expression of CXCR2 also predicted a poor OS and disease-free survival (DFS) in patients with high-grade serous ovarian cancer.[20] In gastric cancer,[38] researchers reported that patients with increased expression of GRO-α together with its receptor CXCR2 was significantly correlated with tumor progression and with more advanced TNM stages, and concordantly, patients with lower GRO-α and CXCR2 expressions had a relative better prognosis. Consistent with this, high expression of GRO-α in breast cancer is always related to an unfavorable survival.[39] In a study of patients with NSCLC,[40] patients with malignant pleural effusion (MPE) had a short median survival time and increased regulatory T cells (Treg). The authors showed that the miR141-CXCL1-CXCR2 pathway regulates progression of NSCLC, and that decreased level of miR141 correlates with the survival of NSCLC patients with MPE, resulted in increased expression of CXCL1 and recruitment of Tregs to facilitate immune escape of the tumor.
Nonetheless, the contribution of GRO-α and its receptor CXCR2 to clinical features and survival of patients with pancreatic cancer remains obscure, and further studies are required for precise evaluation of the therapeutic and prognostic values of GRO-α and CXCR2 in pancreatic carcinoma.
In conclusion, to our knowledge, the current study is firstly to evaluate GRO-α expression in pancreatic cancer. Our findings indicated high expression of GRO-α in pancreatic cancer tissues, which was associated with a poor prognosis for patients. GRO-α may be a novel therapeutic target and has potential as a valuable prognostic biomarker of pancreatic cancer. Further research is necessary to clarify the precise mechanisms of action of GRO-α in pancreatic cancer.
Footnotes
Abbreviations: FFPE = formalin-fixed, paraffin-embedded, GRO-α = growth-regulated oncogene-alpha, IHC = immunohistochemistry, OS = overall survival, PBS = phosphate-buffered saline, PC = pancreatic cancer, PDA = pancreatic ductal adenocarcinoma, qRT-PCR = quantitative real-time polymerase chain reaction, TMA = tissue microarrays, TNM = tumor node metastasis.
This study was supported by the Social Development and Applied Research Projects (HS2014003) of Nantong; the Six Talent Peaks project (WSW-029) in Jiangsu; and translational medicine research (TDFzh2014011) from the Affiliated Hospital of Nantong University, Jiangsu, China.
The authors have no conflicts of interest to disclose.
References
- 1.Stathis A, Moore MJ. Advanced pancreatic carcinoma: current treatment and future challenges. Nat Rev Clin Oncol 2010; 7:163–172. [DOI] [PubMed] [Google Scholar]
- 2.Chen W, Zheng R, Baade PD, et al. Cancer statistics in China, 2015. CA Cancer J Clin 2016; 66:115–132. [DOI] [PubMed] [Google Scholar]
- 3.Hidalgo M. Pancreatic cancer. N Engl J Med 2010; 362:1605–1617. [DOI] [PubMed] [Google Scholar]
- 4.Gong Z, Holly EA, Bracci PM. Survival in population-based pancreatic cancer patients: San Francisco Bay area, 1995-1999. Am J Epidemiol 2011; 174:1373–1381. [DOI] [PMC free article] [PubMed] [Google Scholar]
- 5.Mitchem JB, Hamilton N, Gao F, et al. Long-term results of resection of adenocarcinoma of the body and tail of the pancreas using radical antegrade modular pancreatosplenectomy procedure. J Am Coll Surg 2012; 214:46–52. [DOI] [PubMed] [Google Scholar]
- 6.Hernandez JM, Morton CA, Al-Saadi S, et al. The natural history of resected pancreatic cancer without adjuvant chemotherapy. Am Surg 2010; 76:480–485. [PubMed] [Google Scholar]
- 7.Vincent A, Herman J, Schulick R, et al. Pancreatic cancer. Lancet 2011; 378:607–620. [DOI] [PMC free article] [PubMed] [Google Scholar]
- 8.Zlotnik A, Yoshie O. The chemokine superfamily revisited. Immunity 2012; 36:705–716. [DOI] [PMC free article] [PubMed] [Google Scholar]
- 9.Richmond A, Lawson DH, Nixon DW, et al. Characterization of autostimulatory and transforming growth factors from human melanoma cells. Cancer Res 1985; 45 (12 Pt 1):6390–6394. [PubMed] [Google Scholar]
- 10.Lane BR, Liu J, Bock PJ, et al. Interleukin-8 and growth-regulated oncogene alpha mediate angiogenesis in Kaposi's sarcoma. J Virol 2002; 76:11570–11583. [DOI] [PMC free article] [PubMed] [Google Scholar]
- 11.Anisowicz A, Bardwell L, Sager R. Constitutive overexpression of a growth-regulated gene in transformed Chinese hamster and human cells. Proc Natl Acad Sci USA 1987; 84:7188–7192. [DOI] [PMC free article] [PubMed] [Google Scholar]
- 12.Wang B, Hendricks DT, Wamunyokoli F, et al. A growth-related oncogene/CXC chemokine receptor 2 autocrine loop contributes to cellular proliferation in esophageal cancer. Cancer Res 2006; 66:3071–3077. [DOI] [PubMed] [Google Scholar]
- 13.Warner KA, Miyazawa M, Cordeiro MM, et al. Endothelial cells enhance tumor cell invasion through a crosstalk mediated by CXC chemokine signaling. Neoplasia 2008; 10:131–139. [DOI] [PMC free article] [PubMed] [Google Scholar]
- 14.Verbeke H, Struyf S, Laureys G, et al. The expression and role of CXC chemokines in colorectal cancer. Cytokine Growth Factor Rev 2011; 22:345–358. [DOI] [PubMed] [Google Scholar]
- 15.Dhawan P, Richmond A. Role of CXCL1 in tumorigenesis of melanoma. J Leukoc Biol 2002; 72:9–18. [PMC free article] [PubMed] [Google Scholar]
- 16.Zou A, Lambert D, Yeh H, et al. Elevated CXCL1 expression in breast cancer stroma predicts poor prognosis and is inversely associated with expression of TGF-beta signaling proteins. BMC Cancer 2014; 14:781. [DOI] [PMC free article] [PubMed] [Google Scholar]
- 17.Miyake M, Lawton A, Goodison S, et al. Chemokine (C-X-C motif) ligand 1 (CXCL1) protein expression is increased in high-grade prostate cancer. Pathol Res Pract 2014; 210:74–78. [DOI] [PubMed] [Google Scholar]
- 18.Cheng WL, Wang CS, Huang YH, et al. Overexpression of CXCL1 and its receptor CXCR2 promote tumor invasion in gastric cancer. Ann Oncol 2011; 22:2267–2276. [DOI] [PubMed] [Google Scholar]
- 19.Cao Z, Fu B, Deng B, et al. Overexpression of Chemokine (C-X-C) ligand 1 (CXCL1) associated with tumor progression and poor prognosis in hepatocellular carcinoma. Cancer Cell Inter 2014; 14:86. [DOI] [PMC free article] [PubMed] [Google Scholar]
- 20.Yang G, Rosen DG, Zhang Z, et al. The chemokine growth-regulated oncogene 1 (Gro-1) links RAS signaling to the senescence of stromal fibroblasts and ovarian tumorigenesis. Proc Natl Acad Sci USA 2006; 103:16472–16477. [DOI] [PMC free article] [PubMed] [Google Scholar]
- 21.Ogata H, Sekikawa A, Yamagishi H, et al. GROalpha promotes invasion of colorectal cancer cells. Oncol Rep 2010; 24:1479–1486. [PubMed] [Google Scholar]
- 22.Miyake M, Lawton A, Goodison S, et al. Chemokine (C-X-C) ligand 1 (CXCL1) protein expression is increased in aggressive bladder cancers. BMC Cancer 2013; 13:322. [DOI] [PMC free article] [PubMed] [Google Scholar]
- 23.Sun R, Wang X, Zhu H, et al. Prognostic value of LAMP3 and TP53 overexpression in benign and malignant gastrointestinal tissues. Oncotarget 2014; 5:12398–12409. [DOI] [PMC free article] [PubMed] [Google Scholar]
- 24.Huang J, Zhang X, Tang Q, et al. Prognostic significance and potential therapeutic target of VEGFR2 in hepatocellular carcinoma. J Clin Pathol 2011; 64:343–348. [DOI] [PubMed] [Google Scholar]
- 25.Dabritz J, Preston R, Hanfler J, et al. Follow-up study of K-ras mutations in the plasma of patients with pancreatic cancer: correlation with clinical features and carbohydrate antigen 19-9. Pancreas 2009; 38:534–541. [DOI] [PubMed] [Google Scholar]
- 26.Bolitho C, Hahn MA, Baxter RC, et al. The chemokine CXCL1 induces proliferation in epithelial ovarian cancer cells by transactivation of the epidermal growth factor receptor. Endocr Relat Cancer 2010; 17:929–940. [DOI] [PubMed] [Google Scholar]
- 27.Wei ZW, Xia GK, Wu Y, et al. CXCL1 promotes tumor growth through VEGF pathway activation and is associated with inferior survival in gastric cancer. Cancer Lett 2015; 359:335–343. [DOI] [PubMed] [Google Scholar]
- 28.Wang D, Wang H, Brown J, et al. CXCL1 induced by prostaglandin E2 promotes angiogenesis in colorectal cancer. J Exp Med 2006; 203:941–951. [DOI] [PMC free article] [PubMed] [Google Scholar]
- 29.Caunt M, Hu L, Tang T, et al. Growth-regulated oncogene is pivotal in thrombin-induced angiogenesis. Cancer Res 2006; 66:4125–4132. [DOI] [PubMed] [Google Scholar]
- 30.Arenberg DA, Polverini PJ, Kunkel SL, et al. The role of CXC chemokines in the regulation of angiogenesis in non-small cell lung cancer. J Leukoc Biol 1997; 62:554–562. [DOI] [PubMed] [Google Scholar]
- 31.Bandapalli OR, Ehrmann F, Ehemann V, et al. Down-regulation of CXCL1 inhibits tumor growth in colorectal liver metastasis. Cytokine 2012; 57:46–53. [DOI] [PubMed] [Google Scholar]
- 32.Del Rio L, Bennouna S, Salinas J, et al. CXCR2 deficiency confers impaired neutrophil recruitment and increased susceptibility during Toxoplasma gondii infection. J Immunol 2001; 167:6503–6509. [DOI] [PubMed] [Google Scholar]
- 33.Weber C, Kraemer S, Drechsler M, et al. Structural determinants of MIF functions in CXCR2-mediated inflammatory and atherogenic leukocyte recruitment. Proc Natl Acad Sci USA 2008; 105:16278–16283. [DOI] [PMC free article] [PubMed] [Google Scholar]
- 34.Boisvert WA, Rose DM, Johnson KA, et al. Up-regulated expression of the CXCR2 ligand KC/GRO-alpha in atherosclerotic lesions plays a central role in macrophage accumulation and lesion progression. Am J Pathol 2006; 168:1385–1395. [DOI] [PMC free article] [PubMed] [Google Scholar]
- 35.Murphy C, McGurk M, Pettigrew J, et al. Nonapical and cytoplasmic expression of interleukin-8, CXCR1, and CXCR2 correlates with cell proliferation and microvessel density in prostate cancer. Clin Cancer Res 2005; 11:4117–4127. [DOI] [PubMed] [Google Scholar]
- 36.Huang J, Yao JL, Zhang L, et al. Differential expression of interleukin-8 and its receptors in the neuroendocrine and non-neuroendocrine compartments of prostate cancer. Am J Pathol 2005; 166:1807–1815. [DOI] [PMC free article] [PubMed] [Google Scholar]
- 37.Matsuo Y, Raimondo M, Woodward TA, et al. CXC-chemokine/CXCR2 biological axis promotes angiogenesis in vitro and in vivo in pancreatic cancer. Int J Cancer 2009; 125:1027–1037. [DOI] [PubMed] [Google Scholar]
- 38.Xiang Z, Jiang DP, Xia GG, et al. CXCL1 expression is correlated with Snail expression and affects the prognosis of patients with gastric cancer. Oncol Lett 2015; 10:2458–2464. [DOI] [PMC free article] [PubMed] [Google Scholar]
- 39.Zou A. Role of CXCL1 Signaling in Stroma: Epithelium Interactions During Breast Cancer Progression. 2014. [Google Scholar]
- 40.Lv M, Xu Y, Tang R, et al. miR141-CXCL1-CXCR2 signaling-induced Treg recruitment regulates metastases and survival of non-small cell lung cancer. Mol Cancer Ther 2014; 13:3152–3162. [DOI] [PubMed] [Google Scholar]


