Supplemental Digital Content is available in the text
Keywords: cardiovascular mortality, diabetes mellitus, health disparity, mortality, socioeconomic status
Abstract
Both low socioeconomic status (SES) and diabetes mellitus (DM) are important risk factors for mortality. However, little is known about their combined effects and relative contribution to the mortality risk.
From a nationwide cohort provided by the National Health Insurance Service in Korea, 153,075 subjects who were over 30 years of age from 2003 to 2004 were followed-up until 2010. The SESs of the subjects in the DM and non-DM (NDM) groups were categorized into 3 groups (highest 30% as S1, middle 40% as S2, and lowest 30% as S3) based on the subjects’ income levels.
During the 7.9-year follow-up, 3933 deaths occurred. When the subjects were stratified into 6 groups by their socioeconomic and diabetes status, a linearly increasing pattern of the hazard ratio (HR) of mortality from the higher SES without diabetes group (NDM-S1, as a reference) to the lower SES with diabetes group (DM-S3; HR, 2.04, 95% confidence interval (CI), 1.80–2.36) was observed (P for trend < 0.001). Notably, subjects with DM in the highest SES group (DM-S1) had a significantly higher mortality risk than did non-DM subjects in the lowest SES group (NDM-S3). This pattern was maintained in cause-specific mortality but was more prominent in cardiovascular disease (CVD) and less prominent in cancer mortality. The association was not affected by gender; however, in individuals <60 years of age, the combined effects of SES and DM on mortality were more prominent (DM-S3; HR, 3.68, 95% CI, 2.95–4.60) than in those ≥60 years of age.
Low SES and DM were major determinants of mortality and synergistically increased the risks of all-cause, CVD, and cancer mortality.
1. Introduction
Diabetes mellitus (DM), with its increasing prevalence and economic burden, is a major health problems worldwide.[1,2] Recently, the increasing epidemic of diabetes has become prominent, particularly in Asian countries.[3] In Korea, the prevalence of diabetes has increased continuously over last few decades and is currently approximately 11.0%.[4] It is also a well-known risk factor for cardiovascular diseases (CVDs) and mortality.[5]
Socioeconomic status (SES) is the economic and sociological position of an individual in a society, which is commonly measured by education level, income, residential area, and occupation.[6] Epidemiologic studies already have shown that there is health inequality in the general population with differing SES; a low educational level or low income gives rise to higher incidence rates of various diseases and a higher risk of mortality.[7,8] Poor nutritional status, a lack of access to medical care, a lack of time for physical activity, and psychological distress contribute to adverse health outcomes in people with a low SES.[6,9,10]
SES also contributes to the morbidity and mortality of subjects with diabetes. Previous cohort studies have indicated that the incidence of type 2 diabetes, diabetes-related morbidity, and all-cause and cardiovascular mortality were higher in diabetic subjects with a low SES than in those with a high SES.[11–15] However, few studies have evaluated the combined effects of SES and DM on mortality. In other words, we questioned whether DM and low SES synergistically increased the mortality risk and how diabetic subjects with a high SES had different mortality risks compared to nondiabetic subjects with a low SES. In addition, we wondered whether cause-specific mortality, including cardiovascular and cancer mortality, would be differently affected by DM for different SES groups.
To answer these questions, we analyzed the National Health Insurance Service (NHIS) cohort (2002–2010), which is a nationwide longitudinal cohort in Korea. We examined and compared the all-cause, CVD, and cancer mortality risks in subjects with and without DM stratified by different SES levels based on income.
2. Methods
2.1. Study population
South Korea has a National Health Insurance System (NHIS) that encompasses all citizens living in South Korea. The NHIS also manages all individual health-related information and health service utilization. The recently released NHIS Cohort (2002–2010) database consists of 1,025,340 Koreans, which is a representative sample of 2.2% from the all-population data. It is longitudinally structured from 2002 to 2010. It contains demographic information regarding health insurance and medical information, including medical histories, treatments, and prescriptions. Importantly, this cohort contains the general health examination data of subjects who participated in biannual examinations and is merged with death records. The proportion of subjects participating in the health examinations was about 10% to 15% annually. Detailed information about the NHIS cohort was included in our previously published article.[16]
From this cohort, we selected subjects over 30 years of age who had undergone at least 1 health examination between 2003 and 2004. We then excluded subjects who had preexisting CVD or cancer to minimize reverse causal relationship. Therefore, 153,075 subjects were included at baseline. The mean duration of follow-up was 7.9 years.
This study was based on data from the NHIS; therefore, informed consent was not specifically obtained from each individual. This study was approved by the institutional review board of Korea University Anam Hospital (IRB number: ED14188).
2.2. Determinants of DM, SES, and mortality
DM was identified by 3 measures: clinic and pharmacy codes of the diseases from the Korean version of the International Classification of Disease, 10th revision (ICD-10); a self-reported medical history of DM; and laboratory data (fasting serum glucose ≥126 mg/dL).
The individual SES of the subjects was identified by their medical insurance premium. Because the medical insurance premium is directly proportional to income, and this cohort was systemically sampled by age, gender, and income level from the total population, we could objectively and precisely identify the subjects’ SES based on their income level. The income level was originally classified into 20 strata; therefore, we categorized the subjects’ SES into 3 groups (lowest 30%, middle 40%, and highest 30%).
Health examination data included basic anthropometric measurements, and the subjects’ weight, height, and systolic and diastolic blood pressure were recorded. Serum hemoglobin, total cholesterol, and serum glucose levels were measured after an overnight fast. Details on the frequency and amount of smoking, alcohol consumption, and physical activity were also obtained.
Death records from the National Statistical Office data were included in this cohort. Causes of death were classified by the Korean version of ICD-10 codes, including CVD death (I00–I99) and cancer death (C00–D48).
2.3. Statistical analyses
The mortality risk based on the SES classification and DM status was analyzed by the Cox proportional hazards regression model. We stratified all subjects into 2 groups based on the presence or absence of DM (DM and NDM) and 3 classes of SES (S1, S2, and S3 as the highest 30%, middle 40%, and lowest 30%, respectively). For most analyses, the reference group was NDM-S1. The hazard ratio (HR) and 95% confidence interval (CI) for each group relative to the reference group were estimated for all-cause, CVD, and cancer mortality after adjusting for confounding variables, including age, gender, body mass index (BMI), alcohol, smoking, and physical activity. We used simplified status classifications for smoking (current, former, or never); alcohol (drinker or nondrinker); and physical activity (no activity, ≤2 times/week, or ≥3 times/week).
We also conducted subgroups analyses stratified by gender (male and female) and age (<60 years old and ≥60 years old). The interaction between subgroups (P-interaction) was tested to examine the differences in the HRs across strata. All statistical analyses were performed by using SAS version 9.4 (SAS Institute, Inc., Cary, NC). All P values were 2-tailed, and values less than 0.05 were considered statistically significant.
3. Results
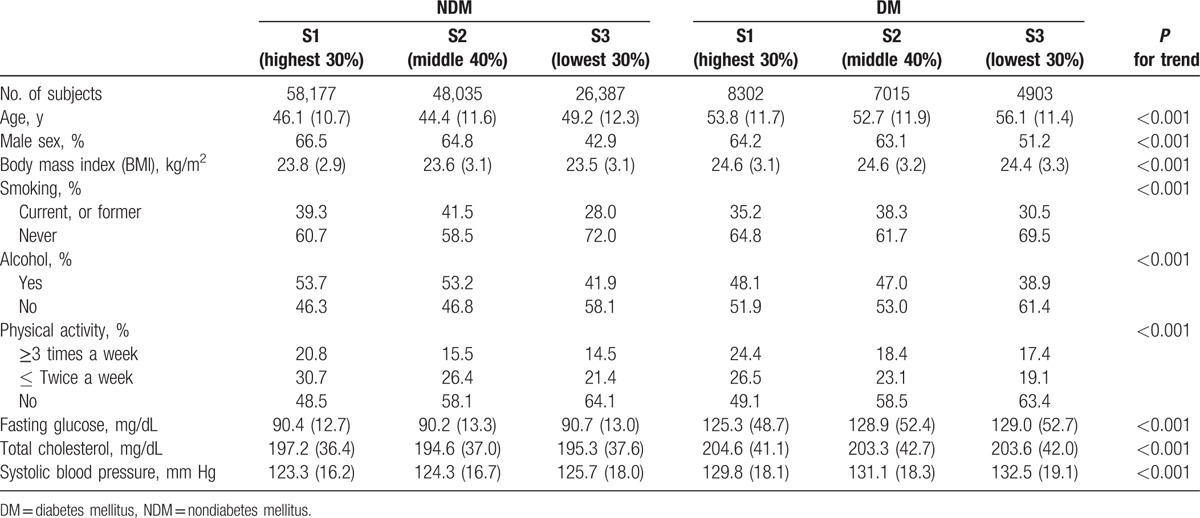
Table 1 shows the baseline characteristics of the 6 groups according to DM status (2 groups) and SES (3 classes) of the subjects. Subjects with DM were older and had a higher BMI than did those without DM. The proportion of physically active individuals (≥3 times/week) was highest in the S1 group and lowest in the S3 group of both the DM and NDM groups. Among the subjects with DM, the metabolic parameters differed depending on the SES; individuals in the S1 group had significantly lower fasting glucose levels and systolic blood pressure than did those in the S2 and S3 groups (Supplementary Table 1).
Table 1.
Baseline characteristics of subjects with and without diabetes, according to socioeconomic status.
The adjusted HRs of mortality were analyzed by the Cox proportional hazards regression model using the NDM-S1 group as a reference (Table 2). Generally increasing trends of the risks of all-cause, CVD, and cancer mortality were observed from the NDM-S1 to DM-S3 groups, and the increasing pattern was more prominent for CVD mortality than for cancer mortality. In a fully adjusted model, after adjusting for age, gender, BMI, smoking, alcohol, and physical activity, the DM-S2 and DM-S3 subjects had more than twice the risk of all-cause mortality (HR, 2.14 and 2.04, respectively) than did the NDM-S1 subjects, and the corresponding HR values for CVD mortality were 2.06 and 2.29, respectively. The DM-S1 group, as well as the DM-S2 and DM-S3 groups, had a significantly higher risk of all-cause mortality than did all three NDM groups (Fig. 1).
Table 2.
HRs for all-cause, CVD, and cancer mortality in subjects with and without diabetes, according to SES.
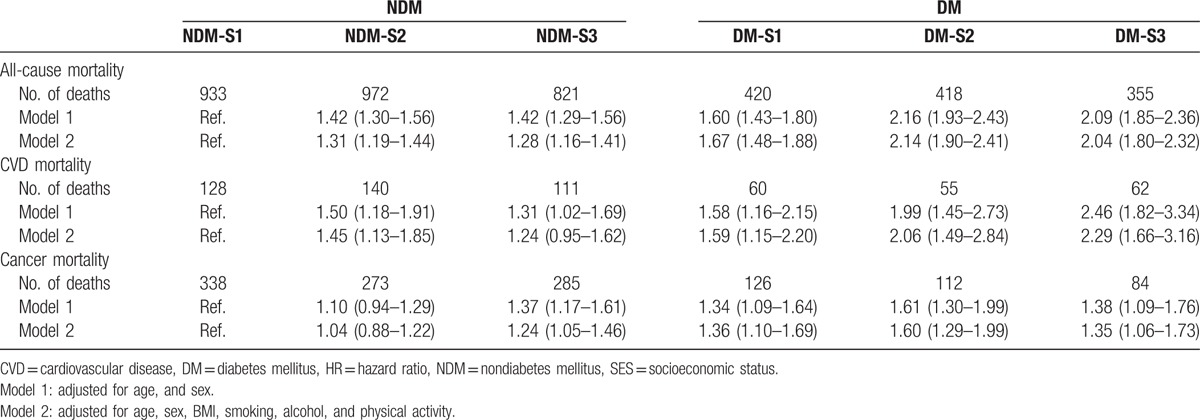
Figure 1.
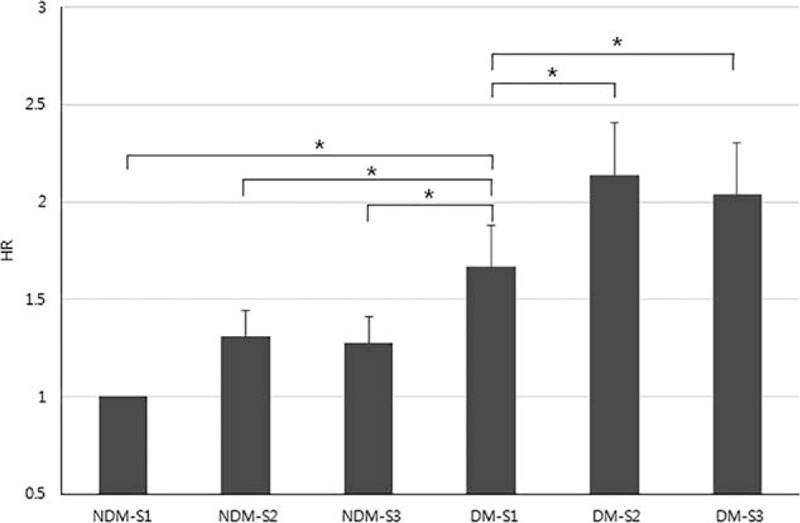
Differences in all-cause mortality according to SES and diabetes (adjusted for age, gender, BMI, smoking, alcohol, and physical activity) (∗P < 0.01).
In the subgroup analyses, the increasing pattern across the 6 strata was comparable in men and women. However, when analyzed by age, the increase in slope was steeper in individuals under 60 years of age than in those over 60 years (Fig. 2). The highest HR of all-cause mortality was 3.68 (95% CI, 2.95–4.60) in the DM-S3 group. Similar patterns were observed in the analyses of CVD and cancer mortality, although the statistical significance was attenuated because of the low number of cause-specific deaths (Supplementary Table 2).
Figure 2.
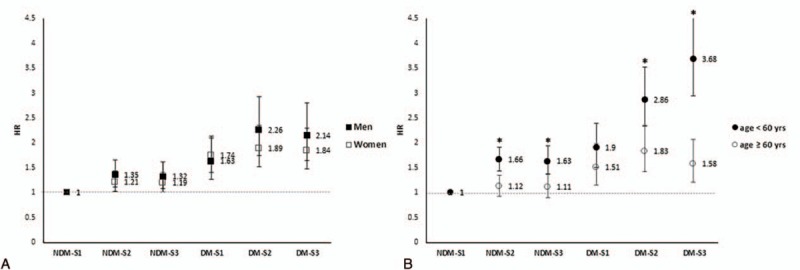
HRs for all-cause mortality according to SES and diabetes, stratified by gender and age (∗P-interaction < 0.01).
Because the effects of SES and DM on mortality were prominent in CVD deaths, we further analyzed the CVD incidence rates in each group (Fig. 3). Although the incidence rate of CVD was not significantly different in the DM group, the mortality risk was inversely associated with SES (a higher risk for a lower SES).
Figure 3.
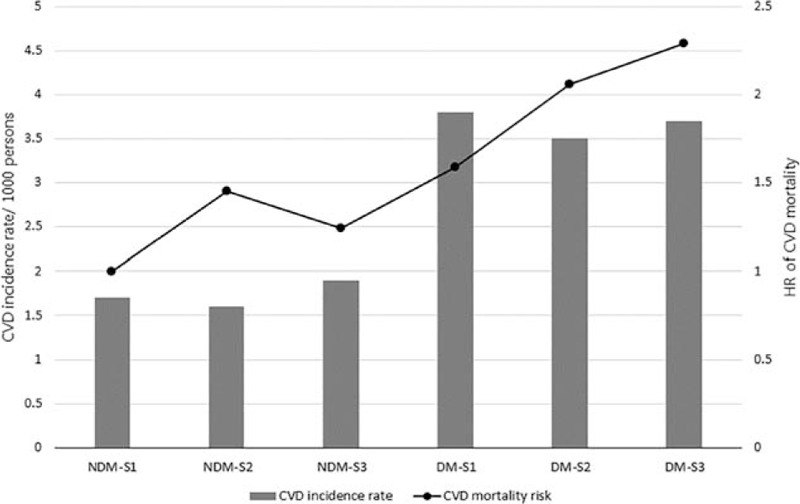
Differences in CVD incidence rates and CVD mortality according to SES and diabetes status.
4. Discussion
In this large, prospective, cohort study, we found that low SES and DM were the major determinants of mortality, and the mortality risk increased significantly when these 2 risk factors were combined. Individuals with DM with a mid to low SES had more than a 2 times greater risk of all-cause and CVD mortality than did those without DM with a high SES after adjusting for major confounders. Although the size of the risk increment was attenuated, there was a similar association for cancer mortality.
In addition, we proved that there were disparities in mortality based on the SES in a developing Asian country. Although many studies have already reported on the SES-related differences in mortality, most were performed in developed or Western countries. Considering that the growing burden of noncommunicable diseases is more rapid[17] and that changes in social structure characterized by rapid and unplanned urbanization have aggravated economic and health inequalities in developing countries in recent decades,[18] information about SES-related health differences in our population is important for global public health strategy. In addition, because the socioeconomic structure of different countries varies according to their economic productivity, medical system, and unique social customs, our study added important evidence about health disparities in patients with DM.
We selected income as an indicator of SES rather than educational level or residential area because of the specific social structure of South Korea, which differs from that of other countries. South Korea has a high educational level, and the population is concentrated in urban areas. Currently, a majority of students (approximately 98%) go to high school, and more than 60% of high school students get a college education.[19] In addition, one-third of the population resides in the 3 major cities.[20] Therefore, SES measured by education level and area was not suitable to classify individuals’ socioeconomic positions.
Although several previous studies have also shown that SES measured by education level, occupation, income, and area was an important contributor to mortality, particularly CVD mortality, they assessed the risk in the general population[9,21] or only in subjects with diabetes.[12,14,15,22,23] Only 1 study assessed the effects of educational disparities on mortality separately in adults with and without diabetes, and that study showed that the effect of SES on mortality was weaker in adults with diabetes than in those without.[13] We had initially questioned whether there would be a difference in mortality between diabetic subjects with a high SES and nondiabetic subjects with a low SES as well as the combined effects of low SES and DM on mortality. As a result, if an individual had diabetes but was in higher socioeconomic class, he or she had higher risk of mortality than did a subject without diabetes who was in a low SES. This finding demonstrated that diabetes was a stronger risk factor for mortality than was a low SES.
Increased CVD mortality with a low SES was well documented in subjects with and without diabetes. Generally, CVD or metabolic diseases closely related to CVD need to be managed with long-term medical care to decrease the mortality risk. Therefore, subjects with a low SES are in an unfavorable situation to manage CVD risk factors due to limited access to medical care and a lack of sufficient time for self-care, including exercise.[6] We also observed low physical activity levels in people with a low SES regardless of diabetes status (Table 1), and a large amount of evidence has indicated that physical activity itself is an independent contributor to traditional CVD risk factors and mortality.[24,25] In addition, access to specialized cardiac services after the onset of coronary artery disease was limited in subjects with a low SES.[26] Our study also showed that individuals with a low SES did not have enough time to exercise compared to those with higher SES, regardless of diabetes status. Moreover, we found that cancer mortality was also affected by SES, DM, and their combined effects. Previous epidemiological studies have shown disparities in the incidence of cancer in individuals based on their diabetes status and SES. Diabetes has been associated with an increased incidence of and mortality from various types of cancer, including colon and pancreatic cancer,[27,28] and hyperglycemia has been associated with a higher risk of incident cancer even in the nondiabetic population.[29] Other studies have observed that there are disparities in the incidence of cancer by race, ethnicity, and SES.[30] Limited opportunities to participate in cancer prevention programs, including general health workups, and the resultant failure in the early detection of cancer explain the higher cancer mortality rate in the low SES group. Therefore, logically, these 2 risk factors could have contributed to the increase in cancer mortality in people with a low SES.
In the subgroups, remarkable disparities in mortality rates based on differences in DM status and SES were found in individuals younger than 60 years of age. Younger subjects in the DM-S3 group had more than a 3 times greater risk of all-cause mortality compared to younger subjects in the NDM-S1 group. Similar results have been reported for patients with diabetes in Canada[22] and in US studies.[13] These findings have consistently suggested the importance of intensive medical and social interventions for patients with diabetes, particularly those with a low SES.
Finally, we found discrepancies in the CVD incidence and mortality rate in subjects with DM in different SESs. The CVD incidence rates were comparable in all 3 SES groups in subjects with DM; however, CVD mortality was inversely associated with a decreasing SES, indicating that CVD mortality was higher in the lower SES group than in the higher SES group. In addition, we observed that metabolic parameters, including serum glucose level and blood pressure, were better controlled in the high SES group with DM than the low SES group. These findings suggested that well-managed CVD risk factors in the high SES group with DM could somewhat explain the lower mortality from CVD.
The overall findings of this study consistently showed health disparities according to SES and indirectly indicate the need for social action to improve health care in people with a low SES. Limited access to the medical care system and limited time for healthy behavior in people with a low SES resulted in poorer metabolic parameters (shown in Supplementary Table 1) and eventually increased the mortality risk of CVD. Considering that population-wide interventions, including tobacco and alcohol taxes, have effectively reduced the burden of common diseases,[17] we need more social interventions to reduce the burden of cardiometabolic diseases on government and society,[31] such as a sugar tax for industry, and to strengthen access to health care, particularly in low- and middle-income populations.[32] However, issues on health disparity are a global problem and are not confined to developing countries or local areas. The current structure of health in terms of the public area is complex and consists of multiple factors, including social inequalities, economy, settings, environments, and medical systems.[32] Therefore, we need national and international health policy programs to improve health and to reduce the gap of health inequalities, such as WHO's “healthy cities” project.[33,34]
This study has several limitations and strengths. We did not obtain some important information, including education levels and marital status, and did not adjust the changes in SES that may have influenced health outcomes. The subjects selected for this study from the original cohort were limited to those who participated in regular health examination programs; therefore, this study likely included subjects who were healthier or more concerned about their health. However, we could correctly determine the SES of the subjects by their income based on their medical insurance premiums. In addition, the identification of DM status was objective and used various measures, including laboratory findings, which differed from other major studies that generally used self-reporting. Above all, this study produced strong evidence of income- and diabetes-related health inequality as it was performed on a large representative longitudinal cohort.
In conclusion, low SES and diabetes, individually and combined, affect individuals’ mortality. Subjects with diabetes and a low SES had a significantly increased risk of mortality from various causes; therefore, effective interventions are needed for such patients.
Acknowledgments
We thank all participants in the Korean Health Insurance Cohort study and the National Health Insurance Service, who developed the NHIS-NSC (2002–2010) database (NHIS-2014-2-006). The views expressed in this article are those of the authors and do not necessarily represent the official position of the Department of Korean National Health Insurance Service.
Supplementary Material
Footnotes
Abbreviations: BMI = body mass index, CVD = cardiovascular disease, HR = hazard ratio, NHIS = National Health Insurance System, SES = socioeconomic status.
Funding: This study was partly supported by a grant of the Korean Health Technology R&D Project (HI14C2750), Ministry of Health & Welfare, Republic of Korea.
Author contributions: SGK directed the study and contributed to the data analysis and interpretation as well as to the revision of the manuscript. NHK contributed to the data analysis and interpretation and wrote the first draft of the manuscript. TJK performed the statistical analyses and prepared the tables. YP supervised the statistical analyses and revised the manuscript. NHK, KMC, SHB, and DSC interpreted the data and critically revised the manuscript.
The authors have no conflicts of interest to disclose.
Supplemental Digital Content is available for this article.
References
- 1.Wild S, Roglic G, Green A, et al. Global prevalence of diabetes: estimates for the year 2000 and projections for 2030. Diabetes Care 2004; 27:1047–1053. [DOI] [PubMed] [Google Scholar]
- 2.Yach D, Stuckler D, Brownell KD. Epidemiologic and economic consequences of the global epidemics of obesity and diabetes. Nat Med 2006; 12:62–66. [DOI] [PubMed] [Google Scholar]
- 3.Viswanathan V, Sathyamurthy S. Global increase in the prevalence of diabetes with special reference to the Middle East and Asia. Diabetes Technol Ther 2015; 17:676–678. [DOI] [PubMed] [Google Scholar]
- 4.Ha KH, Kim DJ. Trends in the diabetes epidemic in Korea. Endocrinol Metab (Seoul, Korea) 2015; 30:142–146. [DOI] [PMC free article] [PubMed] [Google Scholar]
- 5.Panzram G. Mortality and survival in type 2 (non-insulin-dependent) diabetes mellitus. Diabetologia 1987; 30:123–131. [DOI] [PubMed] [Google Scholar]
- 6.Galobardes B, Shaw M, Lawlor DA, et al. Indicators of socioeconomic position (part 1). J Epidemiol Community Health 2006; 60:7–12. [DOI] [PMC free article] [PubMed] [Google Scholar]
- 7.Wilkinson RG, Pickett KE. Income inequality and population health: a review and explanation of the evidence. Soc Sci Med (1982) 2006; 62:1768–1784. [DOI] [PubMed] [Google Scholar]
- 8.Demakakos P, Biddulph JP, Bobak M, et al. Wealth and mortality at older ages: a prospective cohort study. J Epidemiol Community Health 2016; 70:346–353. [DOI] [PMC free article] [PubMed] [Google Scholar]
- 9.Bassuk SS, Berkman LF, Amick BC., III Socioeconomic status and mortality among the elderly: findings from four US communities. Am J Epidemiol 2002; 155:520–533. [DOI] [PubMed] [Google Scholar]
- 10.Dalstra JA, Kunst AE, Borrell C, et al. Socioeconomic differences in the prevalence of common chronic diseases: an overview of eight European countries. Int J Epidemiol 2005; 34:316–326. [DOI] [PubMed] [Google Scholar]
- 11.Koo BK, Kim SW, Yi KH, et al. Low economic status is identified as an emerging risk factor for diabetes mellitus in Korean men aged 30 to 59 years in Korean National Health and Nutrition Examination Survey 2008 to 2010. Diabetes Metab J 2015; 39:137–146. [DOI] [PMC free article] [PubMed] [Google Scholar]
- 12.Chaturvedi N, Jarrett J, Shipley MJ, et al. Socioeconomic gradient in morbidity and mortality in people with diabetes: cohort study findings from the Whitehall Study and the WHO Multinational Study of Vascular Disease in Diabetes. BMJ (Clin Res Ed) 1998; 316:100–105. [DOI] [PMC free article] [PubMed] [Google Scholar]
- 13.Dray-Spira R, Gary-Webb TL, Brancati FL. Educational disparities in mortality among adults with diabetes in the U.S. Diabetes Care 2010; 33:1200–1205. [DOI] [PMC free article] [PubMed] [Google Scholar]
- 14.Walker JJ, Livingstone SJ, Colhoun HM, et al. Effect of socioeconomic status on mortality among people with type 2 diabetes: a study from the Scottish Diabetes Research Network Epidemiology Group. Diabetes Care 2011; 34:1127–1132. [DOI] [PMC free article] [PubMed] [Google Scholar]
- 15.Espelt A, Borrell C, Roskam AJ, et al. Socioeconomic inequalities in diabetes mellitus across Europe at the beginning of the 21st century. Diabetologia 2008; 51:1971–1979. [DOI] [PubMed] [Google Scholar]
- 16.Kim NH, Lee J, Kim TJ, et al. Body mass index and mortality in the general population and in subjects with chronic disease in Korea: a nationwide cohort study (2002–2010). PLoS ONE 2015; 10:e0139924. [DOI] [PMC free article] [PubMed] [Google Scholar]
- 17.WHO. Global Status Report on Noncommunicable Diseases 2010, World Health Organization, Geneva, 2010. [Google Scholar]
- 18.Moore M, Gould P, Keary BS. Global urbanization and impact on health. Int J Hyg Environ Health 2003; 206:269–278. [DOI] [PubMed] [Google Scholar]
- 19.OECD. Education at a Glance 2014, OECD Indicators, Organisation for Economic Co-operation and Development, Paris, 2014. [Google Scholar]
- 20.Ministry of the Interior the Government of Korea, Administrative District and State of Population in Korea. Ministry of the Interior the Government of Korea, Seoul, 2015 [Google Scholar]
- 21.Anderson RT, Sorlie P, Backlund E, et al. Mortality effects of community socioeconomic status. Epidemiology (Cambridge, Mass) 1997; 8:42–47. [DOI] [PubMed] [Google Scholar]
- 22.Lipscombe LL, Austin PC, Manuel DG, et al. Income-related differences in mortality among people with diabetes mellitus. CMAJ 2010; 182:E1–E17. [DOI] [PMC free article] [PubMed] [Google Scholar]
- 23.Saydah SH, Imperatore G, Beckles GL. Socioeconomic status and mortality: contribution of health care access and psychological distress among U.S. adults with diagnosed diabetes. Diabetes Care 2013; 36:49–55. [DOI] [PMC free article] [PubMed] [Google Scholar]
- 24.Arem H, Moore SC, Patel A, et al. Leisure time physical activity and mortality: a detailed pooled analysis of the dose-response relationship. JAMA Intern Med 2015; 175:959–967. [DOI] [PMC free article] [PubMed] [Google Scholar]
- 25.Leischik R, Foshag P, Strauss M, et al. Physical activity, cardiorespiratory fitness and carotid intima thickness: sedentary occupation as risk factor for atherosclerosis and obesity. Eur Rev Med Pharmacol Sci 2015; 19:3157–3168. [PubMed] [Google Scholar]
- 26.Alter DA, Naylor CD, Austin P, et al. Effects of socioeconomic status on access to invasive cardiac procedures and on mortality after acute myocardial infarction. N Engl J Med 1999; 341:1359–1367. [DOI] [PubMed] [Google Scholar]
- 27.Gapstur SM, Gann PH, Lowe W, et al. Abnormal glucose metabolism and pancreatic cancer mortality. JAMA 2000; 283:2552–2558. [DOI] [PubMed] [Google Scholar]
- 28.Coughlin SS, Calle EE, Teras LR, et al. Diabetes mellitus as a predictor of cancer mortality in a large cohort of US adults. Am J Epidemiol 2004; 159:1160–1167. [DOI] [PubMed] [Google Scholar]
- 29.Jee SH, Ohrr H, Sull JW, et al. Fasting serum glucose level and cancer risk in Korean men and women. JAMA 2005; 293:194–202. [DOI] [PubMed] [Google Scholar]
- 30.Ward E, Jemal A, Cokkinides V, et al. Cancer disparities by race/ethnicity and socioeconomic status. CA Cancer J Clin 2004; 54:78–93. [DOI] [PubMed] [Google Scholar]
- 31.Vilhjalmsson R. Public views on the role of government in funding and delivering health services. Scand J Public Health 2016; 44:446–454. [DOI] [PubMed] [Google Scholar]
- 32.Leischik R, Dworrak B, Strauss M, et al. Plasticity of health. Ger J Med 2016; 1:1–17. http://www.gjom.de/en/publizisten/roman-leischik/plasticity-of-health/ [Google Scholar]
- 33.WHO, Ottawa Charter for Health Promotion, World Health Organization, Geneva, 1986 [Google Scholar]
- 34.Hancock T. The evolution, impact and significance of the healthy cities/healthy communities movement. J Public Health Policy 1993; 14:5–18. [PubMed] [Google Scholar]
Associated Data
This section collects any data citations, data availability statements, or supplementary materials included in this article.


