

Supplemental Digital Content is available in the text
Keywords: endophenotype, familial aggregation, minor physical anomalies, neurodevelopmental markers, recurrence risk ratio, schizophrenia
Abstract
Age at onset is the most important feature of schizophrenia that could indicate its origin. Minor physical anomalies (MPAs) characterize potential marker indices of disturbances in early neurodevelopment. However, the association between MPAs and age at onset of schizophrenia is still unclear. We aimed to compare risk assessment and familial aggregation in patients with early-onset schizophrenia (EOS) and adult-onset schizophrenia (AOS) with MPAs and craniofacial measures.
We estimated the risk assessment of MPAs among patients with EOS (n = 68), patients with AOS (n = 183), nonpsychotic relatives (n = 147), and healthy controls (n = 241) using 3 data-mining algorithms. In addition, we assessed the magnitude of familial aggregation of MPAs with respect to the age at onset of schizophrenia.
The performance of EOS was superior to that of AOS, with discrimination accuracies of 89% and 76%, respectively. Combined MPA scores as the risk assessment were significantly higher in all schizophrenia subgroups and the nonpsychotic relatives of EOS patients than in the healthy controls. The recurrence risk ratio for familial aggregation of the MPA scores of EOS families (odds ratio 9.27) was substantially higher than that of AOS families (odds ratio 2.47).
The results highlight that EOS improves risk assessment and has a severe magnitude of familial aggregation of MPAs. These findings indicate that EOS might result from a stronger genetic susceptibility to neurodevelopmental deficits.
1. Introduction
The neurodevelopmental model of schizophrenia posits that the etiological origins of the disease can be traced to events in the prenatal period.[1–5] Neurodevelopmental abnormalities begin as early as the first trimester or early second trimester,[6] and have been suggested to cause a biological vulnerability that likely continues into adolescence and young adulthood.[7,8] In support of this neurodevelopmental model of schizophrenia, higher rates of neurodevelopmental markers such as minor physical anomalies (MPAs) have been suggested as risk factors for schizophrenia and are of potential pathophysiological significance.[9]
Minor physical anomalies are subtle morphological deficits of the head, face, hands, and feet that are usually determined by the presence of qualitative characteristics (such as epicanthus, hypertelorism, adherent earlobes, steepled palate, and single transverse crease).[10] Embryology studies have demonstrated that brain and craniofacial morphogenesis are closely related,[11] supporting an association between schizophrenia and MPAs. Indeed, MPAs have been found in higher frequencies among individuals with schizophrenia than in healthy controls.[12–14] Some studies also found that the patients with schizophrenia had significantly more MPAs than the patients with bipolar disorders.[15,16] The bipolar patients showed higher MPA scores than normal controls.[16,17] In addition, a meta-analysis has implied that the MPA scores in autism patients were significantly higher than those of controls.[18] Brain imaging studies have also reported regional neuroanatomical changes associated with MPAs, suggesting that such physical signs could be markers for aberrant brain development.[19]
Although several case-control studies have suggested a significant association between MPAs and schizophrenia,[12,14] family studies have produced inconsistent results. Some studies found intermediate scores for relatives of patients,[20–22] but a meta-analysis did not find a difference in MPA scores between relatives of patients and healthy controls.[23] These discrepancies may stem from the inherent qualitative nature of most MPAs evaluated. Other studies have used anthropometric measurements as a more objective and quantitative way to characterize craniofacial MPAs in patients with schizophrenia.[24,25] However, most used different modified versions of the Waldrop scale,[10] which is comprised mainly of qualitative MPA items. Thus, few intrinsically quantitative features have been included in most MPA scales.[26,27]
The onset of schizophrenia commonly occurs in the late teens or early adulthood.[28] Most studies define early-onset schizophrenia (EOS) as symptom expression before 20 years of age.[29–31] Age of onset is considered an important clue to the pathogenesis of schizophrenia.[28,32] Earlier onset could reflect a stronger genetic propensity, as EOS patients tend to have a higher familial loading than adult-onset schizophrenia (AOS) patients.[33] Past studies have reported that EOS is associated with a poorer prognosis and resistance to treatment.[28,34] Association between EOS and poor outcomes such as social withdrawal, suicide, symptom severity, and negative cognitive impacts have been reported.[35–37] Early symptoms such as social withdrawal can seriously affect a young patient's academic career and social cognition, leading to negative developmental outcomes in adulthood. Thus, age of onset is a key factor in the prognosis of patients with schizophrenia and seems to be strongly determined by genetic factors that affect prenatal development and enhance susceptibility to subsequent stressors.
Only 1 study has investigated the association between MPAs and onset age,[38] reporting significantly higher MPA scores in EOS patients than AOS patients. However, this was a small-sample study with no assessment of predictive validities and no covariate adjustment. Moreover, no family-based study to our knowledge has assessed the associations of MPAs with EOS and AOS. In this study, it is hypothesized that EOS would have more familial aggregation, possibly due to stronger underlying genetic association. The specific aims are as follows: to estimate the predictive validities of MPAs for EOS and AOS using a combined qualitative and quantitative MPA scale and 3 different models; and to assess the magnitude of familial MPA aggregation in EOS and AOS families.
2. Methods
2.1. Participants
Schizophrenia patients were recruited from 3 medical institutions in southern Taiwan—the Chimei Medical Center, Jianan Mental Hospital, and Lok An Hospital. Data were collected from April 2011 to November 2015. Patients were recruited from inpatient wards and outpatient clinics, and included if they met the criteria for schizophrenia in the Diagnostic and Statistical Manual of Mental Disorders, Fourth Edition (DSM-IV-TR). Members of the hospital staff and community without a history of psychiatric disorders were recruited as the healthy control group. All participants in this study were Taiwanese Han Chinese. Participants included 251 schizophrenia patients, 147 first-degree relatives without psychotic symptoms, and 241 healthy controls. Participants were interviewed by well-trained research assistants using the Chinese version of the Diagnostic Interview for Genetic Studies (DIGS),[39] a structured interview for studies on psychiatric disorders, to confirm the suitability of recruits. In this study, the dataset included the baseline information of participants (i.e., sex, age, weight, height, and body mass index [BMI]) and measurements of minor physical anomalies and craniofacial features. We also recorded age at onset and duration of illness in the patients with schizophrenia. Participants were excluded if they had a history of illegal substance or alcohol abuse, identifiable neurological disorders, mental retardation, or somatic disorders with neurological components, or a parent who was not Han Chinese. Ethics approval was obtained for the recruitment procedures and study designs from the relevant institutional review boards (IRBs) of participating hospitals.
2.2. Age at onset of schizophrenia
Although most studies of EOS state that the symptoms need to be diagnosed before the patient is 20 years old,[29–31] a different cut-off point may influence the results. Thus, we used several cut-off points for the age of onset to identify the best cut-off point for these studies. Past studies have also shown that that the peak ages of onset are 20 to 24 years for males and 25 to 29 years for females.[40] However, a recent meta-analysis study suggested that the sex difference in age of onset is smaller than previously thought.[41] Therefore, we considered the sex effect on age at onset, and analyzed the different cut-off ages by sex.
2.3. Measurements
2.3.1. Assessments of minor physical anomalies and craniofacial features
Minor physical anomalies were assessed by an extensive evaluation of body characteristics upon recruitment. The qualitatively measured MPAs and quantitatively measured craniofacial features compiled from the Waldrop scale and other previous scales were measured as described.[34] The scale for qualitative measurement of MPAs was based on that developed by Ismail et al and included 41 items. The morphological anomalies examined were located in 6 different body regions: head, eyes, ears, mouth, hand, and feet. Thirty-three items determined the presence or absence of anomalies, and the other 8 were scored using an ordinal scale (0, 1, and 2) to express the magnitude of the anomaly. These MPAs were assessed separately on the right and left sides in 28 symmetrical anatomical sites. The items for each region were calculated as subscores, and all subscores were summated to yield the total qualitative MPA score. The quantitative measurements included 27 craniofacial areas, including separate right and left-side measurements of 11 bilateral anatomical sites. The standardized method described in the 2 most cited books on anthropometric measurements was adopted.[42,43]
Two well-trained research assistants conducted all qualitative assessments and craniofacial measurements used for the combined MPA scale. Both research assistants collected data from 20 healthy subjects to ensure a reliable study. The inter-rater reliability for the qualitative items ranged from 0.95 to 1.00, and the intraclass correlation coefficients of quantitative items ranged from 0.70 to 0.99.
2.4. Prediction models
Three different hybrid classification approaches were used: artificial neural networks (ANNs), decision trees (DTs), and logistic regression (LR). ANN is a computational model based on the construction of biological neural networks. ANN has become well-established with strong potential to be effective in any subject, especially medicine.[44] DTs are a tree-like graph or model of decisions and their possible consequences using interpretable rules or logic statements (if-than statements).[45] LR is a prediction model where the dependent variable is categorical.[46] The following is a brief description of these classification models and their specific applications in this research.
2.4.1. Artificial neural networks
Artificial neural network models are based on the structure and function of biological neural networks.[46] Information that flows through the network affects the structure of the ANN (plasticity or learning), thereby altering the input–output relationship. The ANN model includes input, hidden, and output layers. In this study, for the measurement of MPAs, the input layer contained neurons encoding the subtotal scores of qualitatively measured MPAs (head, eyes, ears, mouth, hand, and feet) and quantitatively measured craniofacial features. In the hidden layers, the system was optimized using training and validation data in a trial-and-error process to maximize predictive accuracy.[47] The output layer in each model had only 2 neurons: cases and controls.
2.4.2. Decision trees
Decision trees are a simple but powerful tool for multiple variable analysis. The nodes of a DT model break down a dataset into progressively smaller and smaller subsets, whereas an associated DT is incrementally developed at the same time. The steps of DT learning are to select the most discriminative variable for data partitioning; repeat the partitioning until the nodes are correctly classifying and predicting use as terminal nodes; and prune the completed tree to avoid overfitting.[48] In our model, we used the DT model with Classification and Regression Tree (CART) to distinguish the items in MPAs.
2.4.3. Logistic regression analysis
Logistic regression is the most generalized of the linear regressions.[49] It is used for predicting binary or multiclass dependent variables. Whereas LR is a powerful modeling tool, it assumes that the response variable is linear in the coefficients of the predictor variables. In addition, the investigators need to choose the right inputs and specify their correct functional relationship to the response variable. The formula logit(p) = b0 + b1x1 + b2x2 + … + bkxk was used for calculating the probability of the characteristic of interest in our study, where 1 = patient with schizophrenia and 0 = healthy control. We used the stepwise method for variable selection.
2.5. Statistical analysis
Group comparisons in demographic features were conducted using the chi-square test for sex and mixed-effect models for onset age, age, weight, height, and BMI in the measurements of MPAs. Afterwards, we used 2 data-mining algorithms (ANNs and DTs) and a commonly used statistical method (LR) to develop the prediction models. This study also used 10-fold cross-validation for unbiased estimates of prediction performance. We then compared MPA scores among EOS, AOS, and healthy controls using multiple linear regression, and compared MPA scores among the relative of EOS, the relative of AOS, and healthy controls using mixed-effect models, and adjustments for sex, age, and BMI.
We further assessed familial aggregation of MPA scores in EOS and AOS families using the relative recurrence-to-risk ratio. For recurrence-to-risk ratio analyses, affection status was operationally defined as having MPA deficits, with the MPA score below a prespecified cut-off value. The λ coefficient was calculated as the ratio of the recurrence risk among relatives compared with the prevalence of the general population as follows[50,51]:
 |
The previous studies usually used average value of the total qualitative or quantitative MPA scores to compare the differences among the study groups.[24,38] The present study is the first study to investigate the familial aggregation and age at onset in schizophrenia. Therefore, we attempt to use different cut-off points of MPAs to estimate the recurrence risk ratio for age at onset in schizophrenia. We constructed the ANN, DT, and LR models using SAS Enterprise Miner version 12.1. Other statistical analyses were performed using SAS statistical software, version 9.3 (SAS Institute, Cary, NC).
3. Results
3.1. Group characteristics
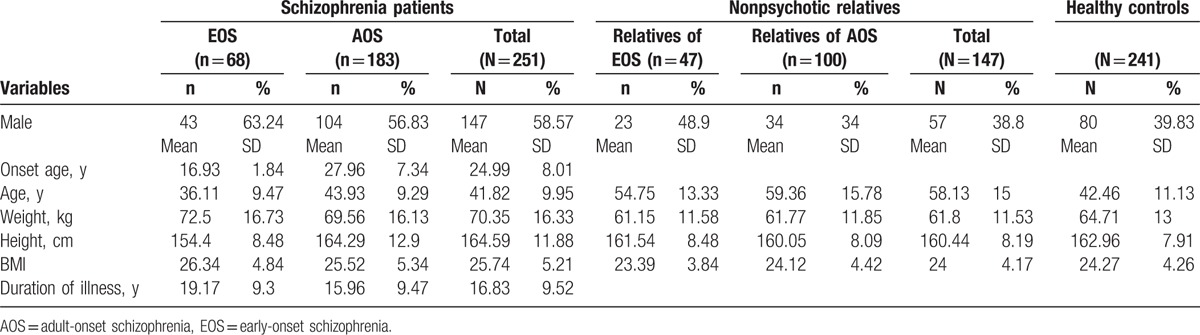
This study included schizophrenia patients divided into 2 subgroups by onset age: EOS patients with onset of symptoms before the age of 20 years and AOS patients with onset after the age of 20 years. The mean age of onset for EOS and AOS patients was well-separated (16.93 and 27.96 years, respectively). The nonpsychotic first-degree relatives of schizophrenia patients were divided into relatives of EOS patients and those of AOS patients. Mean weight and BMI were higher in patients compared with nonpsychotic relatives and healthy controls (Table 1). There were also a greater number of males among schizophrenia patients than nonpsychotic relatives and healthy controls.
Table 1.
Characteristics of schizophrenia patients, nonpsychotic relatives, and healthy controls.
3.2. Prediction models of early-onset schizophrenia and adult-onset schizophrenia using MPAs
We used 2 data-mining algorithms (ANNs and DTs) and a commonly used statistical method (LR) to develop the prediction models. All variables (qualitatively and quantitatively measured MPAs) were used to construct the initial models. To predict EOS, 3 qualitative MPA regional scores (eyes, mouth, and hands) and 3 quantitatively measured craniofacial features (interpupilary distance, mouth width, and palate width) were selected for construction of all 3 models (Table 2). To predict AOS, 2 qualitative MPA regional scores (eyes and mouth) and 2 quantitatively measured craniofacial features (mouth and palate width) were selected for construction of all 3 models. Other variables were used for only some models in specific subgroups. The variables for MPA regions were not found to be significantly different between EOS and AOS.
Table 2.
Minor physical anomalies (MPAs, input variables) used in data mining model construction to distinguish among early-onset schizophrenia patients, adult-onset schizophrenia patients, and healthy controls.
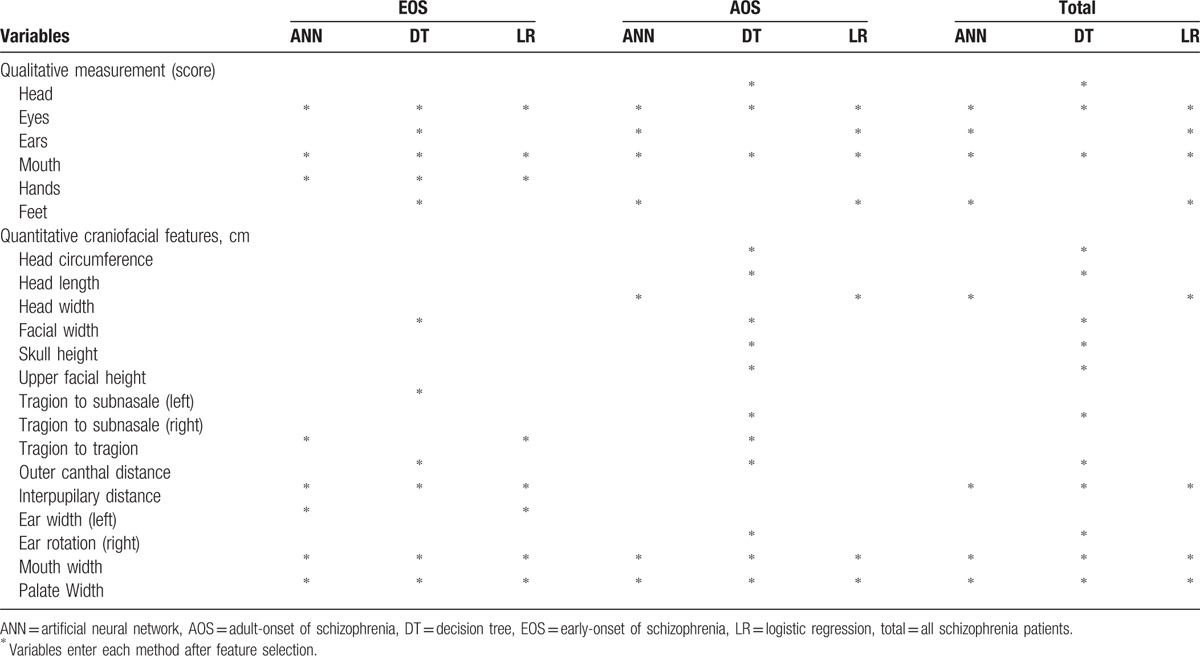
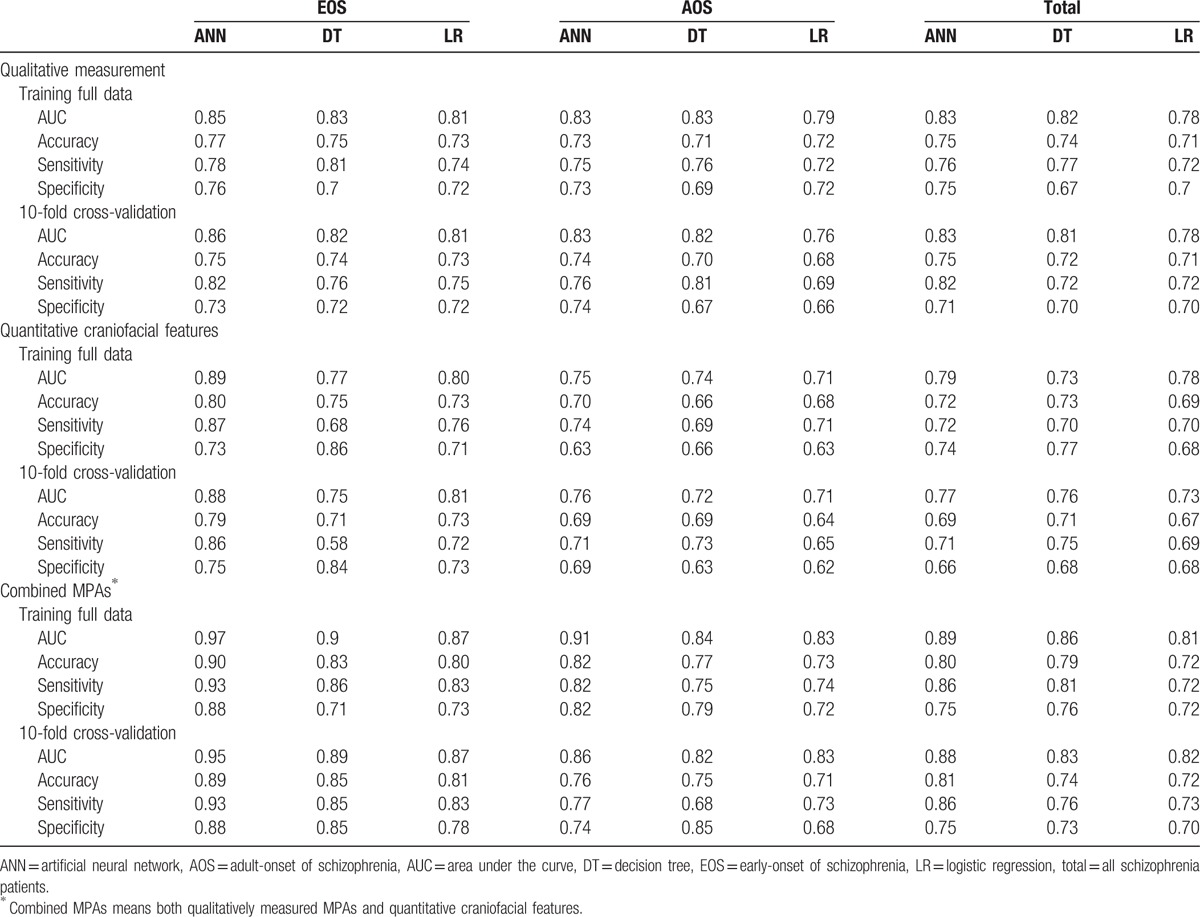
Table 3 shows the performance metrics area under the curve (AUC), accuracy, sensitivity, and specificity of each model constructed using qualitative measurement only, quantitative craniofacial features only, and combined MPAs (qualitative and quantitative MPAs) for EOS patients, AOS patients, and all patients. Past research has shown that the 10-fold cross-validation method yields an unbiased estimate of prediction model performance.[52] Therefore, each model was built and then validated with full data and 10-fold cross-validation. The range of accuracy of combined MPAs using 10-fold cross-validation was from 0.81 to 0.89 for predicting EOS, and 0.71 to 0.76 for predicting AOS. It is worth noting that the EOS group had higher AUC and accuracy values than the AOS group for all 3 MPA measurement scales (i.e., qualitative, quantitative, and combined).
Table 3.
Performance comparison of MPA-based ANN, DT, and LR models for training full data and 10-fold cross-validation results.
3.3. Comparison of MPA scores for early-onset schizophrenia, adult-onset schizophrenia, and nonpsychotic relatives versus healthy controls
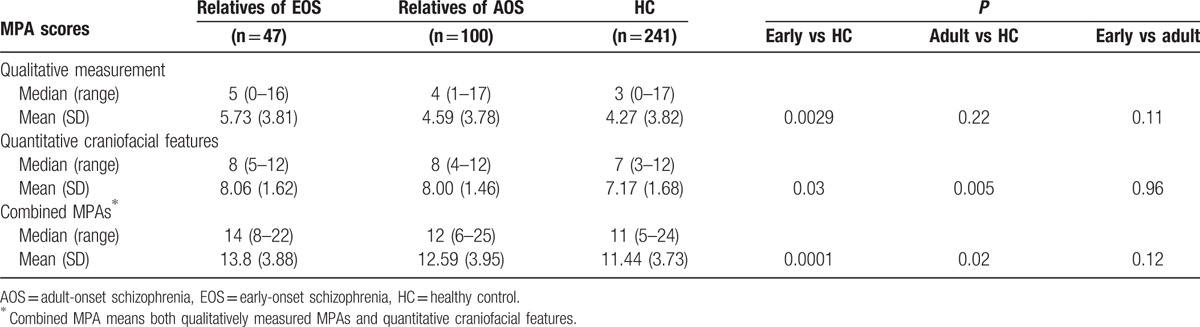
Qualitative and quantitative scores, and combined MPA scores were significantly higher in the EOS group than in the control group (all P < 0.001). Similarly, qualitative and quantitative scores, and combined MPA scores were significantly higher in the AOS group than in the control group (all P < 0.01), whereas there were no differences between EOS and AOS groups (Table 4). Qualitative, quantitative, and combined MPA scores were also higher in the nonpsychotic relatives of EOS patients than controls (all P < 0.05) (Table 5). Qualitative MPA scores did not differ significantly between nonpsychotic relatives of AOS patients and healthy controls. The difference in combined MPA scores between nonpsychotic relatives of EOS patients and controls showed a higher level of significance than that between nonpsychotic relatives of AOS patients and healthy controls (P = 0.0001 vs P = 0.02).
Table 4.
Comparison of MPA scores for patients with early-onset and adult-onset schizophrenia versus healthy controls.
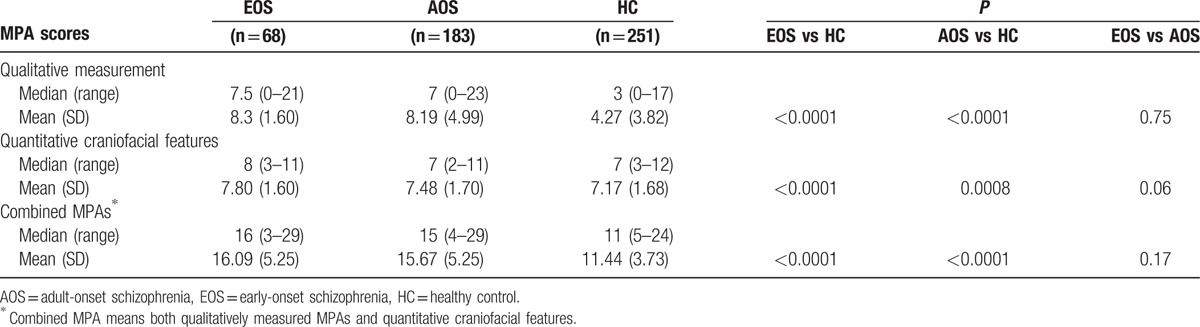
Table 5.
Comparison of MPA scores for nonpsychotic relatives of early-onset and adult-onset schizophrenia versus healthy controls.
3.4. Familial aggregation of MPAs in early-onset schizophrenia and adult-onset schizophrenia families using recurrence risk ratios
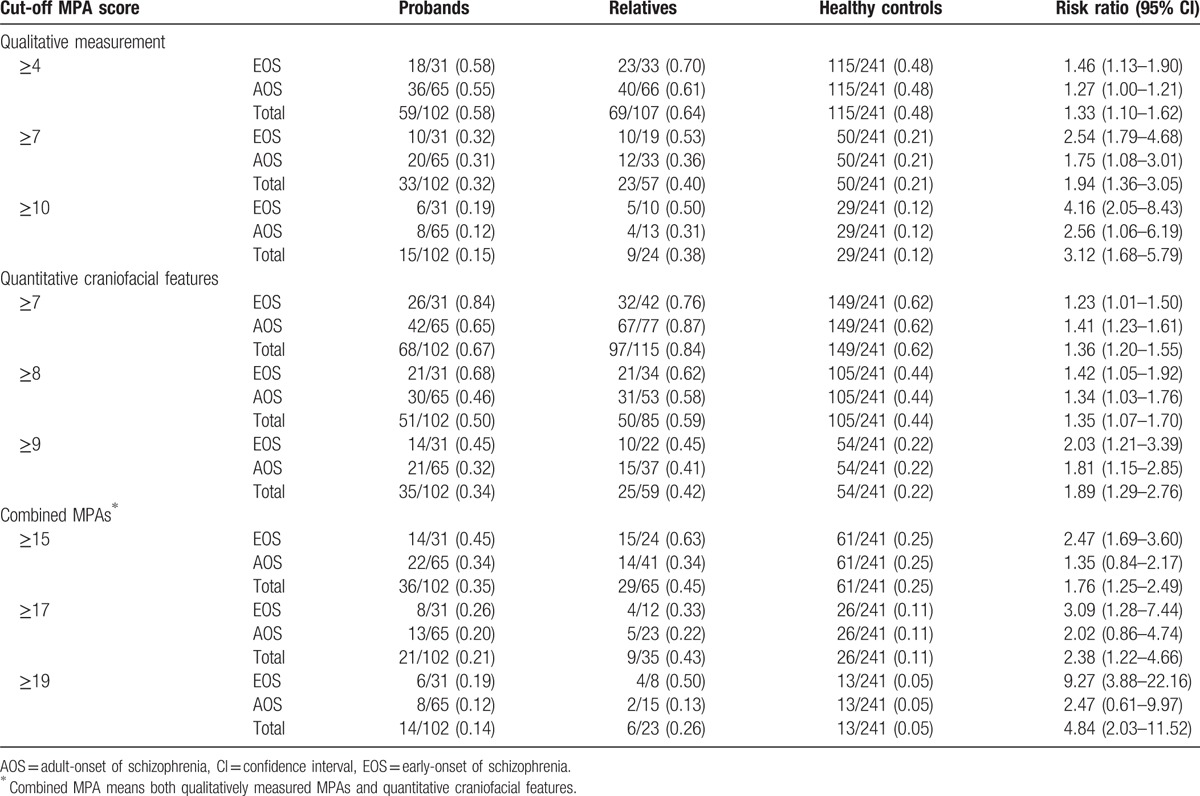
The recurrence risk ratios of MPA scores for nonpsychotic relatives of EOS patients and AOS patients were estimated using a series of qualitative, quantitative, and combined MPA cut-off scores. Each participant's MPA scores were categorized as MPA(+) or MPA(−) according to the chosen cut-off and the proportions above or below the specified cut-off points calculated for probands, nonpsychotic relatives, and healthy controls (Table 6). For qualitative MPAs, the recurrence risk ratios for nonpsychotic relatives of EOS patients were greater than for nonpsychotic relatives of AOS patients. For example, for a cut-off ≥10, risk ratios were 4.16 (95% confidence interval [CI] 2.05–8.43) for EOS and 2.56 (95% CI 1.06–6.19) for AOS families. For quantitative craniofacial features, the only nonsignificant differences were detected for a cut-off ≥7. This may be due to the high number of participants classified as MPA(+) when the cut-off point was ≥7. At this cut-off point, 62% of healthy controls were MPA(+); therefore, this low cut-off does not have enough power to distinguish EOS and AOS families from healthy controls. For combined MPAs, there was a larger distinction between EOS and AOS families. For a cut-off point of ≥20, risk ratios were 14.76 (95% CI 4.79–45.43) for EOS families and 5.30 (95% CI 1.22–23.02) for AOS families. These findings demonstrate a familial aggregation of MPAs in first-degree relatives of schizophrenic patients, especially in families of EOS patients. We observed that EOS families have higher familiar aggregation than AOS ones in most MPA cut-off points. Moreover, the difference between EOS and AOS families is revealed most clearly using combined MPA scoring.
Table 6.
Proportion of subjects with MPA scores above a threshold cut-off (MPA[+]) and the corresponding recurrence risk ratio.
4. Discussion
To the best of our knowledge, this is the first study to compare familial aggregation of MPAs between families of EOS and AOS patients. In addition, this is the first study to assess the predictive ability of MPAs for distinguishing among EOS patients, AOS patients, and healthy controls. To these ends, we used 3 prediction models and 10-fold cross-validation for performance evaluation. The ANN model proved superior to DT and LR models, and in general provided better discrimination of EOS than AOS patients from healthy controls. There is clear familial aggregation of MPAs in both EOS and AOS families, but aggregation was stronger in EOS families. These findings have important implications for disease etiology, suggesting a major role for embryonic neurodevelopmental disruptions, which may be stronger in EOS due to higher genetic susceptibility and/or shared environmental factors.
Early-onset schizophrenia patients express more severe premorbid neurodevelopmental abnormalities[53] and poorer psychosocial outcomes than AOS patients.[54] EOS also tends to be more treatment-resistant,[34] and may reflect a more severe form of the disorder associated with a greater genetic predisposition than AOS.[55] In the current study, all MPA-based models showed greater predictive validity for EOS than AOS, and familial aggregation was higher in first-degree relatives of EOS patients, supporting a neurodevelopmental model where childhood/adolescent-onset schizophrenia may represent a more malignant disorder caused by more severe in utero neurodevelopmental disruption (as reflected by MPAs) due to greater genetic susceptibility.
Minor physical anomalies may be an indirect index for early prenatal central nervous system (CNS) dysplasia.[14] In our study, the difference in combined MPA scores between nonpsychotic relatives of AOS patients and healthy controls was smaller than that between nonpsychotic relatives of EOS patients and healthy controls. This suggests that EOS patients have stronger genetic risk for CNS maldevelopment and possibly greater genetic susceptibility to stressors (prenatal and/or postnatal) than AOS patients. This finding may explain the inconsistent results of past studies of MPAs in nonpsychotic relatives. Some studies reported higher overall MPA scores for patients than for controls,[14] and intermediate scores for relatives,[25,56] whereas others found no difference between relatives and healthy controls.[23] However, the studies did not distinguish EOS from AOS, and we show a clear difference in MPAs between families of EOS and AOS patients. This assumption needs more evidence to prove.
Early-onset cases could provide a unique opportunity to understand the pathophysiology of schizophrenia. EOS also involves a more severe early disruption of brain development than AOS due to greater environmental or genetic liability.[55] Recent longitudinal brain imaging studies have demonstrated that EOS patients exhibit more exaggerated developmental brain changes than healthy age-matched controls.[57] Our study indicated an extended period of abnormal neurodevelopment in schizophrenia in addition to an earlier biological vulnerability.[7] The comprehensive assessment of the familial aggregation of MPAs found significant aggregation of MPAs in both EOS and AOS families. The trends depended heavily on the cut-off scores chosen, but were generally stronger in EOS families. Past studies reporting that some schizophrenia-susceptibility genes and chromosomal abnormalities are associated with EOS and severe premorbid neurodevelopmental abnormalities are also consistent with this neurodevelopmental hypothesis.[58] Normally, both environmental and genetic components contribute to familial aggregation. However, familial aggregation does not show the extent of the effect caused by genetic or environmental factors.[59] Furthermore, MPAs are markers of ectoderm maldevelopment during embryo gestation. Past research has also shown that MPAs may be influenced by genetic factors and represents a risk marker for schizophrenia, resulting from a prenatal risk event.[60] Therefore, the familial aggregation of MPAs in schizophrenia might be contributed by genetic factors.
A methodology review article showed that ANN has better discriminatory power and generally outperforming than LR in most studies,[61] and another study also found that ANN had good performance than DT.[62] Our study observed the similar results that ANN has higher accuracy than LR and DT in most results. Moreover, most studies defined EOS as symptom onset before the age of 20.[29–31] We tested several cut-off ages of onset. A cut-off age of 20 years yielded the highest AUC and adequate sample size (Supplementary Table S1). We further considered the sex effect in age of onset, and found that a cut-off of 20 years yielded the highest AUC regardless of patient sex with adequate sample size (Supplementary Tables S2 and S3). Therefore, we followed past studies and classified EOS as onset before age 20 years and AOS as onset after age 20 years.
This study has several limitations. First, although MPAs and craniofacial features are indicators of disrupted embryonic development unaltered by the subsequent illness,[58] they may not necessary reflect neurodevelopmental disturbances. Second, some of the young relatives may imply that they had not passed through the age of risk for schizophrenia, and this might lead to misclassification. Third, some participants past the onset age of schizophrenia may have recall bias when the interviews were conducted.
In conclusion, these findings suggest the selected MPAs could distinguish EOS and AOS patients from healthy individuals, with higher accuracy for EOS patients. Furthermore, this study demonstrated a greater MPA aggregation in EOS relatives than AOS relatives. Although familial aggregation does not necessarily equal genetic contribution, the results imply that the shared genetic association between schizophrenia patients and their relatives is a potential trait marker that may be useful for further research into the genetics and pathophysiology of schizophrenia, especially for EOS. Findings that EOS patients exhibit more severe MPAs, which presumably form during fetal development as a result of prenatal insults, abnormal brain structure, and functional and genetic factors, provide evidence for the neurodevelopmental model of schizophrenia. It is increasingly evident that schizophrenia is best understood as a disorder (or cluster of disorders) of brain development that disrupts specific domains of cognition, emotion, and behavior.[63] The National Institute of Mental Health's Research Domain Criteria project attempts to create a new kind of taxonomy for mental disorders by incorporating genetics, imaging, cognitive science, and other levels of information.[64] MPAs may be useful biomarkers for predicting schizophrenia onset or prognosis. Moreover, MPAs may reflect specific genetic vulnerabilities or genetic × environment interactions involved in schizophrenia.
Supplementary Material
Acknowledgments
We would like to thank all individuals who participated in this study. The authors would like to thank Dr Jung-Chin Chiang and Dr Fang-Rong Chang for their assistance in this study. We also wish to thank all members of the laboratory.
Footnotes
Abbreviations: ANNs = artificial neural networks, AOS = adult-onset schizophrenia, AUC = area under the curve, BMI = body mass index, CNS = central nervous system, DSM-IV-TR = Diagnostic and Statistical Manual of Mental Disorders, DT = decision trees, EOS = early-onset schizophrenia, fourth edition, IRB = institutional review boards, LR = logistic regression, MPAs = minor physical anomalies, OR = odds ratio.
Funding: This work was supported by the National Science Council, Taiwan, R.O.C.; National Science Council of Taiwan (NSC 100–2314-B-006–049, NSC 101–2314-B-006–066, NSC 102–2314-B-006–006); and the Ministry of Science and Technology of Taiwan (MOST 103–2314-B-006–084).
The authors have no conflicts of interest to disclose.
Supplemental digital content is available for this article.
References
- 1.Weinberger DR. Implications of normal brain development for the pathogenesis of schizophrenia. Arch Gen Psychiatry 1987; 44:660–669. [DOI] [PubMed] [Google Scholar]
- 2.Murray RM, O’callaghan E, Castle DJ, et al. A neurodevelopmental approach to the classification of schizophrenia. Schizophr Bull 1992; 18:319–332. [DOI] [PubMed] [Google Scholar]
- 3.McGrath JJ, Féron FP, Burne TH, et al. The neurodevelopmental hypothesis of schizophrenia: a review of recent developments. Ann Med 2003; 35:86–93. [DOI] [PubMed] [Google Scholar]
- 4.Fatemi SH, Folsom TD. The neurodevelopmental hypothesis of schizophrenia. Revisited Schizophr Bull 2009; 35:528–548. [DOI] [PMC free article] [PubMed] [Google Scholar]
- 5.Rapoport JL, Giedd JN, Gogtay N. Neurodevelopmental model of schizophrenia: update 2012. Mol Psychiatry 2012; 17:1228–1238. [DOI] [PMC free article] [PubMed] [Google Scholar]
- 6.Tarrant CJ, Jones PB. Precursors to schizophrenia: do biological markers have specificity? Can J Psychiatry 1999; 44:335–349. [DOI] [PubMed] [Google Scholar]
- 7.Cornblatt BA, Lencz T, Smith CW, et al. The schizophrenia prodrome revisited: a neurodevelopmental perspective. Schizophr Bull 2003; 29:633–651. [DOI] [PubMed] [Google Scholar]
- 8.Jaaro-Peled H, Hayashi-Takagi A, Seshadri S, et al. Neurodevelopmental mechanisms of schizophrenia: understanding disturbed postnatal brain maturation through neuregulin-1–ErbB4 and DISC1. Trends Neurosci 2009; 32:485–495. [DOI] [PMC free article] [PubMed] [Google Scholar]
- 9.Lawrie SM, Olabi B, Hall J, et al. Do we have any solid evidence of clinical utility about the pathophysiology of schizophrenia? World Psychiatry 2011; 10:19–31. [DOI] [PMC free article] [PubMed] [Google Scholar]
- 10.Ismail B, Cantor-Graae E, McNeil TF. Minor physical anomalies in schizophrenic patients and their siblings. Am J Psychiatry 1998; 155:1695–1702. [DOI] [PubMed] [Google Scholar]
- 11.Slavkin HC. Molecular biology experimental strategies for craniofacial-oral-dental dysmorphology. Connect Tissue Res 1995; 32:233–239. [DOI] [PubMed] [Google Scholar]
- 12.Franco JG, Valero J, Labad A. Minor physical anomalies and schizophrenia: literature review. Actas Esp Psiquiatr 2010; 38:365–371. [PubMed] [Google Scholar]
- 13.Weinberg SM, Jenkins EA, Marazita ML, et al. Minor physical anomalies in schizophrenia: a meta-analysis. Schizophr Res 2007; 89:72–85. [DOI] [PMC free article] [PubMed] [Google Scholar]
- 14.Lin Y, Ma X, Deng W, et al. Minor physical anomalies in patients with schizophrenia in a Chinese population. Psychiatry Res 2012; 200:223–227. [DOI] [PubMed] [Google Scholar]
- 15.Green MF, Satz P, Christenson C. Minor physical anomalies in schizophrenia patients, bipolar patients, and their siblings. Schizophr Bull 1994; 20:433–440. [DOI] [PubMed] [Google Scholar]
- 16.Akabaliev VH, Sivkov ST, Mantarkov MY. Minor physical anomalies in schizophrenia and bipolar I disorder and the neurodevelopmental continuum of psychosis. Bipolar Disord 2014; 16:633–641. [DOI] [PubMed] [Google Scholar]
- 17.Akabaliev V, Sivkov S, Mantarkov M, et al. Minor physical anomalies in patients with bipolar I disorder and normal controls. J Affect Disord 2011; 135:193–200. [DOI] [PubMed] [Google Scholar]
- 18.Ozgen HM, Hop JW, Hox JJ, et al. Minor physical anomalies in autism: a meta-analysis. Mol Psychiatry 2010; 15:300–307. [DOI] [PubMed] [Google Scholar]
- 19.Dean K, Fearon P, Morgan K, et al. Grey matter correlates of minor physical anomalies in the AeSOP first-episode psychosis study. Br J Psychiatry 2006; 189:221–228. [DOI] [PubMed] [Google Scholar]
- 20.Ismail B, Cantor-Graae E, McNeil TF. Minor physical anomalies in schizophrenia: cognitive, neurological and other clinical correlates. J Psychiatr Res 2000; 34:45–56. [DOI] [PubMed] [Google Scholar]
- 21.Aksoy-Poyraz C, Poyraz BÇ, Turan Ş, et al. Minor physical anomalies and neurological soft signs in patients with schizophrenia and their siblings. Psychiatry Res 2011; 190:85–90. [DOI] [PubMed] [Google Scholar]
- 22.Gassab L, Aissi M, Slama H, et al. Prevalence and score of minor physical anomalies in patients with schizophrenia and their first degree relatives: a Tunisian study. Compr Psychiatry 2013; 54:575–580. [DOI] [PubMed] [Google Scholar]
- 23.Xu T, Chan RCK, Compton MT. Minor physical anomalies in patients with schizophrenia, unaffected first-degree relatives, and healthy controls: a meta-analysis. PLoS One 2011; 6:e24129. [DOI] [PMC free article] [PubMed] [Google Scholar]
- 24.McGath J, El-Saadi O, Grim V, et al. Minor physical anomalies and quantitative measures of the head and face in patients with psychosis. Arch Gen Psychiatry 2002; 59:458–464. [DOI] [PubMed] [Google Scholar]
- 25.Lloyd T, Dazzan P, Dean K, et al. Minor physical anomalies in patients with first-episode psychosis: their frequency and diagnostic specificity. Psychol Med 2008; 38:71–77. [DOI] [PubMed] [Google Scholar]
- 26.Akabaliev V, Sivkov S, Mantarkov M, et al. Biomarker profile of minor physical anomalies in schizophrenia patients. Folia Medica 2011; 53:45–51. [DOI] [PubMed] [Google Scholar]
- 27.Tikka SK, Nizamie SH, Das B, et al. Increased spontaneous gamma power and synchrony in schizophrenia patients having higher minor physical anomalies. Psychiatry Res 2013; 207:164–172. [DOI] [PubMed] [Google Scholar]
- 28.DeLisi LE. The significance of age of onset for schizophrenia. Schizophr Bull 1992; 18:209–215. [DOI] [PubMed] [Google Scholar]
- 29.Frazier JA, Giuliano AJ, Johnson JL, et al. Neurocognitive outcomes in the treatment of early-onset schizophrenia spectrum disorders study. J Am Acad Child Adolesc Psychiatry 2012; 51:496–505. [DOI] [PMC free article] [PubMed] [Google Scholar]
- 30.Holmén A, Juuhl-Langseth M, Thormodsen R, et al. Neuropsychological profile in early-onset schizophrenia-spectrum disorders: measured with the MATRICS battery. Schizophr Bull 2010; 36:852–859. [DOI] [PMC free article] [PubMed] [Google Scholar]
- 31.Sikich L, Frazier JA, McClellan J, et al. Double-blind comparison of first- and second-generation antipsychotics in early-onset schizophrenia and schizo-affective disorder: findings from the Treatment of Early-Onset Schizophrenia Spectrum Disorders (TEOSS) Study. Am J Psychiatry 2008; 165:1420–1431. [DOI] [PubMed] [Google Scholar]
- 32.Aleman A, Kahn RS, Selten JP. Sex differences in the risk of schizophrenia: evidence from meta-analysis. Arch Gen Psychiatry 2003; 60:565–571. [DOI] [PubMed] [Google Scholar]
- 33.Suvisaari JM, Haukka J, Tanskanen A, et al. Age at onset and outcome in schizophrenia are related to the degree of familial loading. Br J Psychiatry 1998; 173:494–500. [DOI] [PubMed] [Google Scholar]
- 34.Lin AS, Chang SS, Lin SH, et al. Minor physical anomalies and craniofacial measures in patients with treatment-resistant schizophrenia. Psychol Med 2015; 45:1839–1850. [DOI] [PubMed] [Google Scholar]
- 35.Howard R, Castle D, Wessely S, et al. A comparative study of 470 cases of early-onset and late-onset schizophrenia. Br J Psychiatry 1993; 163:352–357. [DOI] [PubMed] [Google Scholar]
- 36.Rabinowitz J, Levine SZ, Häfner H. A population based elaboration of the role of age of onset on the course of schizophrenia. Schizophr Res 2006; 88:96–101. [DOI] [PubMed] [Google Scholar]
- 37.Sato T, Bottlender R, Schröter A, et al. Psychopathology of early-onset versus late-onset schizophrenia revisited: an observation of 473 neuroleptic-naive patients before and after first-admission treatments. Schizophr Res 2004; 67:175–183. [DOI] [PubMed] [Google Scholar]
- 38.Hata K, Iida J, Iwasaka H, et al. Minor physical anomalies in childhood and adolescent onset schizophrenia. Psychiatry Clin Neurosci 2003; 57:17–21. [DOI] [PubMed] [Google Scholar]
- 39.Chen WJ, Liu SK, Chang CJ, et al. Sustained attention deficit and schizotypal personality features in nonpsychotic relatives of schizophrenic patients. Am J Psychiatry 1998; 155:1214–1220. [DOI] [PubMed] [Google Scholar]
- 40.Lieberman JA, Stroup TS, Perkins DO. The American Psychiatric Publishing Textbook of Schizophrenia. Washington DC: American Psychiatric Pub; 2007. [Google Scholar]
- 41.Eranti SV, MacCabe JH, Bundy H, et al. Gender difference in age at onset of schizophrenia: a meta-analysis. Psychol Med 2013; 43:155–167. [DOI] [PubMed] [Google Scholar]
- 42.Hall JG, Froster-Iskenius UG, Allanson JE. Handbook of Normal Physical Measurements. Oxford: Oxford University Press; 1989. [Google Scholar]
- 43.Farkas LG. Anthropometry of the Head and Face in Medicine. New York: Elsevier Science; 1981. [Google Scholar]
- 44.Moein S. Medical Diagnosis Using Artificial Neural Networks. Hershey PA: IGI Global; 2014. [Google Scholar]
- 45.Myles AJ, Feudale RN, Liu Y, et al. An introduction to decision tree modeling. J Chemom 2004; 18:275–285. [Google Scholar]
- 46.Liang TP, Moskowitz H, Yih Y. Integrating neural networks and semi-Markov processes for automated knowledge acquisition: an application to real-time scheduling. Decision Sci 1992; 23:1297–1314. [Google Scholar]
- 47.Robinson CJ, Swift S, Johnson DD, et al. Prediction of pelvic organ prolapse using an artificial neural network. Am J Obstet Gynecol 2008; 199:193e1–193e6. [DOI] [PubMed] [Google Scholar]
- 48.Colombet I, Ruelland A, Chatellier G, et al. Models to predict cardiovascular risk: comparison of CART, multilayer perceptron and logistic regression. Proc AMIA Symp 2000. 156–160. [PMC free article] [PubMed] [Google Scholar]
- 49.Cucchetti A, Piscaglia F, Grigioni AD, et al. Preoperative prediction of hepatocellular carcinoma tumour grade and micro-vascular invasion by means of artificial neural network: a pilot study. J Hepatol 2010; 52:880–888. [DOI] [PubMed] [Google Scholar]
- 50.Risch N. Linkage strategies for genetically complex traits. I. Multilocus models. Am J Hum Genet 1990; 46:222–228. [PMC free article] [PubMed] [Google Scholar]
- 51.Lin SH, Liu CM, Chang SS, et al. Familial aggregation in skin flush response to niacin patch among schizophrenic patients and their nonpsychotic relatives. Schizophr Bull 2006; 33:174–182. [DOI] [PMC free article] [PubMed] [Google Scholar]
- 52.Kohav R. A study of cross-validation and bootstrap for accuracy estimation and model selection. Ijcai 1995; 14:1137–1145. [Google Scholar]
- 53.Fish B. Neurobiologic antecedents of schizophrenia in children: evidence for an inherited, congenital neurointegrative defect. Arch Gen Psychiatry 1977; 34:1297–1313. [DOI] [PubMed] [Google Scholar]
- 54.Lay B, Blanz B, Hartmann M, et al. The psychosocial outcome of adolescent-onset schizophrenia: a 12-year follow-up. Schizophr Bull 2000; 26:801–816. [DOI] [PubMed] [Google Scholar]
- 55.Nicolson R. Lessons from childhood-onset schizophrenia. Brain Res Brain Res Rev 2000; 31:147–156. [DOI] [PubMed] [Google Scholar]
- 56.Gourion D, Goldberger C, Olie JP, et al. Neurological and morphological anomalies and the genetic liability to schizophrenia: a composite phenotype. Schizophr Res 2004; 67:23–31. [DOI] [PubMed] [Google Scholar]
- 57.Thompson PM, Vidal C, Giedd JN. Mapping adolescent brain change reveals dynamic wave of accelerated gray matter loss in very early-onset schizophrenia. Proc Natl Acad Sci USA 2001; 98:11650–11655. [DOI] [PMC free article] [PubMed] [Google Scholar]
- 58.Addington AM, Gornick M, Sporn AL, et al. Polymorphisms in the 13q33.2 gene G72/G30 are associated with childhood-onset schizophrenia and psychosis not otherwise specified. Biol Psychiatry 2004; 55:976–980. [DOI] [PubMed] [Google Scholar]
- 59.Guo SW. Sibling recurrence risk ratio as a measure of genetic effect: caveat emptor!. Am J Hum Genet 2002; 70:818–819. [DOI] [PMC free article] [PubMed] [Google Scholar]
- 60.Compton MT, Walker EF. Physical manifestations of neurodevelopmental disruption: are minor physical anomalies part of the syndrome of schizophrenia? Schizophr Bull 2009; 35:425–436. [DOI] [PMC free article] [PubMed] [Google Scholar]
- 61.Dreiseitl S, Ohno-Machado L. Logistic regression and artificial neural network classification models: a methodology review. J Biomed Inform 2002; 35:352–359. [DOI] [PubMed] [Google Scholar]
- 62.Ho WH, Lee KT, Chen HY, et al. Disease-free survival after hepatic resection in hepatocellular carcinoma patients: a prediction approach using artificial neural network. PLoS One 2012; 7:e29179. [DOI] [PMC free article] [PubMed] [Google Scholar]
- 63.Keshavan MS, Vinogradov S, Rumsey J, et al. Cognitive training in mental disorders: update and future directions. Am J Psychiatry 2014; 171:510–522. [DOI] [PMC free article] [PubMed] [Google Scholar]
- 64.Lilienfeld SO. The Research Domain Criteria (RDoC): an analysis of methodological and conceptual challenges. Behav Res Ther 2014; 62:129–139. [DOI] [PubMed] [Google Scholar]
Associated Data
This section collects any data citations, data availability statements, or supplementary materials included in this article.