Supplemental Digital Content is available in the text
Keywords: cervical myelopathy, intramedullary, magnetic resonance imaging, prognosis, signal intensity
Abstract
Patients with intramedullary signal intensity (SI) changes have a poor prognosis after surgical decompression in cervical compressive myelopathy (CCM); however, some patients show no clear relationship between the SI and postsurgical prognosis. This discrepancy may be because no comprehensive and proper quantitative evaluation exists to assess SI on magnetic resonance imaging (MRI). The purpose of this study was prospectively to evaluate the correlation between the clinical features, neurological outcome of patients with CCM, and the quantitative assessment of SI changes preoperatively and postoperatively, and the correlation with SI severity.
A total of 112 patients with CCM at 1 or 2 levels underwent anterior cervical discectomy and fusion. We quantitatively analyzed MR signal changes on T1-weighted MR images (T1WI), gadolinium-diethylenetriaminepentaacetic acid (Gd-DTPA) contrast-enhanced T1WI, and T2-weighted MR images (T2WI) using the signal intensity ratio (SIR). We evaluated the correlations between various variables and neurological outcome using the Japanese Orthopedic Association (JOA) scale, and the severity of SI change by grade (i.e., grade 0 [“none”], grade 1 [“light”], and grade 2 [“bright on T2WI”]).
Significant differences between the 3 grades existed in symptom duration, preoperative JOA score, SIR on T2WI, and JOA recovery ratio. The JOA recovery ratio was negatively correlated with symptom duration and the SIR on T2WI, and positively correlated with the preoperative JOA score and cord compression ratio, but not with the SIR on T1WI and contrast-enhanced T1WI. On the postoperative 12-month follow-up MRI, the JOA recovery ratio and SIR on T2WI of the SI reversal patients were better than those of the nonreversal patients. On multiple regression analysis, the SIR on T2WI was the main significant prognostic factor of surgical outcome.
The grading system on T2WI provided reliable predictive information for neurological outcome. Quantitative alterations in the SI on preoperative and postoperative T2WI, but not T1WI or contrast-enhanced T1WI, reflected the clinical features, surgical outcomes, and the correlation with SI severity. The patients with a longer duration of symptoms, lower cord compression ratio, severe myelopathy, intense signal change (i.e., grade 2) on the spinal cord, and an SIR greater than 1.55 had a poor recovery after a surgical operation.
1. Introduction
Signal intensity (SI) changes of the spinal cord on magnetic resonance (MR) imaging reflect pathological changes in the spinal cord and are indicative of prognosis in cervical compressive myelopathy (CCM).[1–4] High SI on T2-weighted MR images (T2WI) or a low-intensity signal change on T1-weighted MR images (T1WI) are radiological prognostic factors for cervical myelopathy.[2,4–8] Many researchers have reported a correlation between clinical outcomes and SI changes on T2WI or T1WI.[1,4,7] However, a consensus concerning the degree of SI change on magnetic resonance imaging (MRI) has not been achieved.
A previous study[9] evaluated the correlation between surgical outcomes and signal changes on MRI by measuring the signal intensity ratio (SIR) of the spinal cord and comparing the signal change at the lesion and the normal area. Since that report, a few studies[10–13] have focused on the quantitative assessment of SI changes and their prognostic significance. Most of these studies assessed the SI of the spinal cord based on T2WI alone, but not on T1WI and gadolinium-diethylenetriaminepentaacetic acid (Gd-DTPA) contrast-enhanced MRI.[9,10,12]
The purpose of this study was to evaluate the correlation between the clinical outcome of patients with CCM and the quantitative assessment of SI changes on T2WI and T1WI preoperatively and postoperatively. We aimed to determine whether quantitative alterations in the SI could reflect the clinical features and surgical outcomes and the correlation with SI severity.
2. Materials and methods
2.1. Patient populations
From January 2006 to December 2012, we treated 288 patients who had ventral cord compression caused by cervical disc protrusion, bony spur, or ossification of the posterior longitudinal ligament. We conducted this prospective study with patients who were treated surgically for their conditions. We excluded 138 patients who had more than 3 levels of cord compression caused by various pathologies. Of the remaining 150 patients, we excluded 38 patients because they had undergone posterior decompressive surgeries (e.g., cervical laminoplasty, laminectomy, and fusion). A total of 112 consecutive patients with ventral cord compression at 1 or 2 levels caused by bony spur, ossification of the posterior longitudinal ligament, or disc herniation were subsequently enrolled in this study. The study protocols were approved by the Institutional Review Board at the authors’ institution. A diagnosis of CCM was assigned with radiological confirmation by MRI, and the diagnosis was determined when 1 or more upper motor neuron domains were involved (e.g., spasticity, hyperreflexia, and positive Babinski sign), based on the neurological examination.[1]
At our institution, surgical treatment was indicated for patients diagnosed with severe myelopathy (Japanese Orthopedic Association [JOA] score, 0–9) or moderate myelopathy (JOA score, 10–12).[14,15] In addition, surgical operations were performed to relieve symptoms in patients with mild myelopathy (JOA score, 13–17) who had a progressive course of neurologic deficits such as overt weakness or uncontrolled pain.
Of 112 patients, 64 patients were diagnosed as having single-level CCM at cervical vertebral body 3–cervical vertebral body 4 (C3–C4, 11 patients), cervical vertebral body 4–cervical vertebral body 5 (C4–C5, 14 patients), cervical vertebral body 5–cervical vertebral body 6 (C5–C6, 30 patients), or cervical vertebral body 6–cervical vertebral body 7 (C6–C7, 9 patients). One iliac crest autograft and Atlantis plate (Medtronic Sofamor-Danek, Memphis, TN) were used in 47 patients, while a Cervios cage (Synthes, Oberdorf, Germany) or Cornerstone cage (Medtronic Sofamor-Danek) and Atlantis plate were used in 17 patients. Forty-eight patients were diagnosed as having 2-level CCM at C3–C4–C5 (8 patients), C4–C5–C6 (14 patients), or C5–C6–C7 (26 patients). For this anterior cervical discectomy and fusion procedure, 2 autologous iliac crest autografts or cages and an Atlantis plate were used.
2.2. Radiologic assessment
All patients underwent high-resolution MRI using the 1.5T Avanto unit (Siemens, Erlangen, Germany) or 3.0T Skyra unit (Siemens), and turbo spin echo T1- and T2-weighted sagittal and axial imaging of the cervical spine (Supplemental Digital Content: Table S1). To assess preoperative cord signal changes, an intravenous injection of Gd-DTPA (Magnevist, Schering; 0.1 mmol/kg body weight) was administered after acquiring the precontrast MRI. For patients with preoperative cord signal changes, postoperative follow-up MRI examinations were completed at 3 or 6 months, and then at 12 months. The interval change in the intramedullary SI on the follow-up MR images was compared with the intramedullary SI on the preoperative images.
2.3. Signal intensity grading
Increased SI was defined as a high-intensity area in contrast to the adjacent isointensity portion of the spinal cord in the sagittal and axial planes. We evaluated an increase in the SI at the narrowest level of the spinal cord as “grade 0” if no intramedullary high SI appeared on T2WI; as “grade 1” if there was a predominantly faint and indistinct border; and as “grade 2” if there was a predominantly intense and well-defined border[1] (Fig. 1). Enhancement by Gd-DTPA appeared as a demarcation that was relatively clear from the surrounding cord parenchyma.[16] Experienced radiologists in spinal imaging graded the changes. Measurements were independently performed by 2 neuroradiologists (JHL and WHC) and the grades were recorded by consensus.
Figure 1.
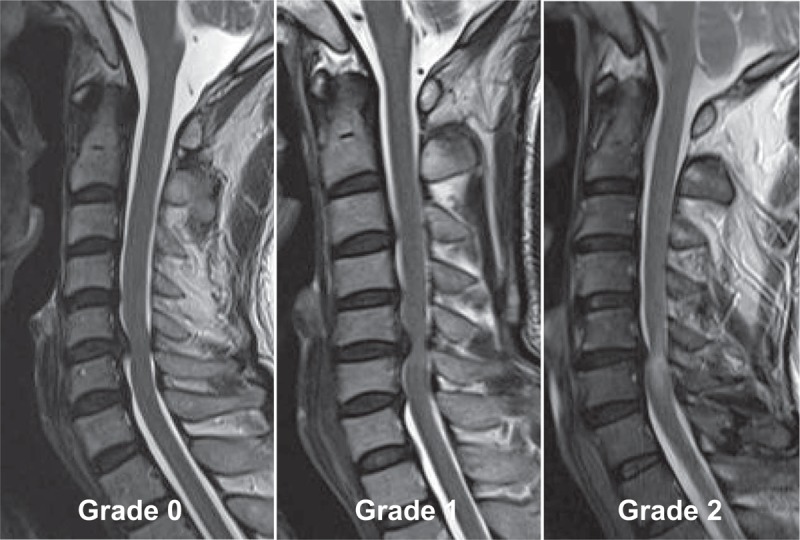
The signal intensity grading system on T2WI. The signal intensity on T2WI is assessed as grade 0 (i.e., no change in signal intensity), grade 1 (i.e., faint and indistinct signal intensity change), or grade 2 (i.e., bright signal change that is clearly distinguishable from that of grade 1). T2WI = T2-weighted magnetic resonance images.
2.4. Signal intensity ratio
The SI values of the spinal cord on the sagittal view of T1WI, Gd-DTPA contrast-enhanced T1WI, and T2WI were obtained, and the regions of interest (ROIs) were taken by 0.05 cm2. The normal cord SI at the C7-T1 disc levels was obtained, and the ROIs were taken by 0.3 cm2. The SIR between regions of 0.05 and 0.3 cm2 were calculated. If no signal change was noted on T2WI, the ROIs were taken as 0.05 cm2 in the area of severe compression of the cord. The SI value on T1WI and contrast-enhanced T1WI was measured at the same compressed area on T2WI. The SIRs on T2WI, T1WI, and Gd-DTPA contrast-enhanced T1WI were calculated by the following equation[9] (Fig. 2):.
 |
Figure 2.
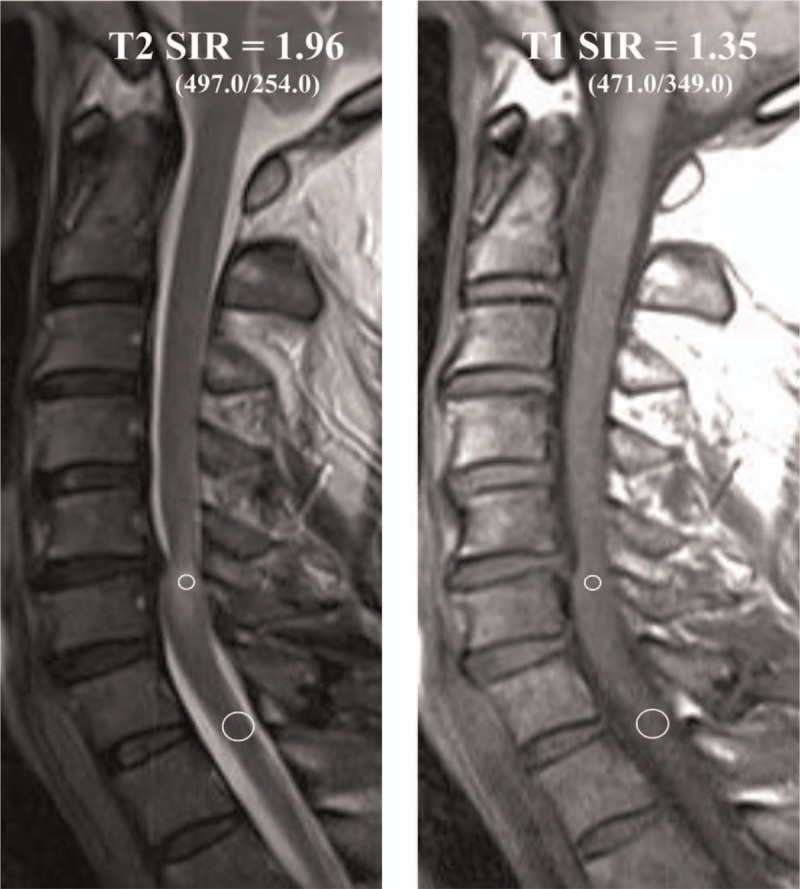
(A) The ROIs of the sagittal T2-weighted image is taken by 0.05 cm2 (small circle) in the area of a severely compressed lesion. The SI value is 497.0. The ROI of the reference region is obtained by 0.3 cm2 (large circle) in the C7–T1 disc levels; its SI value is 254.0. The SIR of the T2-weighted image between the 0.05 and 0.3 cm2 regions was calculated. The SIR on the T2-weighted image is 1.96 (497.0/254.0). (B) The ROIs of the T1-weighted image is taken by 0.05 cm2 (small circle) on the area of the same compressed cord area in the T2-weighted image; its SI value is 471.0. The ROIs of the reference region are obtained by 0.3 cm2 (large circle) in the C7–T1 disc levels; the SI value is 349.0. The SIR on the T1-weighted image is 1.35 (471.0/349.0). ROI = region of interest, SI = signal intensity, SIR = signal intensity ratio.
The compression ratio was measured by dividing the smallest anteroposterior dimension of the spinal cord by the broadest transverse diameter at the same level on the axial MRI scans[1,17] (Fig. 3). Cervical sagittal alignment was determined using Cobb method by drawing a line parallel to the inferior aspect of the C2 body and a line parallel to that of the C7 body from a neutral lateral view.[1] The neurological outcomes were evaluated according to the JOA scale for cervical myelopathy[18] (Supplemental Digital Content: Table S2). Postoperative recovery rates were calculated using the following formula:
 |
Figure 3.
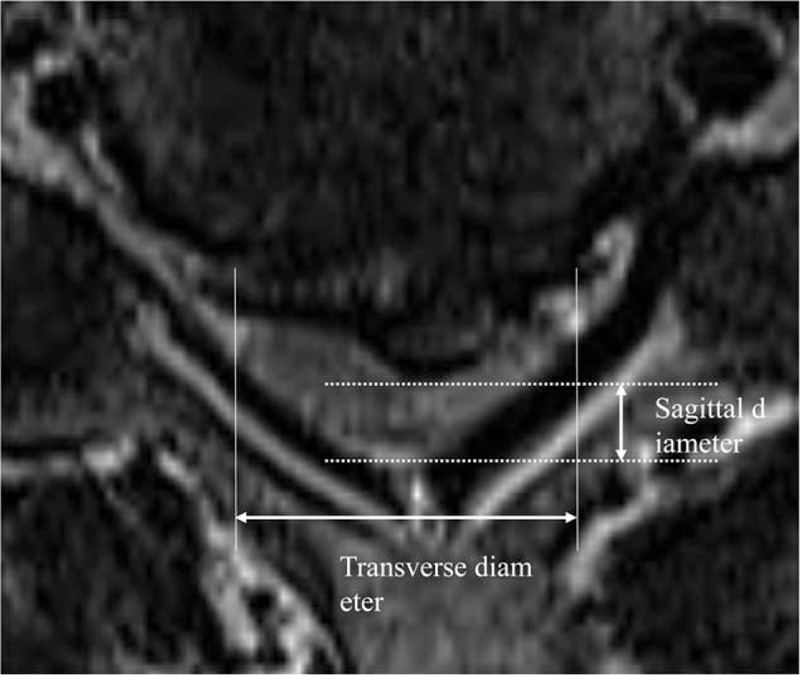
The compression ratio of the spinal cord is measured as the smallest sagittal diameter of the spinal cord divided by the broadest transverse diameter at the same level.
2.5. Statistical analysis
All values are expressed as the mean ± the standard deviation or by percentages. The data were compared using Student t test and the Chi-square test. If the data did not show a normal distribution, they were compared using the Mann–Whitney U test or Kruskal–Wallis test. For nonparametric analysis, the Mann–Whitney U test was used to analyze differences between 2 groups, and the Kruskal–Wallis test was used to analyze differences between 3 groups. Pearson correlation analysis was used to examine the relationship between age, symptom duration, cervical alignment, preoperative JOA scores, SIR on T1WI and T2WI, and JOA recovery ratio. We determined that the variables that showed a significant relationship on univariate analysis would be entered into multivariate regression analysis. A receiver operating characteristic curve was conducted to evaluate the sensitivity and specificity of the SIR in the objective measure for grades 0, 1, and 2 on T2WI. The optimal cutoff values for the grades on T2WI were determined using the maximum Youden index (sensitivity − [1 − specificity]).[19] We conducted statistical analyses using MedCalc version 16.2.1 software (MedCalc, Mariakerke, Belgium). Values of P < 0.05 were statistically significant.
3. Results
All 112 participants (72 men and 40 women; mean age, 52.6 years; age range, 26–76 years) underwent 1- or 2-level anterior cervical discectomy and fusion. The duration of preoperative symptoms ranged 2 to 64 weeks (mean, 10.2 ± 7.7 weeks). After the surgical operation, the mean follow-up time was 21.8 ± 8.8 months (range, 15.1–29.2 months). The overall mean preoperative and postoperative JOA scores were 11.2 ± 2.9 and 14.7 ± 2.6, respectively (P < 0.05). Neurological outcomes for all patients with CCM improved to a mean of 63.3% ± 20.7%, based on the JOA recovery ratio.
Gait disturbance (108 cases) was the most common clinical symptom, followed by upper extremity weakness (103 cases) and bladder dysfunction (39 cases). On neurologic examination, all patients had hyperreflexia, 77 patients had Hoffmann sign, 29 patients had Babinski sign, and 13 patients had ankle clonus. Among 112 patients, 78 (69.6%) patients with myelopathy had severe cervical myelopathy (29 patients) or moderate cervical myelopathy (49 patients), and 34 (30.4%) patients had mild cervical myelopathy (Table 1). All patients had moderate to severe pain.
Table 1.
Preoperative and postoperative JOA scores.

Seventy (62.5%) of the 112 participants had an increased SI in the spinal cord on T2WI. Of 70 patients with an increased SI change on T2WI, 47 (67.1%) patients displayed slightly increased signal changes (i.e., grade 1) on T2WI, and 23 (32.9%) patients had an intensely increased signal change (i.e., grade 2) on T2WI. On T1WI, 4.5% (5/112) of the participants had a low SI in the spinal cord preoperatively.
In addition, among 70 patients experiencing increased intramedullary signal changes on MRI, 38 patients preoperatively underwent Gd-DTPA contrast-enhanced MRI. Contrast-enhanced MR findings were obtained for 18 patients.
3.1. Symptom duration, spinal cord compression, SIR, preoperative JOA, and recovery ratio, based on the grade system of SI changes on T2WI
A comparison of the three groups – no intramedullary SI change on T2WI (grade 0, 42 patients), light SI change (grade 1, 47 patients), and bright SI change (grade 2, 23 patients) – showed a statistically significant difference in preoperative symptom duration. The mean cord compression ratios for grades 0, 1, and 2 were 35.8% ± 6.5%, 31.8% ± 7.3%, and 29.0% ± 7.4%, respectively (Table 2). We found that individuals with increased intramedullary SI on T2WI (i.e., grades 1 and 2) had a statistically significant lower cord compression ratio, compared to individuals with no SI change (grade 0). However, there was no significant difference in the cord compression ratio between SI grades 1 and 2.
Table 2.
Clinical characteristics and neurological outcome, based on signal intensity.
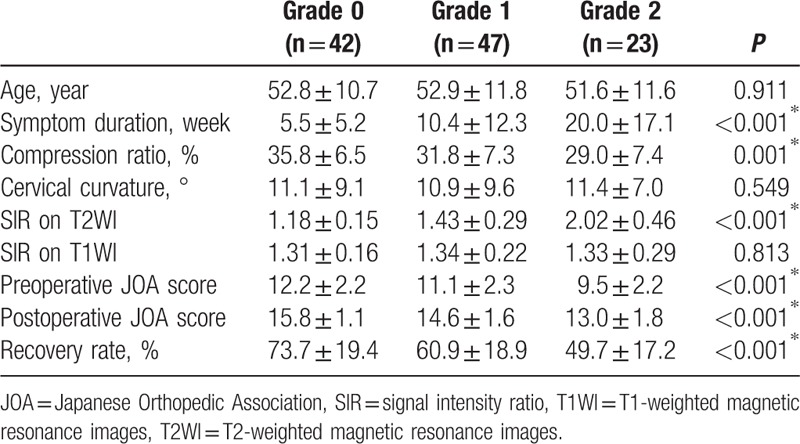
A significant difference between the 3 groups was found in the preoperative SIR on T2WI, but not in the SIR on T1WI. The respective preoperative JOA scores and recovery ratio (%) were 12.2 ± 2.2 and 73.7% ± 19.4% for SI grade 0; 11.1 ± 2.3 and 60.9% ± 18.9% for grade 1; and 9.5 ± 2.2 and 49.7% ± 17.2% for grade 2 (Table 2 and Fig. 4). In summary, there were significant differences in the duration of symptoms, cord compression ratios, preoperative SIR on T2WI, preoperative JOA score, and JOA recovery ratio between the 3 groups. However, there was no significant difference in patient age, cervical curvature, or SIR on T1WI between these groups (Table 2).
Figure 4.

(A) Twelve months after surgery, a 42-year-old man with cervical compressive myelopathy had a recovery ratio of 37.5%. The T2-weighted image shows intramedullary high signal changes at the C5–C6 level, and an SI of grade 2. The SIR on the T2-weighted image is 2.11 and the SIR on the T1-weighted image is 1.48. The small circles designate the ROIs of the T2- and T1-weighted images on the compressed lesion. The large circles designate the ROIs in the C7–T1 disc levels. (B) Twelve months after surgery, a 48-year-old male had a neurological improvement of 54.6%. The SI is grade 1. The SIR on the T2-weighted image is 1.16 and the SIR on the T1-weighted image is 1.14. (C) A 60-year-old woman had a recovery ratio of 87.5% after surgery. The SI is grade 0. The SIR on the T2-weighted image is 1.02 and the SIR on the T1-weighted image is 1.19. ROI = region of interest, SI = signal intensity, SIR = signal intensity ratio.
The receiver operating characteristic analysis showed that the optimal cutoff value of the preoperative SIR on T2WI between group 0 and group 1 was 1.23, and the sensitivity and specificity were 76.60% and 76.19%, respectively. The area under the curve was 0.786 (confidence interval [CI], 0.690–0.883; P < 0.001). The cutoff value for grades 1 and 2 was 1.55. The maximized sensitivity and specificity were 86.96% and 76.60%, respectively. The area under the curve was 0.873 (CI, 0.788–0.959; P < 0.001) (Fig. 5).
Figure 5.
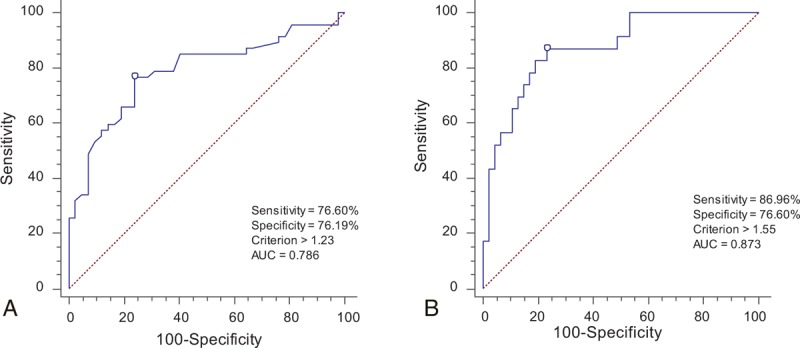
ROC curves for the grading system on T2WI. (A) The most qualified cutoff value of the SIR between grade 0 and grade 1 was 1.23. The AUC was 0.786 (CI, 0.690–0.883, P < 0.001). (B) The cutoff value of the SIR between grade 1 and grade 2 was 1.55. The AUC was 0.873 (CI, 0.788–0.959, P < 0.001). AUC = area under the curve, CI = confidence interval, ROC = receiver operating characteristic, SIR = signal intensity ratio, T2WI = T2-weighted magnetic resonance images.
3.2. Correlation coefficients between variables
Table 3 shows the correlation between the independent variables, which included symptom duration, cord compression ratio, preoperative JOA score, SIR on T2WI, SIR on T1WI, patient age, cervical alignment, and JOA recovery ratio. We found significant correlations between the compression ratio, symptom duration, preoperative JOA score, SIR on T2WI, and JOA recovery ratio (Table 3).
Table 3.
Pearson correlation coefficients between variables.

3.3. Relationship between the SIR, symptom duration, preoperative JOA score, cord compression ratio, and neurological outcomes
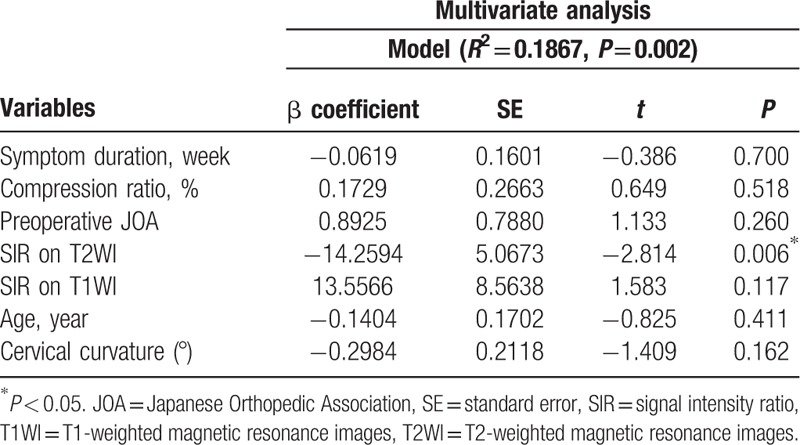
A longer duration of symptoms was significantly correlated with a higher SIR on T2WI (R2 coefficient = 0.1317, P < 0.001) (Fig. 6A). A lower cord compression ratio was associated with a higher SIR on T2WI (R2 coefficient = 0.0724, P = 0.004) (Fig. 6B). Lower preoperative JOA scores had a statistically significant relationship with a higher SIR on T2WI (R2 coefficient = 0.1234, P < 0.001) (Fig. 6C). The preoperative JOA score was positively correlated with the cord compression ratio (R2 coefficient = 0.0393, P = 0.036) (Fig. 6D). Shorter symptom duration showed a trend toward a better preoperative JOA score; however, it was not significantly correlated with the preoperative JOA score (R2 coefficient = 0.03325, P = 0.054). We did not find any significant relationship between the SIR on T1WI and symptom duration (R2 coefficient = 0.0023, P = 0.612), cord compression ratio (R2 coefficient = 0.0176, P = 0.163), preoperative JOA score (R2 coefficient = 0.0005, P = 0.809), or neurological outcome (R2 coefficient = 0.0145, P = 0.206). The SIR on Gd-DTPA contrast-enhanced T1WI was not associated with the cord compression ratio (R2 coefficient = 0.0307, P = 0.262), preoperative JOA score (R2 coefficient = 0.0301, P = 0.266), or neurological outcome (R2 coefficient = 0.0902, P = 0.051). However, the SIR on Gd-DTPA contrast-enhanced T1WI was correlated with symptom duration (R2 coefficient = 0.1286, P = 0.018). A poor neurological outcome was significantly associated with a longer duration of symptoms (R2 coefficient = 0.0430, P = 0.028), lower cord compression ratio (R2 coefficient = 0.0358, P = 0.046), lower preoperative JOA score (R2 coefficient = 0.0494, P = 0.019), and higher SIR on T2WI (R2 coefficient = 0.1155, P < 0.001). Multivariate regression analysis showed that the SIR on T2WI was the major significant contributor in predicting the postoperative recovery ratio (P = 0.006) (Table 4).
Figure 6.
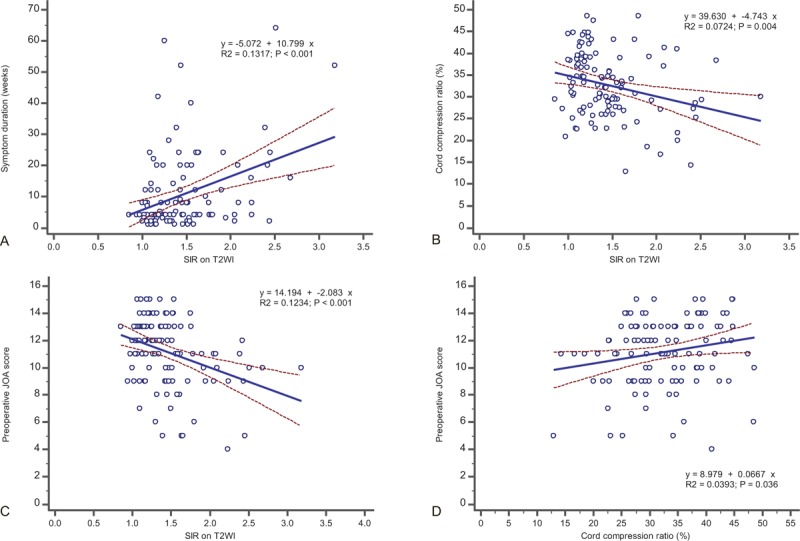
The relationship between the SIR on T2WI and symptom duration, preoperative JOA score, cord compression ratio, and JOA recovery ratio. (A) The SIR on T2WI is positively correlated with symptom duration. (B) The SIR on T2WI is associated with a lower cord compression ratio. (C) The SIR on T2WI has a significant correlation with the preoperative JOA score. (D) The preoperative JOA score is positively correlated with the cord compression ratio. JOA = Japanese Orthopedic Association, SIR = signal intensity ratio, T2WI = T2-weighted magnetic resonance images.
Table 4.
Multivariate regression analyses for neurological recovery.
3.4. Neurological outcomes based on the status of postoperative SI alterations on follow-up MRI
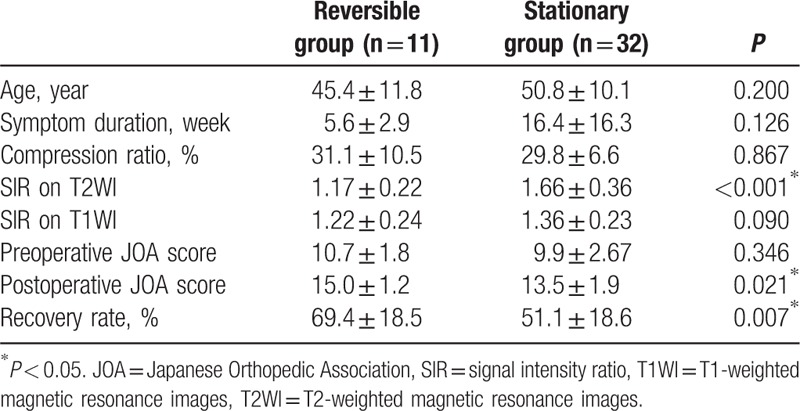
Of 70 patients with a high preoperative SI on T2WI, 43 patients (grade 1, 25 patients; grade 2, 18 patients) underwent follow-up MRI approximately 12 months after surgery (mean time, 60.0 ± 6.6 weeks). At the time of the postoperative MRI, 11 (25.6%) of the 43 patients showed a reversal of the SI, whereas 32 (74.4%) patients did not. In the SI reversal group, 9 patients were grade 1 on the preoperative T2WI and 2 patients were grade 2. The nonreversal SI group comprised 22 patients with grade 1 and 10 patients with grade 2. The mean JOA recovery ratio and SIR on T2WI of the reversal patients were 69.4% ± 18.5% and 1.17 ± 0.22, respectively, which were better values than those of the 32 nonreversal patients (51.1% ± 18.6% and 1.66 ± 0.36, respectively). The difference between these groups was statistically significant in the JOA recovery ratio (P = 0.007) and SIR on T2WI (P < 0.05) (Table 5). However, the SIR on T1WI was not statistically significantly different between the reversal group (1.22 ± 0.24) and the nonreversal group (1.36 ± 0.23) (P = 0.090).
Table 5.
Clinical characteristics and surgical outcomes based on the status of postoperative alterations in signal intensity.
4. Discussion
Anterior cervical decompression effectively prevents the deterioration of neurological function in CCM. The decision to perform a surgical operation for CCM must take into consideration the patients’ age, symptom severity, baseline function, and the patient's overall health.[20] Surgical operations are recommended for patients with moderate and severe forms of cervical myelopathy.[15,20,21] For patients with mild myelopathy, a progressive course with intractable pain or angular-edged deformity should be considered an indicator for surgery.[22–24] A Cochrane review on the role of surgery in mild cervical myelopathy concluded that a surgical operation impacts pain, weakness, and sensory loss, compared to conservative management; however, there is little or no difference in the long term.[25,26]
Various clinical and radiological findings of cervical myelopathy aid in predicting the postsurgical prognosis of patients with CCM.[3,8,27–30] In our series, patients with a shorter duration of symptoms or better functional status at presentation with less compression of the cord had greater neurological improvement after surgery.
Radiological findings such as intramedullary signal changes on preoperative T2WI and T1WI have been important for devising surgical plans since Takahashi et al[31] 1st reported that increased SI on T2WI was associated with poor clinical results. The signal changes on T2WI were presumed to be myelomalacia or cord gliosis secondary to a long-standing compressive effect of the spinal cord.[4,31–33] Hypointensity signal changes on T1WI represent myelomalacia, cavitation, necrosis, and frank loss of neuronal tissue, which are irreversible.[32] The use of several different grading systems of SI change on preoperative MR images for predicting the neurological outcome in cervical myelopathy have been proposed to avoid the ambiguity of signal changes on MR images.[1,4,6] Mehalic et al[5] categorized high SI changes on T2WI on cervical MRI into 5 grades (i.e., 0, “none”; 1, “slight”; 2, “moderate”; 3, “intense”; and 4, “very intense”), whereas Sarkar et al[6] classified intramedullary SI on T2WI into 4 subtypes, based on the margin and intensity (i.e., type 0, “none”; type 1, “fuzzy”; type 2, “sharp”; and type 3, “mixed”). However, these grading systems are complicated and are difficult to apply because of the possibility of confusion or a misreading in the evaluation of the grade of SI change. We have reported the surgical outcome in patients with cervical myelopathy using the grading system (i.e., grades 0, 1, and 2) of SI changes on T2WI described previously.[1,8] Increased severity of the SI grading system on T2WI was significantly proportional to an unfavorable neurological recovery rate after a surgical operation. Experimental studies[34–36] support the notion that chronic compression of the spinal cord leads to diminished blood flow, and ischemia to the cord is the pathophysiological mechanism of CCM. In our study, individuals with high SI on T2WI presented with a narrower compressed cord, compared to the group of individuals with no SI on T2WI. Between SI grades 1 and 2, there was no significant difference in the cord compression ratio, but there was a significant difference in symptom duration. A high SI lesion on T2WI was observed in patients with more constriction or narrowing of the spinal cord and the severity of signal change became brighter over time. Ramanauskas et al[32] divided myelomalacia into 3 stages. In the early stage, the intramedullary SI change on an MRI reflects cord edema; in the intermediate stage, a signal change reflected cystic necrosis of the central gray matter after prolonged cord edema. Ramanauskas reported that in the early and intermediate stages, the spinal cord showed high SI on T2WI, while at a later stage, the spinal cord showed low SI on T1WI and high SI on T2WI.[32] Some studies[11,13] reported that decreased SI on T1WI is a poor prognostic factor. The prevalence of T1-weighted changes ranges 2.3% to 26.9% among patients with cervical myelopathy.[11] In our series, we found that 5 (4.5%) patients preoperatively had a low SI in the spinal cord. The reason for the variation in prevalence and frequency could be the timing of the patient's visit, diagnosis, and radiographic examination. Another reason is that it is difficult to distinguish between a lower SI lesion and a normal area of spinal cord on T1WI, even if the lesion is assessed at the same compressed level as for T2WI.
Alternative techniques such as diffusion-weighted imaging (DWI) and diffusion-tensor imaging (DTI) have been proposed as quantitative diagnostic tools in cervical myelopathy.[37,38] However, various conditions of the spinal cord such as syrinx, myelomalacia, cystic necrosis, or atrophy of the cord may influence diffusion-tensor imaging values. Most studies involve small populations and no long-term follow-up.[39,40] To date, conventional MR images in cervical myelopathy have a role in predicting a prognosis after surgery. There is an ongoing debate about the validity of abnormal MRI findings to predict clinical outcome because such findings are also frequently reported in asymptomatic subjects.[41–44] Some investigators have devaluated the SI grading system as an unscientific method because of the lack of a proper quantitative method to determine the SI change.[43] Every patient has a different absolute SI value of the MR image on the compressed spinal cord lesion and the intramedullary area of the normal spinal cord.[45,46] We could not compare the absolute SI value of compressed cord lesions in individual patients with cervical myelopathy because the SI value could be diversely altered with balance changes detected by MRI.[45,46]
To overcome these problems, we prospectively evaluated the quantitative measure of SI using the SIR described previously,[9] and the relationship with neurological outcome in cervical myelopathy. We speculated that the numerical value of intramedullary signal changes may be correlated with other variables and may become a complementary method to estimate neurological improvement in patients with cervical myelopathy. The SIR may be correlated with the SI grading system, based on expert visual observation. Based on the results of this study, the SIR on T2WI was directly proportional to the severity of clinical myelopathy, length of symptom duration, and degree of spinal canal compression observed on the MRI. We found that the SIR on T2WI was statistically different between the SI grading system on T2WI, and that a higher SIR on T2WI in the preoperative phase was associated with unfavorable postoperative outcomes in cervical myelopathy. To find an objective measure for SI grading on T2WI and to support the concurrence of the SI grading system, we calculated the optimal cutoff value of SIR on T2WI to measure the SI grade. When we encountered indefinite cases of grade 0 or grade 1, patients with an SIR on T2WI that was greater than or equal to 1.23 were classified as “grade 1.” To distinguish between grade 1 and grade 2, an SIR value on T2WI greater than or equal to 1.55 was classified as “grade 2.” In the future, further study with a larger group of patients is needed to obtain the optimal cutoff value for the SI grading system.
Uchida et al[13] reported that the SIR on T1WI, but not SIR on T2WI, was correlated with clinical outcome in cervical myleopathy. We did not find a correlation between the SIR on T1WI and postoperative neurological outcome in the present study. In the cervical spinal cord, a low SI area on T1WI was mostly too small to check the ROI. We assumed that the average SIR on T1WI was less than 1 point if there was hypointensity on T1WI. In the present study, 5 patients had a low SI on T1WI preoperatively, and their average SIR was 0.89. However, we did not find a relationship between the SIR on T1WI and the recovery ratio or other variables.
MRI with Gd-DTPA enhancement provides useful information in the assessment of spinal cord lesions. Ozawa et al[47] reported that intramedullary Gd-DTPA contrast enhancement on T1WI is associated with worse prognosis in patients with cervical myelopathy. In our series, patients with a higher SIR on Gd-DTPA contrast-enhanced T1WI tended to have a poorer neurological outcome, but there was no statistically significant relationship. We believe that further study with a larger group of patients should be conducted to determine the relationship between intramedullary signal changes on contrast-enhanced T1WI, DWI, and diffusion-tensor imaging.
With respect to changes in the SI at follow-up MRI, the patients with the reversal of the signal change on T2WI had greater improvement in the JOA recovery ratio than patients with nonreversal of the SI changes on T2WI after the surgical operation. At 12 months, the postoperative SIR on T2WI showed a statistically significant difference between the reversal group and nonreversal group, whereas the SIR on T1WI did not. These results indicate the importance of follow-up MRI for predicting the postoperative functional outcome of patients with cervical myelopathy. We suggest that a follow-up MRI should be performed 12 months after surgery to predict neurological recovery, especially in patients with preoperative SI change on T2WI.
This study showed that the best surgical outcomes could be obtained in patients with mild or moderate cervical myelopathy, less cord compression, and no intramedullary signal changes in patients who underwent early decompression within 3 months after the onset of symptoms. For the SIR, the surgical decompression was favorable in the patients with a grade less than 1.23. However, based on our research, patients with severe myelopathy, an intense signal change (i.e., grade 2) on the spinal cord, and an SIR greater than 1.55 will probably have a poor recovery after a surgical operation.
There are several limitations of our series. A small number of patients were enrolled and other dynamic factors (e.g., dynamic alignment, motion, or center of rotation) were not considered. The measurement of the signal change on the spinal cord, SIR, or cord compression ratio was obtained in the neutral position. The spinal cord cross-sectional area is narrower during neck extension in patients with cervical myelopathy.[48] When the parameters were analyzed on MR images obtained under the extension of cervical spine, the radiological parameters would be expected to increase and be clearly visible.
This study did not incorporate a nonsurgical group and did not include patients with more than three-level CCM or who were treated by posterior decompression and fusion. In addition, the fact that this was not a multicenter study may limit the generalizability of the results. However, our study enrolled patients who underwent the same procedures with relatively well-controlled disease entities of 1- or 2-level cervical myelopathy. We believe future research should investigate the numerical value of signal change on T1WI and T2WI in a larger number of patients with cervical myelopathy. Further prospective and well-controlled multicenter studies should be performed to establish clinical outcomes in patients who have undergone anterior or posterior decompression surgery for multilevel CCM and should include a nonsurgical group. Nonetheless, we hope that the findings of the present study will be helpful when considering the prognosis of surgery for patients with CCM.
5. Conclusions
Quantitative alterations in the SI could reflect the clinical features of CCM and surgical outcomes. A higher SIR on T2WI was significantly correlated with a longer symptom duration, lower preoperative JOA score, narrower compressed cord, and poorer postoperative recovery rate, but was not correlated with the SIR on T1WI and contrast-enhanced T1WI. We concluded that the grading system of high-intensity signal change on T2WI is valuable for predicting the clinical outcome. Quantification of SI changes (i.e., SIR on T2WI) in patients with CCM can be used as a complementary method to assess the correlation between the intramedullary signal changes and clinical outcome. Patients with severe myelopathy, an intense signal change (i.e., grade 2) on the spinal cord, and an SIR greater than 1.55 will have a poor recovery after a surgical operation.
Acknowledgments
The authors thank Hyun Kyung Park, PhD, for her contributions in drafting the manuscript and revising it for important intellectual content. The authors also thank Ms Ah Ram Lee for creating the original artwork for the figures and statistical analysis of the data in this publication.
Supplementary Material
Footnotes
Abbreviations: CCM = cervical compressive myelopathy, Gd-DTPA = gadolinium-diethylenetriaminepentaacetic acid, JOA = Japanese Orthopedic Association, MR = magnetic resonance, MRI = magnetic resonance imaging, ROI = region of interest, SI = signal intensity, SIR = signal intensity ratio, T1WI = T1-weighted magnetic resonance images, T2WI = T2-weighted magnetic resonance images.
Authorship: THK performed the analysis of data and drafted the manuscript; YH and JJS critically revised the manuscript for important intellectual content and gave final approval of the version to be submitted; JHL participated in the design of the study and performed the statistical analysis; YEC and WHC conceived the study, participated in its design and coordination, and helped to draft the manuscript; and all authors have read and approved the final manuscript.
The authors have no funding and conflicts of interest to disclose.
Supplemental Digital Content is available for this article.
References
- 1.Shin JJ, Jin BH, Kim KS, et al. Intramedullary high signal intensity and neurological status as prognostic factors in cervical spondylotic myelopathy. Acta Neurochir (Wien) 2010; 152:1687–1694. [DOI] [PubMed] [Google Scholar]
- 2.Zhang P, Shen Y, Zhang YZ, et al. Significance of increased signal intensity on MRI in prognosis after surgical intervention for cervical spondylotic myelopathy. J Clin Neurosci 2011; 18:1080–1083. [DOI] [PubMed] [Google Scholar]
- 3.Cho YE, Shin JJ, Kim KS, et al. The relevance of intramedullary high signal intensity and gadolinium (Gd-DTPA) enhancement to the clinical outcome in cervical compressive myelopathy. Eur Spine J 2011; 20:2267–2274. [DOI] [PMC free article] [PubMed] [Google Scholar]
- 4.Ohshio I, Hatayama A, Kaneda K, et al. Correlation between histopathologic features and magnetic resonance images of spinal cord lesions. Spine (Phila Pa 1976) 1993; 18:1140–1149. [DOI] [PubMed] [Google Scholar]
- 5.Mehalic TF, Pezzuti RT, Applebaum BI. Magnetic resonance imaging and cervical spondylotic myelopathy. Neurosurgery 1990; 26:217–226.discussion 226–217. [DOI] [PubMed] [Google Scholar]
- 6.Sarkar S, Turel MK, Jacob KS, et al. The evolution of T2-weighted intramedullary signal changes following ventral decompressive surgery for cervical spondylotic myelopathy: clinical article. J Neurosurg Spine 2014; 21:538–546. [DOI] [PubMed] [Google Scholar]
- 7.Harrop JS, Naroji S, Maltenfort M, et al. Cervical myelopathy: a clinical and radiographic evaluation and correlation to cervical spondylotic myelopathy. Spine (Phila Pa 1976) 2010; 35:620–624. [DOI] [PubMed] [Google Scholar]
- 8.Chen CJ, Lyu RK, Lee ST, et al. Intramedullary high signal intensity on T2-weighted MR images in cervical spondylotic myelopathy: prediction of prognosis with type of intensity. Radiology 2001; 221:789–794. [DOI] [PubMed] [Google Scholar]
- 9.Zhang YZ, Shen Y, Wang LF, et al. Magnetic resonance T2 image signal intensity ratio and clinical manifestation predict prognosis after surgical intervention for cervical spondylotic myelopathy. Spine (Phila Pa 1976) 2010; 35:E396–E399. [DOI] [PubMed] [Google Scholar]
- 10.Wang LF, Zhang YZ, Shen Y, et al. Using the T2-weighted magnetic resonance imaging signal intensity ratio and clinical manifestations to assess the prognosis of patients with cervical ossification of the posterior longitudinal ligament. J Neurosurg Spine 2010; 13:319–323. [DOI] [PubMed] [Google Scholar]
- 11.Nouri A, Tetreault L, Zamorano JJ, et al. Role of magnetic resonance imaging in predicting surgical outcome in patients with cervical spondylotic myelopathy. Spine (Phila Pa 1976) 2015; 40:171–178. [DOI] [PubMed] [Google Scholar]
- 12.Arvin B, Kalsi-Ryan S, Karpova A, et al. Postoperative magnetic resonance imaging can predict neurological recovery after surgery for cervical spondylotic myelopathy: a prospective study with blinded assessments. Neurosurgery 2011; 69:362–368. [DOI] [PubMed] [Google Scholar]
- 13.Uchida K, Nakajima H, Takeura N, et al. Prognostic value of changes in spinal cord signal intensity on magnetic resonance imaging in patients with cervical compressive myelopathy. Spine J 2014; 14:1601–1610. [DOI] [PubMed] [Google Scholar]
- 14.Okada Y, Ikata T, Yamada H, et al. Magnetic resonance imaging study on the results of surgery for cervical compression myelopathy. Spine (Phila Pa 1976) 1993; 18:2024–2029. [DOI] [PubMed] [Google Scholar]
- 15.Yonenobu K. Cervical radiculopathy and myelopathy: when and what can surgery contribute to treatment? Eur Spine J 2000; 9:1–7. [DOI] [PMC free article] [PubMed] [Google Scholar]
- 16.Takahashi M, Yamashita Y, Sakamoto Y, et al. Chronic cervical cord compression: clinical significance of increased signal intensity on MR images. Radiology 1989; 173:219–224. [DOI] [PubMed] [Google Scholar]
- 17.Fujiwara K, Yonenobu K, Ebara S, et al. The prognosis of surgery for cervical compression myelopathy. An analysis of the factors involved. J Bone Joint Surg Br 1989; 71:393–398. [DOI] [PubMed] [Google Scholar]
- 18.Hirabayashi K, Miyakawa J, Satomi K, et al. Operative results and postoperative progression of ossification among patients with ossification of cervical posterior longitudinal ligament. Spine (Phila Pa 1976) 1981; 6:354–364. [DOI] [PubMed] [Google Scholar]
- 19.Akobeng AK. Understanding diagnostic tests 3: receiver operating characteristic curves. Acta Paediatr 2007; 96:644–647. [DOI] [PubMed] [Google Scholar]
- 20.Lebl DR, Hughes A, Cammisa FP, Jr, et al. Cervical spondylotic myelopathy: pathophysiology, clinical presentation, and treatment. HSS J 2011; 7:170–178. [DOI] [PMC free article] [PubMed] [Google Scholar]
- 21.Rhee JM, Shamji MF, Erwin WM, et al. Nonoperative management of cervical myelopathy: a systematic review. Spine (Phila Pa 1976) 2013; 38 (22 Suppl 1):S55–S67. [DOI] [PubMed] [Google Scholar]
- 22.Sumi M, Miyamoto H, Suzuki T, et al. Prospective cohort study of mild cervical spondylotic myelopathy without surgical treatment. J Neurosurg Spine 2012; 16:8–14. [DOI] [PubMed] [Google Scholar]
- 23.Neo M, Fujibayashi S, Takemoto M, et al. Clinical results of and patient satisfaction with cervical laminoplasty for considerable cord compression with only slight myelopathy. Eur Spine J 2012; 21:340–346. [DOI] [PMC free article] [PubMed] [Google Scholar]
- 24.Morishita Y, Matsushita A, Maeda T, et al. Rapid progressive clinical deterioration of cervical spondylotic myelopathy. Spinal Cord 2015; 53:408–412. [DOI] [PubMed] [Google Scholar]
- 25.Fouyas IP, Statham PF, Sandercock PA. Cochrane review on the role of surgery in cervical spondylotic radiculomyelopathy. Spine (Phila Pa 1976) 2002; 27:736–747. [DOI] [PubMed] [Google Scholar]
- 26.Nikolaidis I, Fouyas IP, Sandercock PA, et al. Surgery for cervical radiculopathy or myelopathy. Cochrane Database Syst Rev 2010; CD001466. [DOI] [PMC free article] [PubMed] [Google Scholar]
- 27.Nakamura M, Fujimura Y. Magnetic resonance imaging of the spinal cord in cervical ossification of the posterior longitudinal ligament. Can it predict surgical outcome? Spine (Phila Pa 1976) 1998; 23:38–40. [DOI] [PubMed] [Google Scholar]
- 28.Morio Y, Teshima R, Nagashima H, et al. Correlation between operative outcomes of cervical compression myelopathy and mri of the spinal cord. Spine (Phila Pa 1976) 2001; 26:1238–1245. [DOI] [PubMed] [Google Scholar]
- 29.Tetreault L, Nouri A, Singh A, et al. An assessment of the key predictors of perioperative complications in patients with cervical spondylotic myelopathy undergoing surgical treatment: results from a survey of 916 AOSpine International members. World Neurosurg 2015; 83:679–690. [DOI] [PubMed] [Google Scholar]
- 30.Shamji MF, Mohanty C, Massicotte EM, et al. The association of cervical spine alignment with neurologic recovery in a prospective cohort of patients with surgical myelopathy: analysis of a series of 124 cases. World Neurosurg 2016; 86:112–119. [DOI] [PubMed] [Google Scholar]
- 31.Takahashi M, Sakamoto Y, Miyawaki M, et al. Increased MR signal intensity secondary to chronic cervical cord compression. Neuroradiology 1987; 29:550–556. [DOI] [PubMed] [Google Scholar]
- 32.Ramanauskas WL, Wilner HI, Metes JJ, et al. MR imaging of compressive myelomalacia. J Comput Assist Tomogr 1989; 13:399–404. [DOI] [PubMed] [Google Scholar]
- 33.Karpova A, Arun R, Cadotte DW, et al. Assessment of spinal cord compression by magnetic resonance imaging – can it predict surgical outcomes in degenerative compressive myelopathy? A systematic review. Spine (Phila Pa 1976) 2013; 38:1409–1421. [DOI] [PubMed] [Google Scholar]
- 34.Gooding MR, Wilson CB, Hoff JT. Experimental cervical myelopathy. Effects of ischemia and compression of the canine cervical spinal cord. J Neurosurg 1975; 43:9–17. [DOI] [PubMed] [Google Scholar]
- 35.Doppman JL. The mechanism of ischemia in anteroposterior compression of the spinal cord. Invest Radiol 1975; 10:543–551. [DOI] [PubMed] [Google Scholar]
- 36.Karadimas SK, Gatzounis G, Fehlings MG. Pathobiology of cervical spondylotic myelopathy. Eur Spine J 2015; 24 suppl 2:132–138. [DOI] [PubMed] [Google Scholar]
- 37.Mamata H, Jolesz FA, Maier SE. Apparent diffusion coefficient and fractional anisotropy in spinal cord: age and cervical spondylosis-related changes. J Magn Reson Imaging 2005; 22:38–43. [DOI] [PubMed] [Google Scholar]
- 38.Toktas ZO, Tanrikulu B, Koban O, et al. Diffusion tensor imaging of cervical spinal cord: a quantitative diagnostic tool in cervical spondylotic myelopathy. J Craniovertebr Junction Spine 2016; 7:26–30. [DOI] [PMC free article] [PubMed] [Google Scholar]
- 39.Demir A, Ries M, Moonen CT, et al. Diffusion-weighted MR imaging with apparent diffusion coefficient and apparent diffusion tensor maps in cervical spondylotic myelopathy. Radiology 2003; 229:37–43. [DOI] [PubMed] [Google Scholar]
- 40.Yoo WK, Kim TH, Hai DM, et al. Correlation of magnetic resonance diffusion tensor imaging and clinical findings of cervical myelopathy. Spine J 2013; 13:867–876. [DOI] [PubMed] [Google Scholar]
- 41.Morio Y, Yamamoto K, Kuranobu K, et al. Does increased signal intensity of the spinal cord on MR images due to cervical myelopathy predict prognosis? Arch Orthop Trauma Surg 1994; 113:254–259. [DOI] [PubMed] [Google Scholar]
- 42.Shepard MJ, Bracken MB. Magnetic resonance imaging and neurological recovery in acute spinal cord injury: observations from the National Acute Spinal Cord Injury Study 3. Spinal Cord 1999; 37:833–837. [DOI] [PubMed] [Google Scholar]
- 43.Yone K, Sakou T, Yanase M, et al. Preoperative and postoperative magnetic resonance image evaluations of the spinal cord in cervical myelopathy. Spine (Phila Pa 1976) 1992; 17 (10 Suppl):S388–S392. [DOI] [PubMed] [Google Scholar]
- 44.Nakashima H, Yukawa Y, Suda K, et al. Abnormal findings on magnetic resonance images of the cervical spines in 1211 asymptomatic subjects. Spine (Phila Pa 1976) 2015; 40:392–398. [DOI] [PubMed] [Google Scholar]
- 45.Poldrack RA. Region of interest analysis for fMRI. Soc Cogn Affect Neurosci 2007; 2:67–70. [DOI] [PMC free article] [PubMed] [Google Scholar]
- 46.Astrakas LG, Argyropoulou MI. Shifting from region of interest (ROI) to voxel-based analysis in human brain mapping. Pediatr Radiol 2010; 40:1857–1867. [DOI] [PubMed] [Google Scholar]
- 47.Ozawa H, Sato T, Hyodo H, et al. Clinical significance of intramedullary Gd-DTPA enhancement in cervical myelopathy. Spinal Cord 2010; 48:415–422. [DOI] [PubMed] [Google Scholar]
- 48.Machino M, Yukawa Y, Ito K, et al. Dynamic changes in dural sac and spinal cord cross-sectional area in patients with cervical spondylotic myelopathy: cervical spine. Spine (Phila Pa 1976) 2011; 36:399–403. [DOI] [PubMed] [Google Scholar]
Associated Data
This section collects any data citations, data availability statements, or supplementary materials included in this article.


