Abstract
To compare the diagnostic performance of gadoxetic acid-enhanced magnetic resonance imaging (MRI) with that of computed tomography (CT) during hepatic arteriography and arterial portography (CT HA/AP) for detecting hepatocellular carcinoma (HCC) from small hypervascular nodules.
This retrospective study included 38 patients with 131 hypervascular nodules (≤2 cm) who had underwent MRI and CT HA/AP within a 2-week interval. Two observers analyzed MRI while other 2 observers analyzed CT HA/AP. Thereafter, MRI observers reviewed the CT HA/AP and magnetic resonance (MR) images again using both modalities. HCC was diagnosed by pathologic or imaging studies according to American Association for the Study of Liver Diseases (AASLD) criteria. Alternative free-response receiver operating characteristic (ROC) analysis was performed on a lesion-by-lesion basis. Diagnostic accuracy (area under the ROC curve [Az]), sensitivity, specificity, and positive and negative predictive values were calculated.
The pooled Az was significantly higher for the combined modalities (0.946) than for MRI alone (0.9, P = 0.004), and for MRI than for CT HA/AP alone (0.827, P = 0.0154). Subgroup analysis for HCC ≤1 cm showed the sensitivity of the combined modalities (79.4%) was significantly higher than for MRI (52.9%) and CT HA/AP alone (50%) (both, P < 0.005). The specificity of the combined modalities was not different from MRI alone (98.8% vs. 97.3%, P = 0.5), but was significantly higher than for CT HA/AP alone (98.8% vs. 92.5%, P = 0.022).
Hypervascular HCCs >1 to 2 cm can be diagnosed sufficiently by MRI. The combined modalities increased the diagnostic accuracy of HCCs ≤1 cm, compared with MRI or CT HA/AP alone.
Keywords: CT HA/AP, gadoxetic acid-enhanced MRI, hypervascular hepatocellular carcinoma
1. Introduction
Hepatocellular carcinoma (HCC) represents 75% of primary liver cancers,[1] which are the seventh most common cancers globally.[2] Hepatocellular carcinoma usually develops in patients with liver cirrhosis with an annual incidence of 1% to 8%,[3] which is the most important and independent risk factor for HCC, irrespective of its etiology. Hepatocellular carcinoma shows generally poor prognosis with a 5-year survival rate of 12%; however, a cure is very highly likely when it is detected at an early stage (<2 cm in diameter).[4] Thus, active surveillance for HCC using ultrasonography and tumor markers is recommended for patients with liver cirrhosis.[4] This policy has gradually increased the number of small hepatic nodules detected in cirrhotic livers, and necessitates more efficient recall policies to differentiate HCC from other hepatic nodules.[3]
In response to this demand, the European Association for the Study of the Liver (EASL) and the American Association for the Study of Liver Diseases (AASLD) established noninvasive diagnostic criteria for HCC in cirrhotic patients, which proposes that one imaging technique (e.g., computed tomography [CT] or magnetic resonance imaging [MRI]) with a HCC radiological hallmark (i.e., arterial hypervascularity and venous/late-phase washout in optimal settings) suffices for diagnosing tumors ≥1 cm in diameter.[3,5] Therefore, most hypervascular HCCs are diagnosed and are treated, based on imaging findings alone, even without pathologic confirmation, except for HCCs <1 cm, while hypovascular HCCs still require histologic proof. However, which imaging modalities or their combinations are most competent for diagnosing small hypervascular HCCs remains unclear.
A Japanese study revealed that the combination of CT during arterial portography (CTAP) and double-phase CT during hepatic arteriography (CTHA) achieved a sensitivity of 93% and specificity of 97% in detecting hypervascular HCC.[6] Another Japanese study reported a significantly lower detectability of small hypervascular HCC on conventional dynamic CT or gadolinium-enhanced MRI, compared with double-phase CTHA.[7]
Meanwhile, gadoxetic acid-enhanced MRI is widely used to detect and characterize various hepatic nodules. The high contrast generated by gadoxetic acid between focal hepatic lesions and the background parenchyma in the hepatobiliary phase (HBP) helps in differentiating early HCC from benign cirrhotic nodules.[8,9] Several studies report the excellent performance of gadoxetic acid-enhanced MRI in detecting small HCC, compared with conventional dynamic CT or gadolinium-based MRI.[10,11] Furthermore, a few studies demonstrated that gadoxetic acid-based dynamic MRI was more sensitive than combining CTHA and CTAP (CT HA/AP) in diagnosing small HCC,[12,13] and thus may replace CT HA/AP in the pre-therapeutic evaluation of patients with HCC. However, the foregoing studies included both hypervascular and hypovascular HCCs; therefore, this prospect may not be valid when evaluating hypervascular HCC.
To date, a study comparing the diagnostic accuracy between gadoxetic acid-enhanced MRI and CT HA/AP in detecting small hypervascular HCC (≤2 cm) is lacking. In the present study, we evaluated the diagnostic performance of gadoxetic acid-enhanced MRI and CT HA/AP in discriminating HCC from small hypervascular hepatic lesions (in particular, tumors ≤1 and ≤2 cm) in patients with cirrhosis, and we further assessed whether combining both modalities could improve the diagnostic efficacy.
2. Materials and methods
2.1. Patient selection
The Institutional Review Board of our hospital approved this retrospective study and informed consent was waived. The inclusion criteria were patients with hepatic nodular lesions ≤2 cm in diameter with a hypervascularity on CTHA or on the arterial phase of dynamic MRI, underlying liver cirrhosis, available imaging data of both CT HA/AP and gadoxetic acid-enhanced MRI obtained within a 2-week interval, and lesions that had not been treated for HCC before the examination.
A computerized database was searched at an institution (BLINDED) from January 2008 to December 2010. Eighty-six consecutive patients with underlying liver cirrhosis were referred to the Liver Department for evaluation of hepatic nodules. They underwent CT HA/AP and gadoxetic acid-enhanced MRI within a 2-week interval (Fig. 1). Among them, we excluded 33 patients in whom all arterial enhancing lesions were >2 cm in diameter, 9 patients without any arterial enhancing lesions, and 6 patients without any assessable lesions because of previously performed locoregional treatment. Thus, the remaining 38 patients met the inclusion criteria and represented 131 arterial enhancing lesions measuring 0.5 to 2.0 cm for final analysis.
Figure 1.
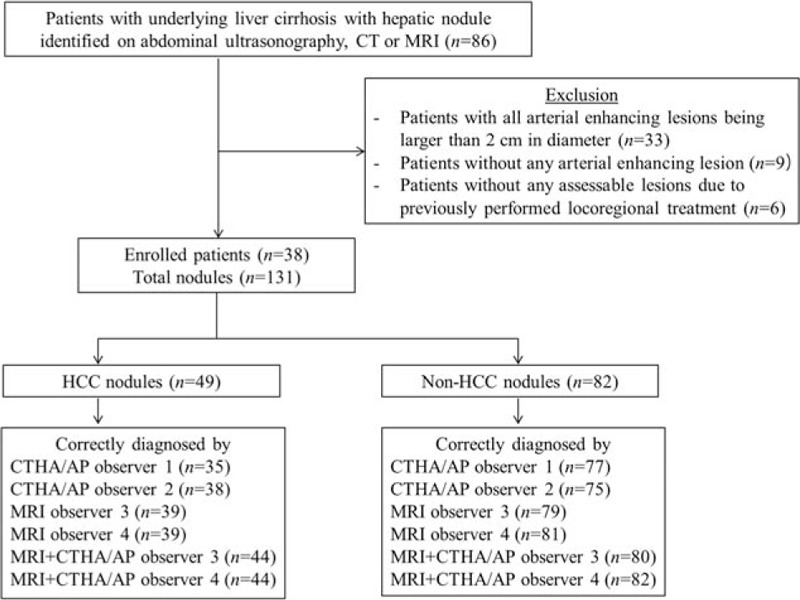
Flow chart of patients.
2.2. Reference standard for diagnosis
The diagnosis of HCC was established by either pathologic examinations or image studies.
Imaging criteria for the diagnosis of HCC were lesions >1 cm that were identified through multimodality imaging (e.g., ultrasonography, CT, and MRI). These lesions were diagnosed as HCC even without histologic proof if they showed the HCC radiological hallmark (i.e., arterial hypervascularity and venous/late-phase washout) on MRI with enhancement on CTHA and perfusion defect on CTAP imaging. For lesions ≤1 cm that satisfied the same aforementioned radiologic findings, HCC was diagnosed if a definite growth (>1 cm) was noted during 12-month follow-up period after the index imaging study or persistent dense nodular lipiodol uptake was noted on a follow-up multidetector CT or MRI after transarterial chemoembolization (TACE).
The diagnosis of non-HCC lesions was largely based on imaging findings and their stability on follow-up CT HA/AP or MRI. A nodule was diagnosed as hemangioma when it demonstrated typical and stable images whereas a nodule was diagnosed as arterioportal shunts when it either appeared as pleomorphic arterial enhancing lesions that remained unchanged for at least 12 months or disappeared during follow-up without any distinct nondynamic magnetic resonance (MR) images.
2.3. Magnetic resonance examination
Magnetic resonance imaging was performed using one of two 3.0-T MR systems (Achieva, Philips Healthcare, Best, the Netherlands; Tim Trio, Siemens, Erlangen, Germany) with 16-channel phased-array receiver coils. The liver was imaged in all patients before and after the administration of gadoxetic acid (Primovist; Bayer Healthcare, Berlin, Germany) at a dose of 0.1 mL per kilogram of body weight (0.025 mmol/mL). Intravenous injection of the contrast agent was administered automatically at a rate of 1 mL/s with a power injector, followed by a 20-mL saline flush.
Routine MRI protocol consisted of a T1-weighted breath-hold dual-echo in- and opposed-phase sequence and a fat-suppressed respiratory-triggered heavily T2-weighted sequence. Diffusion-weighted images were acquired by respiratory-triggered single-shot echo-planar imaging and were obtained with b values of 0, 400, and 800 s/mm2. For contrast-enhanced dynamic MR imaging, 0.025 mmol per kilogram of body weight of gadoxetic acid disodium (Primovist; Bayer-Schering, Berlin, Germany) was injected as a rapid bolus and was immediately followed by a saline flush of 15 to 20 mL. A three-dimensional dynamic axial volumetric interpolated breath-hold examination images was performed at 30 to 35 seconds (arterial phase), 65 to 70 seconds (portal phase), 100 to 120 seconds (hepatic venous phase), and 5 minutes (equilibrium phase) after the injection of the intravenous contrast agent. Additional hepatobiliary phase images were obtained at 20 minutes after injection.
2.4. Computed tomography during hepatic arteriography and CTAP
After bilateral femoral artery punctures, two 5-French catheters were selectively placed, one in the superior mesenteric artery and the other in the common hepatic artery or replaced the right hepatic artery, depending on the arterial variation. The CTHA and CTAP images were obtained by a 64-MDCT scanner (Brilliance 64, Phillips Medical Systems, Cleveland, OH). The CT parameters were 0.4 second rotation time; 120 kVp, 120 to 280 mAs with dose modulation; 64 × 0.625 detector configuration; and beam pitch, 0.642, depending on the liver size. The CTAP scan was performed 35 seconds after the start of the injection of a total of 60 mL of nonionic contrast medium (iopamidol [Pamiray 300, Dongkook Pharmaceutical, Seoul, Korea] and iopromide 300 [Ultravist 300, Bayer-Schering Pharma, Berlin, Germany]) at a speed of 2 mL/s with a power injector through a catheter in the superior mesenteric artery. Early- and late-phase CTHA scanning was performed at 15 and 40 s, respectively, after the start of the injection of 30 mL of the same contrast medium at a speed of 1.5 mL/s through the other catheter in the common hepatic artery or replaced by the right hepatic artery. When the liver was supplied by two arteries, both arteries were selected, one after the other, and CT was performed twice.
2.5. Image analysis
All images were evaluated at a 2000 × 2000 picture archiving and communication system monitor with adjustment of the optimal window setting in each case. The images were analyzed by 4 radiologists who were daily involved in interpreting liver images. Two interventional radiologists (BLINDED, with 16 and 19 years of experience in CT HA/AP interpretation) specialized in HCC treatment reviewed the CT HA/AP images, whereas the other 2 gastrointestinal radiologists (BLINDED, with 6 and 17 years of experience in liver MRI interpretation, respectively) reviewed the MRI images. One month after the first interpretation session, the MRI observers had a second interpretation session for which they were provided CT HA/AP and MRI images, and reviewed the lesions again using both imaging modalities in combination. The observers knew that the patients had underlying liver disease and were at risk of HCC but they did not know which nodules were suspected and had no information about their final diagnosis. The final diagnosis was confirmed by the consensus of 2 study coordinators (1 radiologist and 1 hepatologist).
Each observer independently recorded the presence and location of the lesions, and finally scored the lesion using a 4-point confidence scale: 1, probably not an HCC; 2, possibly HCC; 3, probably HCC; and 4, definitely HCC. Images in which lesions were undetected were rated 0. During the first and second interpretation sessions, the observers knew that sensitivity was counted by the number of lesions assigned a 3 or 4 confidence level. A coordinating radiologist (BLINDED) with 17 years’ experience of liver MRI, who was not involved with the interpretation sessions, matched and annotated the same lesions on the liver MRI and CT HA/AP to avoid a mismatch between scored lesions by the 4 observers.
In clinical practice at our institution, HCC on gadoxetic acid-enhanced MRI is diagnosed by the following 5 MRI findings: enhancement on arterial phase, hyperintensity on T2-weighted images, hyperintensity on diffusion-weighted images with a b value of 400 or 800 s/mm2, capsular enhancement or washout on portal or 3-minute late-phase images, and hypointensity on HBP images. On MR images, a lesion was hyperintense when its signal intensity was higher than that of the surrounding liver, isointense when its intensity was comparable to that of the surrounding liver, and hypointense when its intensity was lower than that of the surrounding liver. Washout was defined as enhancement of a nodule in the arterial phase, followed by hypointensity relative to the surrounding hepatic parenchyma in the portal or 3-minute late phase. Capsular enhancement was considered positive when the portal or 3-minute late-phase images showed a hyperintense rim around the lesion.
Hepatocellular carcinoma on CT HA/AP, was diagnosed by the presence of discrete hypervascular nodule on the early-phase and corona enhancement in the late phase of CTHA with or without a discrete, well-defined, circular or oval nodular perfusion defect on CTAP.
2.6. Statistical analysis
Statistical analyses were performed using the statistic software MedCalc version 14.12 (MedCalc Software bvba, Ostend, Belgium) and SPSS version 20.0 (SPSS Inc., Chicago, IL). Alternative free-response receiver operating characteristic (ROC) curve analysis was performed on a lesion-by-lesion basis.[14] To determine the diagnostic accuracy of CT HA/AP, MRI, and the combined modalities, composite ROC curves were obtained by pooling the performance of the 2 CT HA/AP observers and the 2 MR observers into a single curve for each modality and the combined modalities. Diagnostic accuracy was assessed by calculating the area under the ROC curve (Az). The relative sensitivities and specificities for diagnosing HCC by each modality and the combined imaging modalities were calculated by pooling the data of the individual observers, and were compared using the McNemar test. The sensitivities for detecting HCC were determined by the number of HCC lesions assigned a score of 3 or greater whereas the specificities were determined by the number of non-HCC lesions that were assigned a score of 0 to 2. Interobserver agreement for the evaluation of MR or CT HA/AP images was assessed by κ statistics. A κ value of 0.61 to 0.80 indicated substantial agreement and values >0.80 indicated perfect agreement.[15]
3. Results
3.1. Patient characteristics
Thirty eight patients were comprised of 31 men and 7 women patients, aged between 45 and 82 years. The etiologies of liver cirrhosis were mostly hepatitis B virus infection (71%) followed by alcohol (21%) and hepatitis C virus infection (8%). Majority of the study population was highly functional child A cirrhotic patients (n = 34) while only 1 was a child C patient.
3.2. Distribution and characteristics of the nodules
The characteristics of the identified lesions are shown in Table 1. A total of 49 HCCs (mean size, 13.4 ± 4.5 mm; range, 5–20 mm) were detected in 19 patients with 1 lesion, 7 patients with 2 lesions, 4 patients with 3 lesions, and 1 with 4 lesions. Eighty-two non-HCC lesions (mean size, 7.8 ± 2.7 mm; range, 5–19 mm) were identified in 32 patients; 73 arterioportal shunts and 5 hemangiomas were diagnosed according to aforementioned image criteria while 1 peribiliary hamartoma and 3 benign unspecified nodules had pathological proof. Overall, 90 (68.7%) lesions were ≤1 cm; 73 of these lesions were non-HCC and 17 were HCC lesions.
Table 1.
Characteristics of the hypervascular lesions.
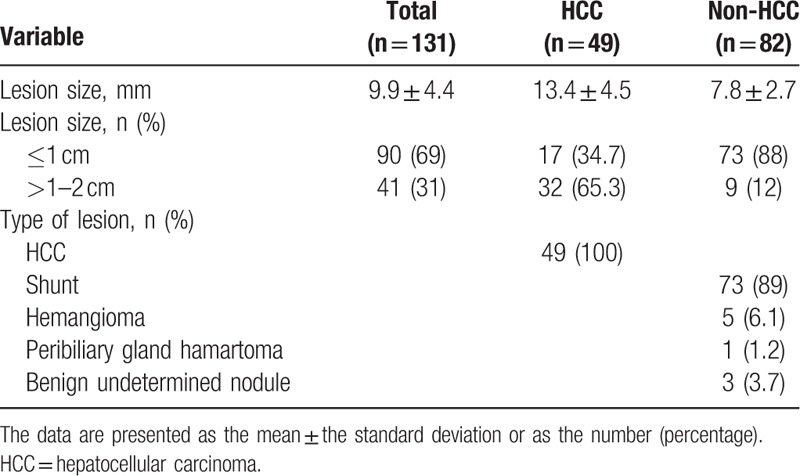
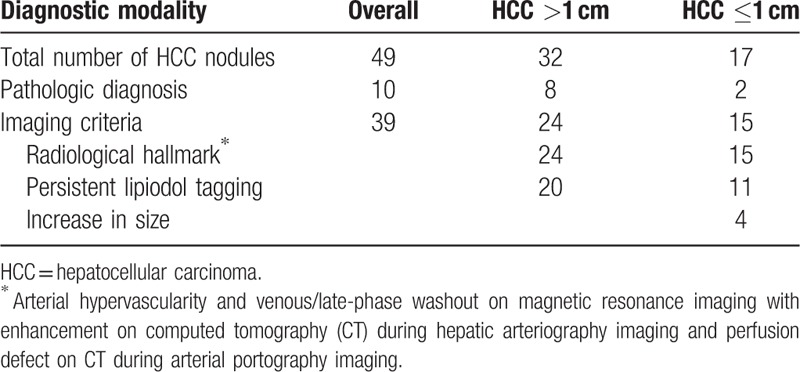
The diagnosis of HCC was established by pathologic examinations (n = 10) or image studies (n = 39) (Table 2). Among the 10 histopathologically confirmed HCC nodules, only 2 nodules were ≤1 cm. All nodules diagnosed using image studies satisfied the HCC radiological hallmark. In addition, 20 out of 24 nodules (>1 cm) and 11 out of 15 nodules (≤1 cm) treated with TACE exhibited persistent compact lipiodol uptake while the remaining 4 nodules (≤1 cm) showed a definite growth (>1 cm) during 12-month follow-up period after the index imaging study.
Table 2.
Diagnostic modality of hepatocellular carcinoma.
3.3. The ROC analysis
The pooled area under the ROC curve (Az) values for 2 MRI observers were significantly higher than the pooled Az values of the CT HA/AP observers (pooled Az on MRI, 0.9; pooled Az on CT HA/AP, 0.827; P = 0.0154). When the MRI observers assessed the CT HA/AP and MR images, the pooled Az value for the combined modalities further increased to 0.946, which was significantly higher than the pooled Az value for MRI alone (P = 0.0043) (Fig. 2).
Figure 2.
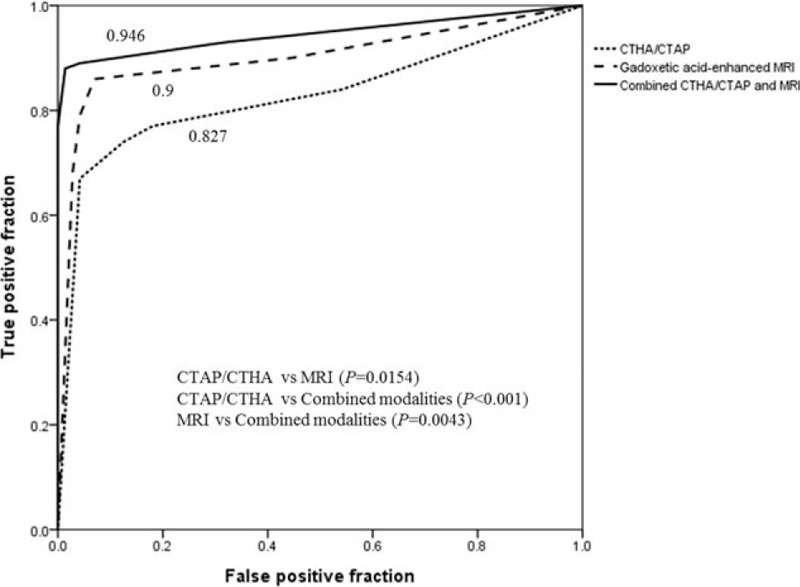
The graph shows the pooled ROC curves (Az) of two observers for each imaging modality. The pooled Az for detecting HCC by gadoxetic acid-enhanced MRI is 0.9 (95% CI, 0.85–0.951); by CTAP/CTHA, 0.827 (95% CI, 0.763–0.891); and by the combined modalities, 0.946 (95% CI, 0.91–0.982). The differences in pooled Az are statistically significant when each modality is compared with the combined modalities (both, P < 0.005). CI = confidence interval, CTAP/CTHA = computed tomography (CT) during arterial portography/CT during hepatic arteriography, HCC = hepatocellular carcinoma, MRI = magnetic resonance imaging, ROC = receiver operating characteristic.
3.4. Sensitivity and specificity
The pooled values of the individual observers for the 2 imaging modalities were analyzed and no significant difference was observed for sensitivity (74.5% [CT HA/AP] vs. 79.6% [MRI], P = 0.359). However, specificity tended to be higher in MRI than in CT HA/AP (97.6% vs. 92.7%, P = 0.077) (Table 3).
Table 3.
Sensitivity and specificity, according to lesion size, for the detection of 49 HCC and 82 non-HCC lesions.
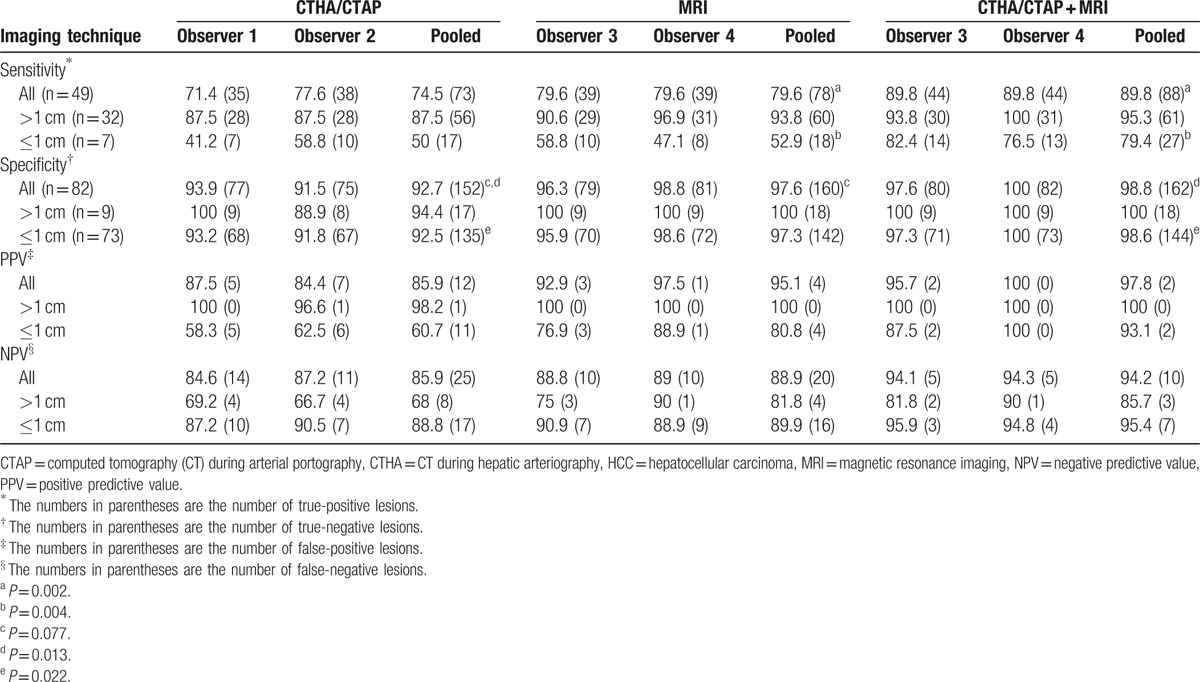
The diagnostic efficacies were further analyzed by size. No significant difference was noted for the sensitivity and specificity between the two modalities. However, when the CT HA/AP information was provided to the MRI observers, the diagnosis of small HCCs (≤1 cm) significantly improved: the sensitivity increased from 52.9% with MRI alone to 79.4% with the combination of MRI and CT HA/AP (P = 0.004).
3.5. False negative findings
CT HA/AP observers 1 and 2 recorded 14 and 11 false-negative lesions, respectively, whereas MRI observers 3 and 4 recorded 10 false-negative lesions each (Table 3). Most false-negative lesions were HCCs ≤1 cm. No observer identified 2 lesions that were ≤1 cm. Both lesions increased in size during the follow-up period. Among the false-negative lesions on CT HA/AP imaging, 9 HCC lesions were misdiagnosed by both observers as shunts or no lesion (Fig. 3). On MRI, 6 HCC lesions were falsely diagnosed by both MRI observers, owing to the lack of hypervascularity, whereas another HCC lesion was mistaken because of indistinct washout in transient phase. Of the 6 HCCs that were missed by MRI alone, 4 lesions were correctly diagnosed as HCC when CT HA/AP findings were additionally provided (Fig. 4).
Figure 3.
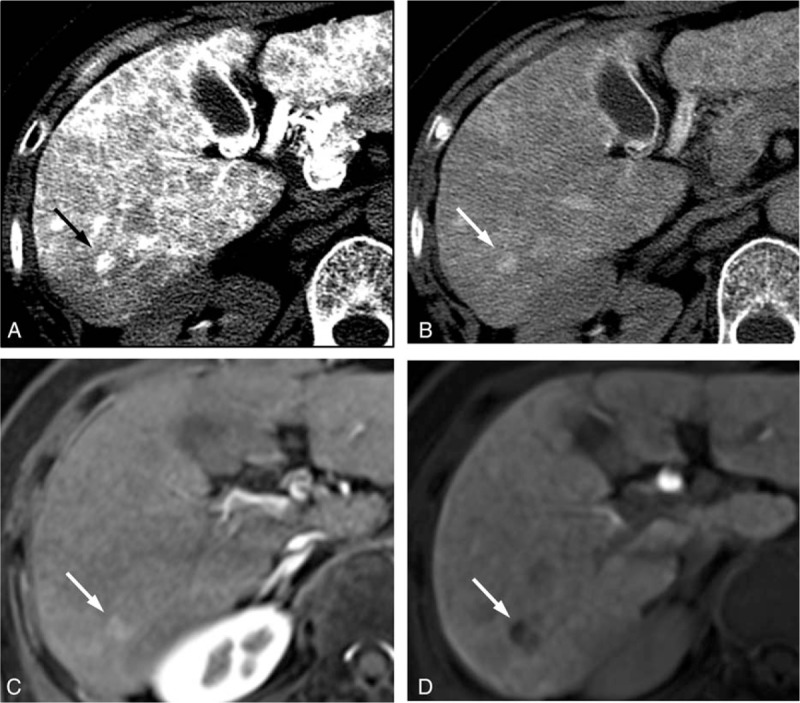
The CT HA/AP and MR images of a 64-year-old woman with a 1.1 cm HCC. A hypervascular nodule (arrow) was observed in the (A) early-phase of CTHA and remained hypervascular without corona enhancement in the (B) late phase of CTHA. The gadoxetic acid-enhanced MR images show (C) a hypervascular nodule (arrow) during the arterial phase and (D) hypovascular nodule (arrow) in the hepatobiliary phase. This nodule was correctly interpreted as HCC by MRI observers but as shunt by both CT HA/AP observers. CTHA = CT during hepatic arteriography, CT HA/AP = computed tomography during hepatic arteriography and arterial portography, HCC = hepatocellular carcinoma, MR = magnetic resonance, MRI = magnetic resonance imaging.
Figure 4.
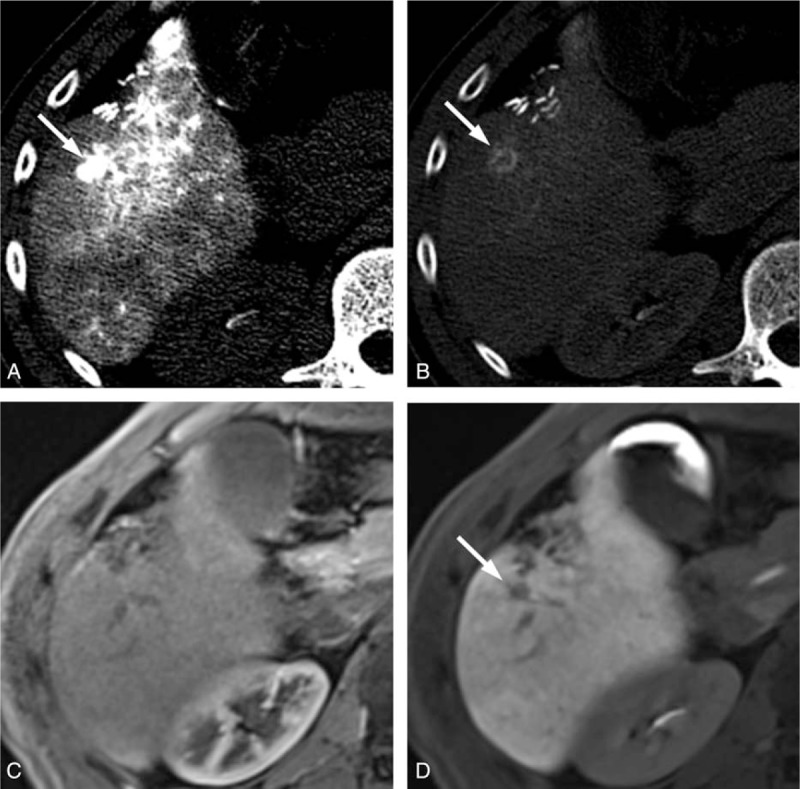
The CT HA/AP and MR images of a 48-year-old man with a 1 cm HCC. The CTHA image shows (A) a hypervascular nodule (arrow) in the early phase and (B) corona enhancement (arrow) in the late-phase. This lesion is (C) isointense on the gadoxetic acid-enhanced MRI during the arterial phase and (D) hypovascular (arrow) in the hepatobiliary phase. In the first interpretation session, the CT HA/AP reviewers diagnosed this lesion as HCC but the MRI reviewers missed this lesion. It was correctly diagnosed as HCC after additional review of the CT HA/AP images in the second interpretation session. CTHA = CT during hepatic arteriography, CT HA/AP = computed tomography during hepatic arteriography and arterial portography, HCC = hepatocellular carcinoma, MR = magnetic resonance, MRI = magnetic resonance imaging.
3.6. False positive findings
There were 5 and 7 non-HCC lesions that were misdiagnosed as HCC by CT HA/AP observer 1 and 2, respectively, most of which were ≤1 cm (Table 3). False-positive lesions noted by observer 1 were all attributed to arterioportal shunts (Fig. 5) whereas those by observer 2 included 2 hemangiomas. Both MRI observer 3 and 4 misdiagnosed 1 lesion as HCC, whereas MRI observer 3 diagnosed 2 additional false-positive lesions (all, ≤1 cm). All false-positive lesions were attributed to arterioportal shunts that showed hypervascularity in the arterial phase with subtle hypointensity in the HBP phase. When CT HA/AP image data were provided, 1 of the 2 nodules was diagnosed as benign by MRI observer 3, whereas 1 nodule that had been misdiagnosed by both observers was correctly diagnosed as benign by observer 4 but not by observer 3 (Fig. 6).
Figure 5.
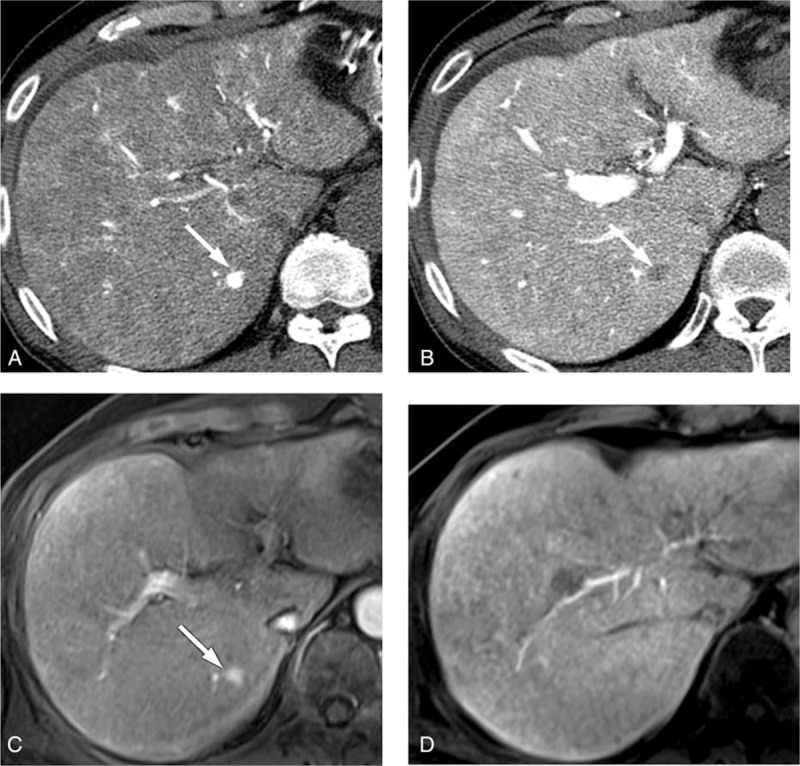
The CT HA/AP and MR images of a 69-year-old man with a 1 cm arterioportal shunt. The CTHA image shows (A) a hypervascular nodule (arrow) in the early phase and (B) the CTAP image shows a perfusion defect (arrow). The gadoxetic acid-enhanced MR images show (C) a hypervascular nodule (arrow) during the arterial phase, but (D) the lesion is not clearly defined in the hepatobiliary phase. This nodule was interpreted as HCC by both CT HA/AP observers but as a shunt by the MRI observers. CTAP = CT during arterial portography, CTHA = CT during hepatic arteriography, CT HA/AP = computed tomography during hepatic arteriography and arterial portography, HCC = hepatocellular carcinoma, MR = magnetic resonance, MRI = magnetic resonance imaging.
Figure 6.
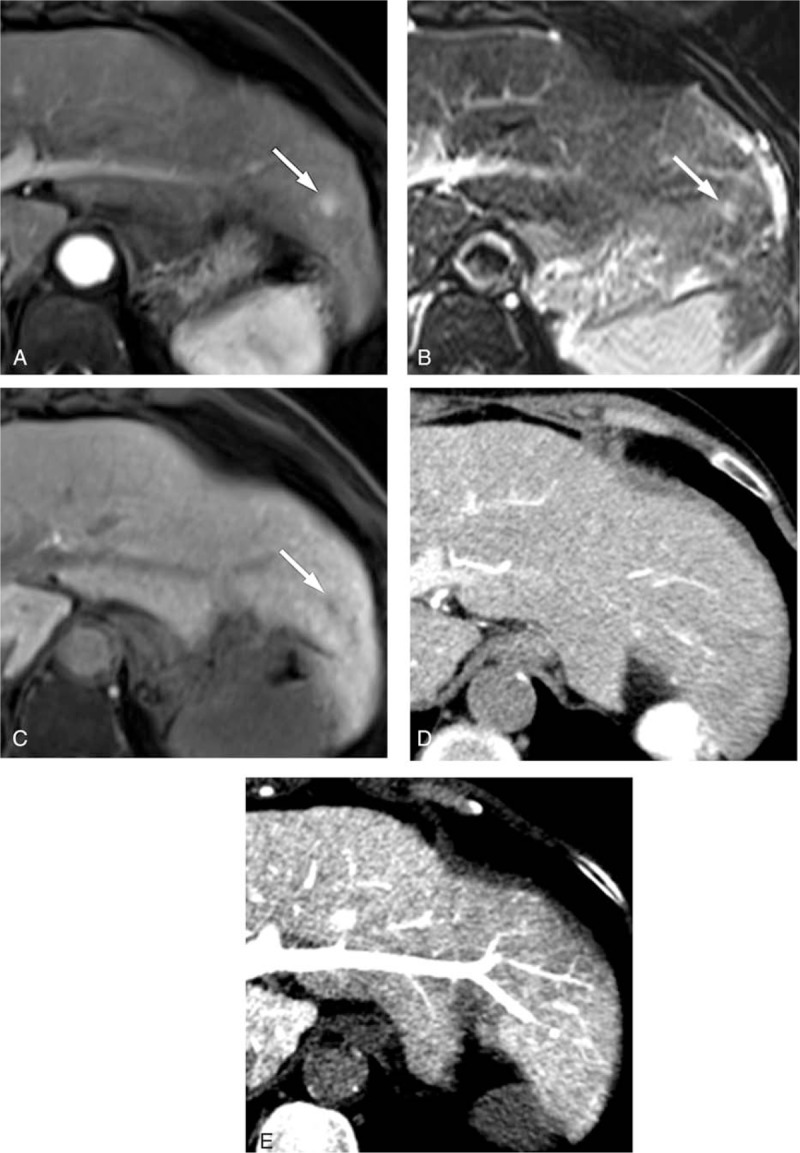
The CT HA/AP and MR images of a 71-year-old woman with a 1 cm arterioportal shunt. The gadoxetic acid-enhanced MR image shows (A) a hypervascular nodule (arrow) during the arterial phase and (B) an equivocal hyperintensity (arrow) on the T-2 weighted image, and (C) a perfusion defect (arrow) in the hepatobiliary phase. However, the hypervascular nodule is not visible in (D) the CTHA image or (E) the CTAP image. The false-positive result was correctly diagnosed as a shunt by one of the MRI observers in the second interpretation session. CTAP = CT during arterial portography, CTHA = CT during hepatic arteriography, CT HA/AP = computed tomography during hepatic arteriography and arterial portography, MR = magnetic resonance, MRI = magnetic resonance imaging.
3.7. Interobserver agreement
The κ value was higher for the MRI observers than for the CT HA/AP observers (κ = 0.858 and 0.739, respectively) (Table 4).
Table 4.
Agreement between the observers regarding the presence or absence of HCC.

4. Discussion
The present study compared the diagnostic accuracy of gadoxetic acid-enhanced MRI with that of CT HA/AP for small HCCs less than 2 cm. Gadoxetic acid-enhanced MRI is widely used and reportedly has the best diagnostic efficacy than any other diagnostic tools,[12,13,16] whereas CT HA/AP is most sensitive in detecting hypervascular lesions.[7,17] To our knowledge, this is the first study comparing the diagnostic accuracy of gadoxetic acid-enhanced MRI and CT HA/AP head to head, focusing on hypervascular small HCCs only. Hypovascular lesions were excluded because the diagnosis of hypovascular HCC based on imaging criteria alone is currently not feasible on account of its low specificity.
Our data revealed that MRI alone can diagnose hypervascular HCCs ≤2 cm with a higher diagnostic accuracy than CT HA/AP alone (Az, 0.9 vs. 0.827) with 100% specificity for HCCs between 1 and 2 cm in diameter. These results provide the evidence for using MRI alone as a diagnostic tool in institutes where the CT HA/AP modality is unavailable. However, the confirmative diagnosis of HCC based on the single modality of MRI is applicable to HCCs >1 cm, but a different approach is required for HCCs ≤1 cm.
Despite the inclusion of only hypervascular lesions, the diagnosis of HCC ≤1 cm by gadoxetic acid-enhanced MRI alone was insufficient: the sensitivity was only 52.9%, which was definitely lower than the sensitivity in detecting HCC >1 cm (93.8%). The sensitivity for diagnosing HCC ≤1 cm may inevitably be low because early HCCs may not have a dominant arterial blood supply while it is still being supplied with portal blood, thereby resulting in insufficient arterial hypervascularization and subtle delayed washout. A conclusive diagnosis of HCC is difficult when this phenomenon occurs, which implies that a more sensitive diagnostic method should be applied. Detecting early stage HCC is important because a cure is expected in such patients. The role of CT HA/AP imaging could be emphasized in these patients because the degree of arterial enhancement is higher with CT HA/AP than with dynamic MRI.
Our study results demonstrated that the diagnostic efficacy of HCC was significantly increased by the combination of gadoxetic acid-enhanced MRI and CT HA/AP images than when using each diagnostic modality alone. The sensitivity in diagnosing HCCs ≤1 cm remarkably increased from 52.9% with MRI alone to 79.4% with the combined modalities and a considerably high specificity (98.6%) was achieved. This finding suggests that the diagnostic confidence may be increased by the combined use of CT HA/AP in the cases of subtle or no arterial enhancement with MRI alone.
There are some limitations of this study. It had a retrospective design and selection bias was therefore unavoidable. Furthermore, the confirmation of diagnosis with liver histology was not obtained for many cases. However, to overcome these limitations, patients without a conclusive diagnosis of HCC ≤1 cm were followed up with imaging studies for at least 1 year.
In conclusion, gadoxetic acid-enhanced MRI has better diagnostic efficacy in detecting and characterizing small (≤2 cm) hypervascular HCCs, compared with CT HA/AP. However, for diagnosing very small HCCs (≤1 cm), MRI and CT HA/AP are complementary and can increase the detection rate of HCC when used simultaneously. Therefore, combined modalities can be recommended for the evaluation of minute hypervascular HCCs.
Footnotes
Abbreviations: CT HA/AP = computed tomography during hepatic arteriography and arterial portography, HCC = hepatocellular carcinoma, MRI = magnetic resonance imaging, ROC = receiver operating characteristic, TACE = transarterial chemoembolization.
SYY and BJP have contributed equally to the article.
This study was supported by a grant from the Korea Liver Cancer Association.
The authors have no conflicts of interest to disclose.
References
- 1.Cancer Facts and Figures 2015. American Cancer Society. 2015. [Google Scholar]
- 2.http://globocan.iarc.fr/ 2012. [Google Scholar]
- 3.European Association For The Study Of The Liver, European Organisation For Research Treatment of Cancer. EASL-EORTC clinical practice guidelines: management of hepatocellular carcinoma. J Hepatol 2012; 56:908–943. [DOI] [PubMed] [Google Scholar]
- 4.El-Serag HB. Hepatocellular carcinoma. N Engl J Med 2011; 365:1118–1127. [DOI] [PubMed] [Google Scholar]
- 5.Bruix J, Sherman M. American Association for the Study of Liver Diseases. Management of hepatocellular carcinoma: an update. Hepatology 2011; 53:1020–1022. [DOI] [PMC free article] [PubMed] [Google Scholar]
- 6.Tsurusaki M, Sugimoto K, Fujii M, et al. Combination of CT during arterial portography and double-phase CT hepatic arteriography with multi-detector row helical CT for evaluation of hypervascular hepatocellular carcinoma. Clin Radiol 2007; 62:1189–1197. [DOI] [PubMed] [Google Scholar]
- 7.Pugacheva O, Matsui O, Kozaka K, et al. Detection of small hypervascular hepatocellular carcinomas by EASL criteria: comparison with double-phase CT during hepatic arteriography. Eur J Radiol 2011; 80:e201–e206. [DOI] [PubMed] [Google Scholar]
- 8.Ichikawa T, Saito K, Yoshioka N, et al. Detection and characterization of focal liver lesions: a Japanese phase III, multicenter comparison between gadoxetic acid disodium-enhanced magnetic resonance imaging and contrast-enhanced computed tomography predominantly in patients with hepatocellular carcinoma and chronic liver disease. Invest Radiol 2010; 45:133–141. [DOI] [PubMed] [Google Scholar]
- 9.Ahn SS, Kim MJ, Lim JS, et al. Added value of gadoxetic acid-enhanced hepatobiliary phase MR imaging in the diagnosis of hepatocellular carcinoma. Radiology 2010; 255:459–466. [DOI] [PubMed] [Google Scholar]
- 10.Sun HY, Lee JM, Shin CI, et al. Gadoxetic acid-enhanced magnetic resonance imaging for differentiating small hepatocellular carcinomas (< or = 2 cm in diameter) from arterial enhancing pseudolesions: special emphasis on hepatobiliary phase imaging. Invest Radiol 2010; 45:96–103. [DOI] [PubMed] [Google Scholar]
- 11.Park G, Kim YK, Kim CS, et al. Diagnostic efficacy of gadoxetic acid-enhanced MRI in the detection of hepatocellular carcinomas: comparison with gadopentetate dimeglumine. Br J Radiol 2010; 83:1010–1016. [DOI] [PMC free article] [PubMed] [Google Scholar]
- 12.Sano K, Ichikawa T, Motosugi U, et al. Imaging study of early hepatocellular carcinoma: usefulness of gadoxetic acid-enhanced MR imaging. Radiology 2011; 261:834–844. [DOI] [PubMed] [Google Scholar]
- 13.Ooka Y, Kanai F, Okabe S, et al. Gadoxetic acid-enhanced MRI compared with CT during angiography in the diagnosis of hepatocellular carcinoma. Magn Reson Imaging 2013; 31:748–754. [DOI] [PubMed] [Google Scholar]
- 14.Chakraborty DP, Winter LH. Free-response methodology: alternate analysis and a new observer-performance experiment. Radiology 1990; 174:873–881. [DOI] [PubMed] [Google Scholar]
- 15.Cohen J. Weighted kappa: nominal scale agreement with provision for scaled disagreement or partial credit. Psychol Bull 1968; 70:213–220. [DOI] [PubMed] [Google Scholar]
- 16.Hammerstingl R, Huppertz A, Breuer J, et al. Diagnostic efficacy of gadoxetic acid (Primovist)-enhanced MRI and spiral CT for a therapeutic strategy: comparison with intraoperative and histopathologic findings in focal liver lesions. Eur Radiol 2008; 18:457–467. [DOI] [PubMed] [Google Scholar]
- 17.Kim SR, Ando K, Mita K, et al. Superiority of CT arterioportal angiography to contrast-enhanced CT and MRI in the diagnosis of hepatocellular carcinoma in nodules smaller than 2 cm. Oncology 2007; 72 suppl 1:58–66. [DOI] [PubMed] [Google Scholar]


