

Abstract
Background:
It is increasingly being recognized that alterations of the GABAergic system are implicated in the pathophysiology of depression. This study aimed to explore in vivo gamma-aminobutyric acid (GABA) levels in the anterior cingulate cortex/medial prefrontal cortex (ACC/mPFC) and posterior-cingulate cortex (PCC) of postmenopausal women with depression using magnetic resonance spectroscopy (1H-MRS).
Methods:
Nineteen postmenopausal women with depression and thirteen healthy controls were enrolled in the study. All subjects underwent 1H-MRS of the ACC/mPFC and PCC using the “MEGA Point Resolved Spectroscopy Sequence” (MEGA-PRESS) technique. The severity of depression was assessed by 17-item Hamilton Depression Scale (HAMD). Quantification of MRS data was performed using Gannet program. Differences of GABA+ levels from patients and controls were tested using one-way analysis of variance. Spearman correlation coefficients were used to evaluate the linear associations between GABA+ levels and HAMD scores, as well as estrogen levels.
Results:
Significantly lower GABA+ levels were detected in the ACC/mPFC of postmenopausal women with depression compared to healthy controls (P = 0.002). No significant correlations were found between 17-HAMD/14-HAMA and GABA+ levels, either in ACC/mPFC (P = 0.486; r = 0.170/P = 0.814; r = −0.058) or PCC (P = 0.887; r = 0.035/ P = 0.987; r = −0.004) in the patients; there is also no significant correlation between GABA+ levels and estrogen levels in patients group (ACC/mPFC: P = 0.629, r = −0.018; PCC: P = 0.861, r = 0.043).
Conclusion:
Significantly lower GABA+ levels were found in the ACC/mPFC of postmenopausal women with depression, suggesting that the dysfunction of the GABAergic system may also be involved in the pathogenesis of depression in postmenopausal women.
Keywords: depression, GABA+, HAMD/HAMA, MEGA-PRESS, postmenopausal
1. Introduction
The psychological complications are becoming more significant and common in postmenopausal women with the increase of postmenopausal periods.[1,2] For example, depression is widespread[3,4] and associated with functional disability and decreased quality of life in postmenopausal women.[5] Several studies, including animal models and clinical observations in women, indicate that the low-estrogen state may be related to depression.[6,7] Therefore, clinical trials have been performed in postmenopausal women using estrogen or estrogen-associated therapies; however, observed effects have been inconsistent.[8–10] Moreover, investigations have indicated that the use of hormone therapy was associated with endometrial hyperplasia and cancer[11] and may increase the risk of dementia and coronary heart disease.[12,13] As mentioned above, the risks of estrogen usage have been reevaluated, particularly in older women. Thus, there is an increased interest in biochemical factors, such as neurotransmitter systems.
Gamma-aminobutyric acid (GABA) is the main inhibitory neurotransmitter in the central nervous system (CNS). It is increasingly being recognized that alterations of the GABAergic system are implicated in the pathophysiology of depression.[14,15] Moreover, studies have suggested that the normalization of cerebral GABA deficits is associated with positive treatment effects in depression.[16–18] Many studies have detected changes in GABA-inhibitory function during the menstrual cycle,[19] pregnancy,[20] and postpartum,[21] using methods including proton magnetic resonance spectroscopy (1H-MRS), transcranial magnetic stimulation, and cerebrospinal fluid (CSF) analysis. However, there is little information on cerebral GABA levels in postmenopausal women with depression.
1H-MRS methods permit researchers to noninvasively quantify brain metabolites, such as N-acetyl-aspartate (NAA), myo-inositol (mI), choline (Cho), glutamate-glutamine (Glx), total creatine (TCr), and lactate (Lac). However, detection of GABA using the conventional 1H-MRS is limited due to its relatively low concentration and the spectral overlap of signals from other major metabolites.[22] An advanced MRS method, MEscher-GArwood Point RESolved Spectroscopy (MEGA-PRESS)[23] has been used to detect GABA levels in the healthy brain and various psychiatric diseases.[24–26] Herein, we explore the cerebral GABA levels in postmenopausal women using the edited MRS technique MEGA-PRESS. The present study hypothesized that the GABA levels would be lower in postmenopausal women with depression.
2. Materials and methods
2.1. Participants
Nineteen postmenopausal women suffering from depression and 13 healthy postmenopausal women who were age-, body index- and educationally matched controls participated in this study. This study was approved by the local ethical committee, and all participants provided written informed consent before the initiation of the study. The 13 healthy controls (HCs) were self-referred in response to fliers or paid advertising. The patients were recruited through the outpatient departments of Mental Psychology and Gynecology of the No. 2 Affiliated Hospital of Shandong Traditional Chinese Medicine and Shandong University Medical Center. Each woman was given the MINI-International Neuropsychiatric Interview for Axis I disorders. Both patients and HCs had no current or past personal or family history of any Axis I disorder. The 19 postmenopausal women had to meet the ICD-10 criteria[27] for depression (code: F32.0, 32.1). The symptomatic severity of depression was assessed by 17-item Hamilton Depression Scale (HAMD),[28] a standard measure for current symptoms of depression. The 14-item Hamilton Anxiety Scale[29] was also performed simultaneously. Two trained neuropsychologists, blinded to the magnetic resonance imaging (MRI) data, performed the tests on all the subjects.
All the participants were required to be at least 2 years past the cessation of menses to ensure stabilization of low estrogen values.[30] Other inclusion criteria for the 2 groups were intact uterus; natural menopause at least 2 to 8 years and no subjective complaints of hot flushes[31,32]; absence of previous history of psychiatric disorders, endocrine and metabolic illnesses; at least 6 months free of drugs (i.e., psychotropic medication, antidepressants, hormones) and alcohol abuse; and no major ischemic vascular disease (e.g., cerebral ischemic stroke, subcortical arteriosclerotic encephalopathy) diagnosed by conventional brain MRI. All subjects underwent thorough medical examination and laboratory test (including estrogen levels), and no positive results were observed that would necessitate medical interventions.
2.2. MRI/MRS study protocol
All MRI/MRS experiments were performed on a 3.0 Tesla (T) scanner (Philips “Achieva” TX, Best, The Netherlands) equipped with an 8-channel phased-array head coil. Prior to the MRS examination, T1-weighted 3-dimensional (3D) turbo field echo images were used for localization, and the scan parameters were as follows: TR (repetition time) = 8.1 ms; TE (echo time) = 3.7 ms; slice thickness = 1 mm; matrix: 256 × 256; field of view = 24 × 24 cm2; and flip angle = 8°. The MRS voxels were set on anterior cingulate cortex/medial prefrontal cortex (ACC/mPFC; 3 × 3 × 3 cm3) and posterior cingulate cortex (PCC; 3 × 2 × 3 cm3) (Fig. 1) that are the regions associated with depression.[33,34] The median sagittal plane was selected as a reference slice for voxel localization: the voxel in the ACC/mPFC was prescribed superior to the genu of the corpus callosum, aligned with the long axis of the corpus callosum knee, and positioned on the medial aspect of the axial plane; the voxel in the PCC was prescribed posterior and superior to the splenium of the corpus callosum, aligned with its tangent, and positioned again on the medial aspect of the axial plane. Both voxels were positioned in a manner such as to avoid the lateral ventricle and skull.
Figure 1.
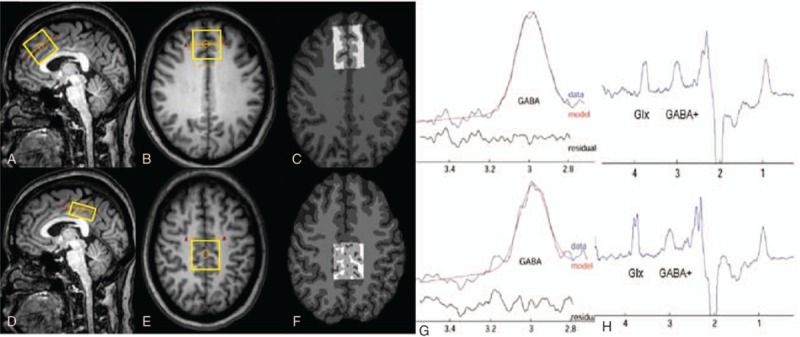
Magnetic resonance spectroscopy voxel placement and resulting spectra. T1-weighted turbo field echo images show single-voxel placements centered on the ACC/mPFC in the sagittal (A), axial (B) projections and on the PCC in the sagittal (D), axial (E) projections. The corresponding results of brain segmentation are shown in the ACC/mPFC (C) and PCC (F). (G, H) Representative MEGA-PRESS spectra processed using the “Gannet 2.0” toolkit in ACC/mPFC and PCC of postmenopausal women with depression. (G) The curve-fitting of the GABA peak using Gannet, the red lines in the panels are the results of the GannetFit curve-fitting, the blue lines show the postphase and frequency aligned GABA data, and the black line is the residual difference between the experimental data and the curve-fit. (H) MEGA-PRESS difference spectrum. The GABA+ and macromolecules’ peaks resonate at 3.01 and 0.9 ppm, respectively. ACC/mPFC = anterior cingulate cortex/medial prefrontal cortex, GABA = gamma-aminobutyric acid, MEGA-PRESS = MEscher-GArwood Point RESolved Spectroscopy, PCC = posterior cingulate cortex.
The MEGA-PRESS sequence[23] was used for GABA editing, with the following parameters: TR = 2000 ms; TE = 68 ms; 320 signal averages; acquisition bandwidth = 1000 Hz; and scan duration 8 min 48 s. J-evolution for GABA was refocused during the odd-numbered acquisitions (ON) but not during the even numbered acquisitions (OFF) by applying Gaussian inversion pulse to the 3CH2 resonance of GABA at 1.9 ppm (ON) and at 7.5 ppm, symmetrically about the water peak (OFF), respectively. Water suppression was carried out using chemical shift selective suppression pulses after automatic optimization. FASTMAP shimming of the volume of interest (VOI) was conducted automatically prior to each acquisition. Eight averages of the unsuppressed water signal were obtained for quantification. The difference between “ON” and “OFF” spectra provided an edited spectrum of GABA. The signal detected at 3 ppm with these parameters and the MEGA-PRESS technique is known to contain contributions from both the macromolecules (MM) and homocarnosine,[35] as well as GABA, and hence, the detected signal is referred to as GABA+. Quantification was performed using “Gannet” (GABA-MRS Analysis Tool) in Matlab 2010b (Mathworks) with Gaussian curve-fitting to the GABA+ peaks.[36,37] Exponential line broadening of 3 Hz was applied. Gannet provides the standard deviation (SD) of the fitting residues divided by the amplitude of the fitted peaks, generating the overall fitting error which reflects the quality of the data. Only spectra with a relative fitting error of GABA+ below 10% were included in the statistical analysis.
2.3. VOI segmentation
Different voxel proportions of gray matter (GM), white matter (WM), and CSF in 1H-MRS may confound group differences in metabolite measurement. To determine if the differences in the tissue composition of the subjects from both the groups could account for differences in GABA+ levels, each MRS voxel was segmented as GM, WM, or CSF using the 3D T1-weighted brain images and the automatic brain segmentation program (Fig. 1), FAST (FMRIB's automated segmentation tool) in the FSL package (Oxford University, Oxford, UK).[38] The VOIs were co-registered to the anatomical images using the “Re-creation of VOI” Matlab tool.[39] Tissue GM fractions were obtained by calculating the ratio of GM volume to the GM + WM volumes in the VOIs. The concentration of GABA in CSF was considered to be negligible.[40]
2.4. Statistical analysis
Statistical analyses were conducted using the Statistical Package for Social Sciences software (SPSS 17.0). MRS data, normally distributed, were presented as mean ± SD values. The differences of GABA+ levels from patients and controls were tested using 1-way analysis of variance. Spearman correlation coefficients were used to evaluate the linear associations between GABA+ levels and HAMD/HAMA scores, as well as estrogen levels. All statistical tests were 2-sided and the level of significance was set at P < 0.05.
3. Results
3.1. Demographic characteristics of study subjects
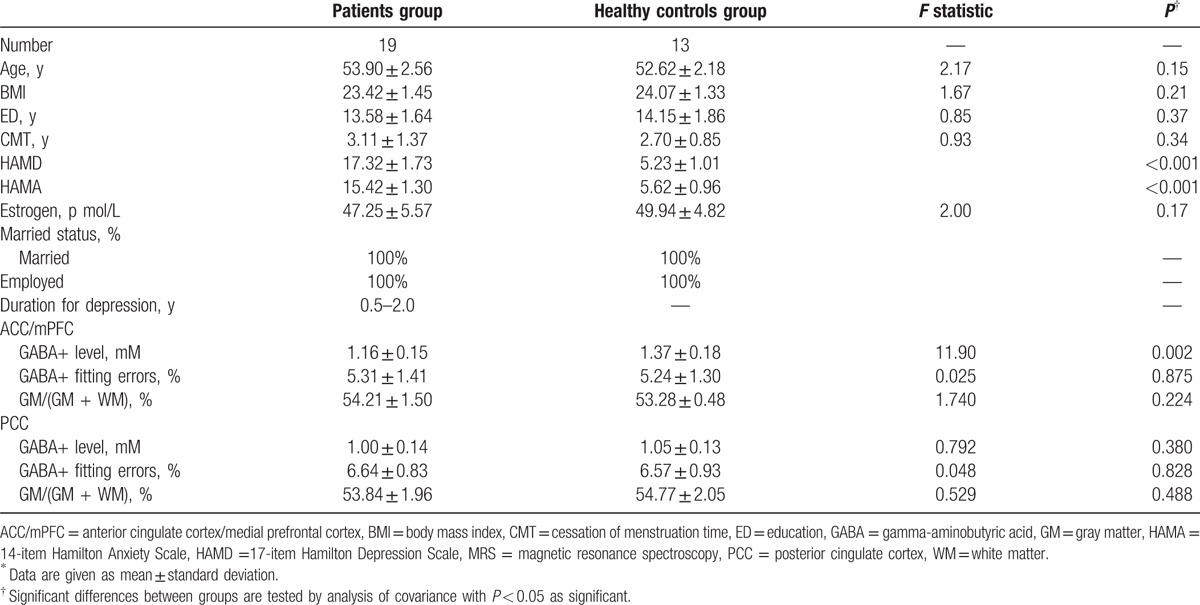
The demographic information and results of the 17-HAMD/14-HAMA of all subjects are presented in Table 1. There was no difference in age (P = 0.15), cessation of menstruation time (P = 0.34), hormone estrogen levels (P = 0.17), body index (P = 0.21), and educational background (P = 0.37) between the 2 groups. The scores of the patient group on the 17-HAMD and 14-HAMA (range 15–21, mean = 17.32 ± 1.73 and range 14–19, mean = 15.42 ± 1.30, respectively) are significantly higher than the HC group (range 4–7, mean = 5.23 ± 1.01 and range 3–6, mean = 5.62 ± 0.96, respectively) (P < 0.001). According to the scores, the patients fulfilled criteria for mild-to-moderate depression.
Table 1.
Demographic, MRS, and segmentation data∗ of postmenopausal women with patients group and healthy controls group.
3.2. VOI segmentation results
The mean GM tissue fraction GM/(GM + WM) in the patient group was 54.21 ± 1.50% and 53.84 ± 1.96% in the ACC/mPFC region and the PCC, respectively, and 53.28 ± 0.48% and 54.77 ± 2.05%, respectively, in HCs (Table 1). There were no significant difference in GM fraction of the VOIs between the 2 groups (ACC/mPFC: F(1, 30) = 1.740, P = 0.224; P = 0.224; PCC: F(1, 30) = 0.529, P = 0.488).
3.3. Comparisons of GABA+ levels between the 2 groups
Edited spectra were successfully obtained from the ACC/mPFC region and the PCC region in all the 32 subjects (19 patients and 13 HCs), and the fitting error of GABA+ in each spectrum was below 10%. Significantly lower GABA+ levels were found in ACC/mPFC region of the patients, relative to HCs (F(1, 30) = 11.901, P = 0.002). Slightly lower mean GABA+ levels were also found in the PCC region (1.00 ± 0.14) of the patients group as compared to the HCs (1.05 ± 0.13), but did not reach statistical significance (F(1, 30) = 0.792, P = 0.380) (Table 1; Fig. 2). The mean GABA+ fitting error was 5.31% and 6.64% for ACC/mPFC and PCC voxels, respectively, in the patients group, and 5.24% and 6.57% for HCs group (Table 1), with no significant differences between the groups (ACC/mPFC: F(1, 30) = 0.025, P = 0.875; PCC: F(1, 30) = 0.048, P = 0.828).
Figure 2.
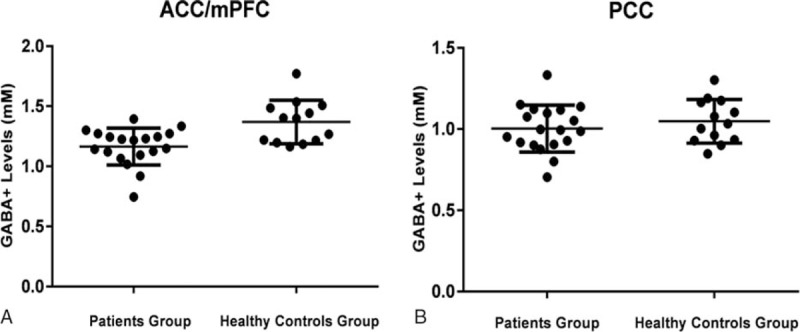
The GABA+ levels of depression patients and healthy control in ACC/mPFC (A) and PCC (B) regions. The mean and standard deviation of GABA+ levels (mM) are displayed. (A) GABA+ levels of patients group are significantly decreased in the ACC/mPFC (P = 0.002). (B) Mean GABA+ levels are lower in patients group than in healthy controls groups in PCC (P = 0.380), but no statistically significant difference is detected. ACC/mPFC = anterior cingulate cortex/medial prefrontal cortex, GABA = gamma-aminobutyric acid, PCC = posterior cingulate cortex.
3.4. Correlation between GABA+ levels and the results of 17-HAMD/14-HAMA
The scores of 17-HAMD/14-HAMA were evaluated in all subjects. No significant correlations were found between 17-HAMD/14-HAMA and GABA+ levels, either in ACC/mPFC (P = 0.486; r = 0.170/P = 0.814; r = −0.058) or PCC (P = 0.887; r = 0.035/P = 0.987; r = −0.004) in the patients group. Also, with regard to the correlation of 17-HAMD/14-HAMA scores and GABA+ levels in HCs group, no statistical correlation was detected (ACC/mPFC: P = 0.337; r = 0.290/P = 0.584; r = 0.168; PCC: P = 0.667; r = 0.132/P = 0.716; r = −0.112).
3.5. Correlation between GABA+ levels and estrogen levels
Significant correlations could not be established between GABA+ levels and estrogen levels, either in the patients group (ACC/mPFC: P = 0.629, r = −0.118; PCC: P = 0.861, r = 0.043) or in the HCs group (ACC/mPFC: P = 0.471, r = 0.220; PCC: P = 0.415, r = 0.247).
4. Discussion
The key outcome of this study is that significantly decreased GABA+ levels are present in the ACC/mPFC region of postmenopausal women suffering from depression, as compared to HC subjects. As the main inhibitory neurotransmitter in the CNS, GABA is mainly localized to inhibitory neurons,[41] critically influencing the prefrontal cortical and ACC function.[42,43] Therefore, the reduced GABA+ level could indicate either loss or dysfunction of GABAergic neurons in postmenopausal women with depression. Our findings are consistent with the previous studies, which detected reduced GABA levels in the anterior cingulate, the dorsomedial prefrontal cortex, and the dorsal anterolateral prefrontal cortex in depressed patients.[44,45] Moreover, normalization of GABA levels in the brain by treatment with selective serotonin reuptake inhibitors or electroconvulsive therapy was associated with the improvement of depression,[16,17,46] which further implied that our findings of reduced GABA+ levels may be involved in the pathogenesis of depression in postmenopausal women.
As mentioned above, the deficiency of GABA+ levels may be either due to GABAergic neuronal loss or dysfunction. If due to dysfunction, either GABA synthesis itself or enzymatic deficiency in glutamate/glutamine cycling may be the plausible cause.[47] Postmortem studies exhibited reduced glutamate decarboxylase (GAD) in the prefrontal cortex of patients with depression.[48] Furthermore, animal models of depression indicated that glutamate/GABA-glutamine cycling was decreased.[49] On the other hand, the alterations in density or size of neuron and glial-cell may be involved in the decreased GABA levels in a postmenopausal woman with depression. Previous studies suggested that the size or density of neurons in depressed patients was reduced compared to the HCs in the dorsolateral prefrontal cortex, occipital cortex, and ACC. This further indicated that the decreased levels of GAD-67 may be consistent with the reduced densities and size of calbindin-positive GABAergic interneurons in major depressive disorders.[50,51] However, the underlying mechanisms need to be elucidated in future studies.
Around the time of final menstrual period, the levels of estrogen gradually decline with the aging of the ovarian function and then is stable in the early stage of postmenopause.[30,52] Studies suggested that the basal number of GAD65-immunoreactive cells decreased in rats after long-term ovariectomy.[53] Moreover, several reports indicated that estrogen and progesterone differentially regulated the GABAergic system; for example, Weiland established that mRNA expression of GAD in the hippocampus (HPC) was stimulated by estradiol administration in ovariectomized rats and suppressed by the addition of progesterone[54]; while another study indicated that estradiol decreased the expression of GAD in hippocampal neurons within 24 h, thus overall increasing the excitatory drive.[55] In addition, estrogen plus progesterone attenuated GAD gene expression in the HPC and amygdala (AMD), but not in the medial basal hypothalamus (MBH); while the GABA receptor subunit gene expression was generally higher in the AMD and HPC than in the MBH.[56] Taken together, the deficient GABA+ levels may be an appropriate adapted response for the postmenopausal stage, which may cause a change in behavior and emotion in certain postmenopausal women. Furthermore, the lack of relationship between GABA+ levels and the estrogen levels in patients group may be partially explained by the differential hormonal regulation of the GAD and GABA receptor expression. There is also no significant correlation between the scores assessed by 17-HAMD/14-HAMA and cerebral GABA+ levels, which is consistent with previous studies.[44,57] It is well known that depression is a multifactor disease, influence socially and psychologically influences. Therefore, a deeper insight is essential for elucidating the underlying mechanism of depression, GABAergic system, and hormones in postmenopausal women.
There are several limitations to our studies. First, the sample size of 19 in postmenopausal women with mild-to-moderate depression and 13 healthy postmenopausal women is rather small for a clinical study of this kind, and so, the present results should be viewed as preliminary. Further studies with a larger sample size will be indispensable to confirm the current results. It is possible that the lack of significant difference in estrogen levels between the 2 groups and GABA+ levels in the PCC is due to the small sample size and limited statistical power. Secondly, the severity of depression in postmenopausal women in our study is mild-to-moderate, not including those with severe depression. It also might be one of the factors for the lack of correlations between GABA+ levels and the scores of 17-HAMD/14-HAMA or estrogen levels. Therefore, further study including patients with severe major depression will be performed to evaluate this correlation. Thirdly, similar to our previous study,[37] the voxel volume was relatively large (3 × 3 × 3 cm3; 3 × 3 × 2 cm3) due to the low intensity of the GABA+ signal. Examination of other brain regions will be obligatory to determine whether GABA abnormalities are specific to ACC/mPFC or more broadly distributed throughout the brain. GABA decrease previously reported in the plasma and CSF of the depressed patients[58,59] might suggest a broad distribution of reductions. In the future, a smaller-VOI MRS method could prove more efficient for region-specific analyses of brain GABA levels. Lastly, the MRS measure of GABA+ includes non-GABA contributions from co-edited MM and homocarnosine.
5. Conclusion
In summary, the decreased GABA+ levels were found in the ACC/mPFC of postmenopausal women with mild-to-moderate depression. Our findings suggest that the aberrant GABAergic system may also be involved in the pathogenesis of depression in postmenopausal women.
Footnotes
Abbreviations: ACC/mPFC = anterior cingulate cortex/medial prefrontal cortex, GABA = gamma-aminobutyric acid, HAMD/HAMA = 17-item Hamilton Depression Scale/14-item Hamilton Anxiety Scale, MEGA-PRESS = MEscher-GArwood Point RESolved Spectroscopy, PCC = posterior cingulate cortex.
This project was supported by the National Natural Science Foundation of China (grant no. 81371534) and the Shandong Provincial Natural Science Foundation of China (grant no. BS2015YY003). This study applies tools developed under NIH R01 EB016089 and P41 EB015909; RAEE also receives salary support from these grants.
The authors have no conflicts of interest to disclose.
References
- 1.Timur S, Sahin NH. The prevalence of depression symptoms and influencing factors among perimenopausal and postmenopausal women. Menopause 2010; 17:545–551. [DOI] [PubMed] [Google Scholar]
- 2.Clayton A, Guico-Pabia C. Recognition of depression among women presenting with menopausal symptoms. Menopause 2008; 15:758–767. [DOI] [PubMed] [Google Scholar]
- 3.Maartens LWF, Knottnerus JA, Pop VJ. Menopausal transition and increased depressive symptomatology: a community based prospective study. Maturitas 2002; 25:195–200. [DOI] [PubMed] [Google Scholar]
- 4.Pérez-López FR, Pérez-Roncero G, Fernández-Iñarrea J, et al. The MARIA (MenopAuse RIsk Assessment) Research Group. Resilience, depressed mood, and menopausal symptoms in postmenopausal women. Menopause 2014; 21:159–164. [DOI] [PubMed] [Google Scholar]
- 5.Judd LL, Akiskal HS. Delineating the longitudinal structure of depressive illness: beyond clinical subtypes and duration thresholds. Pharmacopsychiatry 2000; 33:3–7. [DOI] [PubMed] [Google Scholar]
- 6.Shariff S, Cumming CE, Lees A, et al. Mood disorder in women with early breast cancer taking tamoxifen, an estradiol receptor antagonist. An expected or unexpected effect? Ann N Y Acad Sci 1995; 761:365–368. [DOI] [PubMed] [Google Scholar]
- 7.Young EA, Midgley AR, Carlson NE, et al. Alteration in the hypothalamic-pituitary-ovarian axis in depressed women. Arch Gen Psychiatry 2000; 57:1157–1162. [DOI] [PubMed] [Google Scholar]
- 8.Saletu B, Brandstätter N, Metka M, et al. Double-blind, placebo-controlled, hormonal, syndromal and EEG mapping studies with transdermal oestradiol therapy in menopausal depression. Psychopharmacology 1995; 122:321–329. [DOI] [PubMed] [Google Scholar]
- 9.Whooley MA, Grady DMD, Cauley JA. Postmenopausal estrogen therapy and depressive symptoms in older women. J Gen Intern Med 2000; 15:535–541. [DOI] [PMC free article] [PubMed] [Google Scholar]
- 10.Morrison MF, Kalan MJ, Ten Have T, et al. Lack of efficacy of estradiol for depression in postmenopausal women: a randomized, controlled trial. Biol Psychiatry 2004; 55:406–412. [DOI] [PubMed] [Google Scholar]
- 11.Grady D, Gebretsadik T, Kerlikowske K, et al. Hormone replacement therapy and endometrial cancer risk: a meta-analysis. Obstet Gynecol 1995; 85:304–313. [DOI] [PubMed] [Google Scholar]
- 12.Shumaker SA, Legault C, Rapp SR, et al. Estrogen plus progestin and the incidence of dementia and mild cognitive impairment in postmenopausal women. JAMA 2003; 289:2651–2662. [DOI] [PubMed] [Google Scholar]
- 13.Writing Group for the Women's Health Initiative Investigators. Risks and benefits of estrogen plus progestin in healthy postmenopausal women. JAMA 2002; 288:321–333. [DOI] [PubMed] [Google Scholar]
- 14.Amin Z, Mason GF, Cavus I, et al. The interaction of neuroactive steroids and GABA in the development of neuropsychiatric disorders in women. Pharmacol Biochem Behav 2006; 84:635–643. [DOI] [PubMed] [Google Scholar]
- 15.Levinson AJ, Fitzgerald PB, Favalli G, et al. Evidence of cortical inhibitory deficits in major depressive disorder. Biol Psychiatry 2010; 67:458–464. [DOI] [PubMed] [Google Scholar]
- 16.Sanacora G, Mason GF, Rothman DL, et al. Increased occipital cortex GABA concentrations in depressed patients after therapy with selective serotonin reuptake inhibitors. Am J Psychiatry 2002; 159:663–665. [DOI] [PubMed] [Google Scholar]
- 17.Sanacora G, Mason GF, Rothman DL, et al. Increased cortical GABA concentrations in depressed patients receiving ECT. Am J Psychiatry 2003; 160:577–579. [DOI] [PubMed] [Google Scholar]
- 18.Croarkin PE, Levinson AJ, Daskalakis ZJ. Evidence for GABAergic inhibitory deficits in major depressive disorder. Neurosci Biobehav Rev 2011; 35:818–825. [DOI] [PubMed] [Google Scholar]
- 19.Hattemer K, Knake S, Reis J, et al. Excitability of the motor cortex during ovulatory and anovulatory cycles: a transcranial magnetic stimulation study. Clin Endocrinol (Oxf) 2007; 66:387–393. [DOI] [PubMed] [Google Scholar]
- 20.Altemus M, Fong J, Yang R, et al. Changes in cerebrospinal fluid neurochemistry during pregnancy. Biol Psychiatry 2004; 56:386–392. [DOI] [PubMed] [Google Scholar]
- 21.Epperson CN, Gueorguieva R, Czarkowski KA, et al. Preliminary evidence of reduced occipital GABA concentrations in puerperal women: a 1H-MRS study. Psychopharmacology 2006; 186:425–433. [DOI] [PubMed] [Google Scholar]
- 22.Puts NA, Edden RA. In vivo magnetic resonance spectroscopy of GABA: a methodological review. Prog Nucl Magn Reson Spectrosc 2012; 60:29–41. [DOI] [PMC free article] [PubMed] [Google Scholar]
- 23.Mescher M, Merkle H, Kirsch J, et al. Simultaneous in vivo spectral editing and water suppression. NMR Biomed 1998; 11:266–272. [DOI] [PubMed] [Google Scholar]
- 24.Edden RA, Muthukumaraswamy SD, Freeman TC, et al. Orientation discrimination performance is predicted by GABA concentration and gamma oscillation frequency in human primary visual cortex. J Neurosci 2009; 29:15721–15726. [DOI] [PMC free article] [PubMed] [Google Scholar]
- 25.Plante DT, Jensen JE, Schoerning L, et al. Reduced gamma-aminobutyric acid in occipital and anterior cingulate cortices in primary insomnia: a link to major depressive disorder? Neuropsychopharmacology 2012; 37:1548–1557. [DOI] [PMC free article] [PubMed] [Google Scholar]
- 26.Gao F, Edden RA, Li M, et al. Edited magnetic resonance spectroscopy detects an age-related decline in brain GABA levels. NeuroImage 2013; 78:75–82. [DOI] [PMC free article] [PubMed] [Google Scholar]
- 27.WHO. The ICD-10 Classification of Mental and Behavioral Disorders. Diagnostic Criteria for Research. Geneva: WHO; 1993. [Google Scholar]
- 28.Hamilton M. A rating scale for depression. J Neurol Neurosurg Psychiatry 1960; 23:56–62. [DOI] [PMC free article] [PubMed] [Google Scholar]
- 29.Gjerris A, Bech P, Bojholm S, et al. The Hamilton Anxiety Scale. Evaluation of homogeneity and inter-observer reliability in patients with depressive disorders. J Affect Disord 1983; 5:163–170. [DOI] [PubMed] [Google Scholar]
- 30.Harlow SD, Gass M, Hall JE, et al. Executive summary of the Stages of Reproductive Aging Workshop + 10: addressing the unfinished agenda of staging reproductive aging. Menopause 2012; 19:387–395. [DOI] [PMC free article] [PubMed] [Google Scholar]
- 31.Juang KD, Wang SJ, Lu SR, et al. Hot flashes are associated with psychological symptoms of anxiety and depression in peri- and post- but not premenopausal women. Maturitas 2005; 52:119–126. [DOI] [PubMed] [Google Scholar]
- 32.Woods NF, Smith-DiJulio K, Percival DB, et al. Depressed mood during the menopausal transition and early postmenopause: observations from the Seattle Midlife Women's Health Study. Menopause 2008; 15:223–232. [DOI] [PubMed] [Google Scholar]
- 33.Mackin RS, Tosun D, Mueller SG, et al. Patterns of reduced cortical thickness in late-life depression and relationship to psychotherapeutic response. Am J Geriatr Psychiatry 2013; 21:794–802. [DOI] [PMC free article] [PubMed] [Google Scholar]
- 34.Chen Y, Wang C, Zhu X, et al. Aberrant connectivity within the default mode network in first-episode, treatment-naïve major depressive disorder. J Affective Disorders 2015; 183:49–56. [DOI] [PubMed] [Google Scholar]
- 35.Rothman DL, Behar KL, Prichard JW, et al. Homocarnosine and the measurement of neuronal pH in patients with epilepsy. Magn Reson Med 1997; 38:924–929. [DOI] [PubMed] [Google Scholar]
- 36.Edden RA, Puts NA, Harris AD, et al. Gannet: a batch processing tool for the quantitative analysis of gamma-aminobutyric acid-edited MR spectroscopy spectra. J Magn Reson 2014; 40:1445–1452. [DOI] [PMC free article] [PubMed] [Google Scholar]
- 37.Bai X, Edden RA, Gao F, et al. Decreased γ-aminobutyric acid levels in the parietal region of patients with Alzheimer's disease. J Magn Reson Imaging 2015; 41:1326–1331. [DOI] [PMC free article] [PubMed] [Google Scholar]
- 38.Zhang Y, Brady M, Smith S. Segmentation of brain MR images through a hidden Markov random field model and the expectation-maximization algorithm. IEEE Trans Med Imaging 2001; 20:45–57. [DOI] [PubMed] [Google Scholar]
- 39.M Montelius, et al. MATLAB tool for segmentation and re-creation of 1H-MRS volumes of interest in MRI image stacks. ESMRMB, October 1–3, Antalya/TR.2008. [Google Scholar]
- 40.Bustillo JR, et al. Effects of chronic haloperidol and clozapine treatments on frontal and caudate neurochemistry in schizophrenia. Psychiatry Res 2001; 107:135–149. [DOI] [PubMed] [Google Scholar]
- 41.Kelsom C, Lu W. Development and specification of GABAergic cortical interneurons. Cell Biosci 2013; 3:19. [DOI] [PMC free article] [PubMed] [Google Scholar]
- 42.Buzsáki G, Kaila K, Raichle M. Inhibition and brain work. Neuron 2007; 56:771–783. [DOI] [PMC free article] [PubMed] [Google Scholar]
- 43.Palomero-Gallagher N, Mohlberg H, Zilles K, et al. Cytology and receptor architecture of human anterior cingulate cortex. J Comp Neurol 2008; 508:906–926. [DOI] [PMC free article] [PubMed] [Google Scholar]
- 44.Hasler G, van der Veen JW, Tumonis T, et al. Reduced prefrontal glutamate/glutamine and γ-aminobutyric acid levels in major depression determined using proton magnetic resonance spectroscopy. Arch Gen Psychiatry 2007; 64:193–200. [DOI] [PubMed] [Google Scholar]
- 45.Price RB, Shungu DC, Mao X, et al. Amino acid neurotransmitters assessed by proton magnetic resonance spectroscopy: relationship to treatment resistance in major depressive disorder. Biol Psychiatry 2009; 65:792–800. [DOI] [PMC free article] [PubMed] [Google Scholar]
- 46.Küçükibrahimoğlu E, Saygin MZ, Caliskan M, et al. The change in plasma GABA, glutamine and glutamate levels in fluoxetine- or S-citalopram-treated female patients with major depression. Eur J Clin Pharmacol 2009; 65:571–577. [DOI] [PubMed] [Google Scholar]
- 47.Kugler P. Enzymes involved in glutamatergic and GABAergic neurotransmission. Int Rev Cytol 1993; 147:285–336. [DOI] [PubMed] [Google Scholar]
- 48.Karolewicz B, Maciag D, O’Dwyer G, et al. Reduced level of glutamic acid decarboxylase-67 kDa in the prefrontal cortex in major depression. Int J Neuropsychopharmacol 2010; 13:411–420. [DOI] [PMC free article] [PubMed] [Google Scholar]
- 49.Banasr M, Chowdhury G, Terwilliger MR, et al. Glial pathology in an animal model of depression: reversal of stress-induced cellular, metabolic and behavioral deficits by the glutamate-modulating drug riluzole. Mol Psychiatry 2010; 15:501–511. [DOI] [PMC free article] [PubMed] [Google Scholar]
- 50.Rajkowska G, O’Dwyer G, Teleki Z, et al. GABAergic neurons immunoreactive for calcium binding proteins are reduced in the prefrontal cortex in major depression. Neuropsychopharmacology 2007; 32:471–482. [DOI] [PMC free article] [PubMed] [Google Scholar]
- 51.Maciag D, Hughes J, O’Dwyer G, et al. Reduced density of calbindin immunoreactive GABAergic neurons in the occipital cortex in major depression: relevance to neuroimaging studies. Biol Psychiatry 2010; 67:465–470. [DOI] [PMC free article] [PubMed] [Google Scholar]
- 52.Randolph JF, Jr, Zheng H, Sowers MR, et al. Change in follicle-stimulating hormone and estradiol across the menopausal transition: effect of age at the final menstrual period. J Clin Endocrinol Metab 2011; 96:746–754. [DOI] [PMC free article] [PubMed] [Google Scholar]
- 53.Nakamura NH, Resell DR, Akamai KT, et al. Estrogen and ovariectomy regulate mRNA and protein of glutamic acid decarboxylases and cation-chloride cotransporters in the adult rat hippocampus. Neuroendocrinology 2004; 80:308–323. [DOI] [PubMed] [Google Scholar]
- 54.Weiland NG. Glutamic acid decarboxylase messenger ribonucleic acid is regulated by estradiol and progesterone in the hippocampus. Endocrinology 1992; 131:2697–2702. [DOI] [PubMed] [Google Scholar]
- 55.Murphy DD, Cole NB, Greenberger V, et al. Estradiol increases dendritic spine density by reducing GABA neurotransmission in hippocampal neurons. J Neurosci 1998; 18:2550–2559. [DOI] [PMC free article] [PubMed] [Google Scholar]
- 56.Noriega NC, Gelid DH, Garyfalloua VT, et al. Influence of 17β-estradiol and progesterone on GABAergic gene expression in the arcuate nucleus, amygdala and hippocampus of the rhesus macaque. Brain Res 2010; 1307:28–42. [DOI] [PMC free article] [PubMed] [Google Scholar]
- 57.Sanacora G, Gueorguieva R, Epperson CN, et al. Subtype-specific alterations of aminobutyric acid and glutamate in patients with major depression. Arch Gen Psychiatry 2004; 61:705–713. [DOI] [PubMed] [Google Scholar]
- 58.Roy A, Dejong J, Ferraro T. CSF GABA in depressed patients and normal controls. Psychol Med 1991; 21:613–618. [DOI] [PubMed] [Google Scholar]
- 59.Petty F, Kramer GL, Gullion CM, et al. Low plasma-aminobutyric acid levels in male patients with depression. Biol Psychiatry 1992; 32:354–363. [DOI] [PubMed] [Google Scholar]