Abstract
To evaluate, using pupillography, the difference between eyes affected by age-related macular degeneration and their contralateral normal eyes with regard to the mean relative afferent pupillary defect (RAPD) score. Also, to ascertain any correlations between this difference in RAPD score and differences in visual acuity or age-related macular degeneration (AMD) dimensions. Measurements were made using the RAPDx pupillographer (Konan Medical, Nishinomiya, Japan), which analyzes pupil response to light stimulation. Both best corrected visual acuity (converted to logMAR) and greatest linear dimension (GLD; calculated on the basis of fluorescence angiography images) were measured. The correlations between RAPD difference and logMAR difference, and GLD difference were then analyzed. The study included 32 patients (18 men, 14 women; mean age = 74.8 ± 9.7 years) who had AMD in 1 eye and a normal fundus in the contralateral eye. Mean resting pupil diameter, mean latency onset of constriction, mean velocity of constriction, and recovery were not significantly different in AMD eyes compared with normal eyes. The mean amplitude of constriction was smaller (P = 0.028), and the mean latency of maximum constriction was shorter (P = 0.0013) in AMD eyes than in normal eyes. Regarding RAPD scores, there was a significant correlation between visual acuity difference and RAPD score differences of both amplitude (P < 0.001, r = 0.53) and latency (P = 0.034, r = 0.33). GLD difference was also significantly correlated with differences in both amplitude (P = 0.021, r = 0.36) and latency (P = 0.033, r = 0.33) scores. RAPD outcomes were correlated with visual acuity and AMD dimension. Automated pupillography may be a useful tool in monitoring the progression of AMD and assessing changes in retinal function that result from novel interventions.
Keywords: age-related macular degeneration, pupillometry, relative afferent pupillary defect
1. Introduction
Relative afferent pupillary defect (RAPD) is caused by lesions in the anterior visual pathway, including the cornea, lens, vitreous, retina, optic disc, and optic nerve.[1–5] The condition causes an asymmetry in the information received from each of the eyes, and was first described by Levatin in 1959.[6] RAPD has typically been quantitatively assessed by combining the swinging flashlight test[7–9] with the placing of a neutral density filter in front of the unaffected eye in order to balance the defect. The darkness of the filter is changed in steps of size 0.3 log10 unit[10] and the defect is considered balanced when the pupil size of the affected eye equals that of the unaffected eye. However, there are several problems associated with this test, including end-point determination, unequal retinal illumination, and examiner bias. Furthermore, it is difficult to evaluate RAPD using the swinging flashlight test in patients with a dark iris, or with small or poorly reactive pupils.[11,12] Automated pupillometry eliminates examiner bias and observational inaccuracy, and offers more reliable assessment of RAPD.[13–15]
Age-related macular degeneration (AMD) is a disease involving choroidal neovascularization, which leads to photoreceptor death—primarily in the macula. Early loss of cone function and structural integrity has also been reported in AMD,[16] and cones changes in functions related to dark adaptation have better diagnostic power than rods changes[17] as well as better reproducibility.[18] We have previously reported a decrease in retinal function, detected using a focal macular electroretinogram, in eyes with AMD,[19] and that this decrease can be improved using surgery,[20] antivascular endothelial growth factor drugs,[21,22] or photodynamic therapy.[23,24] Evaluation using RAPD scores has been reported in eyes with glaucoma.[5,25–27] Nevertheless, to the best of our knowledge there have been no reports evaluating RAPD in AMD eyes. Therefore, we have used automated pupillography to evaluate the differences in RAPD scores between eyes with AMD and their contralateral normal eyes. Moreover, we have analyzed the correlations between (1) differences in visual acuity difference and RAPD score difference, and (2) AMD dimension difference and RAPD score difference.
2. Materials and methods
2.1. Patients
This chart review was conducted at Nagoya University Hospital, Nagoya City, Japan. The study involved patients with 1 eye with AMD and 1 eye with a normal fundus. All patients were diagnosed with AMD using a combination of color photography, fluorescence angiography, and indocyanine green angiography. Subtypes of AMD were diagnosed in the same way. Greatest linear dimension (GLD) was calculated using the fluorescence angiography images. In cases where the AMD lesion covered 30° of macula, the eye was excluded from the study. In addition, those patients were included in the study in whom both eyes had an intraocular lens, or both had the same grade of cataract. Eyes with any other ocular disease (corneal disease, nonreactive pupils, asymmetric cataracts, vitreous opacities, retinal disease, or optic neuropathy) were excluded. RAPD measurement was carried out within 3 months of diagnosis. All procedures, and the study design, conformed to the tenets of the Declaration of Helsinki. Furthermore, this retrospective observational study was approved by the Ethics Committee of Nagoya University Graduate School of Medicine.
2.2. Best corrected visual acuity
Best corrected visual acuity (BCVA) was measured using a standard Japanese visual acuity chart on the day of RAPD measurement, and was then converted to Snellen visual acuity. For the purposes of statistical analysis, BCVA was converted to logarithmic minimum angle of resolution (logMAR).
2.3. Automated pupillography
The RAPDx (Konan Medical, Nishinomiya, Japan; Fig. 1A) records and analyzes pupil responses to various stimuli; these responses can be predetermined in terms of size, shape, intensity, duration, and color. The device also records the precise amplitudes and latencies of the pupil responses in order to quantify RAPD; it then converts these measurements into RAPD scores. Measurements are on a continuous scale, and quantify units of less than 0.3 log10 unit. Pupil responses were tested using the RAPDx pupillography, a new binocular infrared computerized pupillograph. The device measures bilateral pupil responses to a sequence of monocular visual stimuli. Stimuli are generated using a single liquid crystal display screen that has a central physical barrier in order to create 2 optical channels. The screen displays a target (green cross) for patient fixation; during testing, each portion can be enabled selectively to achieve separate stimulation of each eye. The screen is viewed at infinity through a pair of 50 mm objective lenses to give an approximately 25° field of view in each eye. Eyes are illuminated by a pair of infrared-emitting diodes mounted at a 30° angle to each other. Under infrared conditions, information regarding the so-called dark pupil diameter is captured as the number of camera pixels, and this measurement is converted to millimeters using a scaling factor. The measurement was calculated under both direct and indirect light stimulation. The RAPDx incorporates pupil-tracking and blink-detection systems using 60 full frame/s digital cameras, each with a resolution of 240 × 240 pixel/frame, to give a total of approximately 25 pixel/mm. If blink obscures the pupil during recording, the test is repeated automatically.
Figure 1.
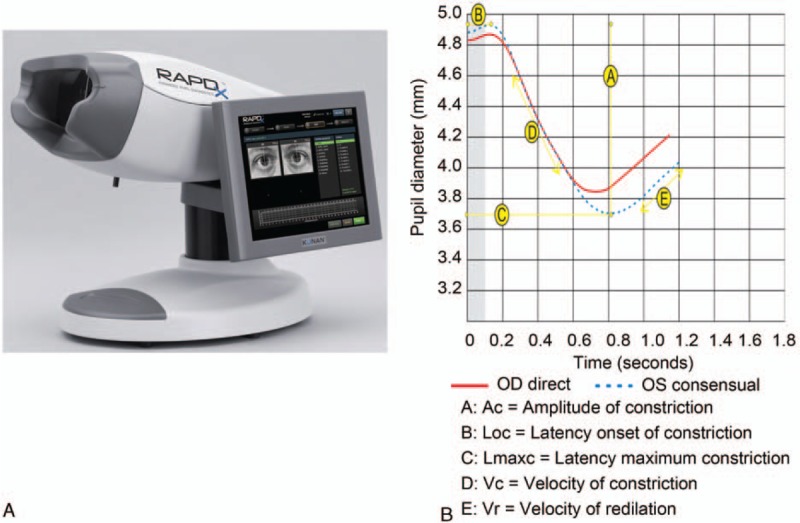
Photograph of the RAPDx and the measurements made by the RAPDx. The RAPDx measures pupil movement and calculates pupil size, amplitude, and latency. RAPD = relative afferent pupillary defect.
2.4. Pupil response parameters
The pupillograph generates pairs of simultaneous biometric waveforms that represent the average pupil responses (combined right and left eye) to the monocular stimuli (Fig. 1B). Software is incorporated to parse the pupil diameter waveforms into specific metrics. The median value is calculated from the series of repetitions in order to minimize noise. Parameters measured by the pupillograph include resting pupil diameter, amplitude of constriction (AC), latency onset of constriction (Loc), latency of maximum constriction (Lmaxc), velocity of constriction (Vc), and velocity of recovery (Vr).
The RAPD amplitude score was calculated as 10∗log10 (amplitude of normal eye/amplitude of AMD eye), and the RAPD latency scores as 10∗log10 (Lmaxc of AMD eye/Lmaxc of normal eye), as in previously reported methods.[5,25,28] Scores near to 0 showed that the 2 eyes had almost the same reaction to light stimulation, and the absolute value of the RAPD score provided an overall marker of asymmetry, without regard to the laterality of the defect for each stimulus.
2.5. Statistical analysis
The outcomes of measurements made by the RAPDx in both AMD eyes and normal eyes were statistically analyzed using the Mann–Whitney U test, and correlation between differences in RAPD score and differences in logMAR (AMD eye logMAR − normal eye logMAR), and GLD were analyzed using Spearman correlation. The data were analyzed using the StatView version 5 (HULINKS Inc., Tokyo, Japan) computer software. A P value less than 0.05 was considered statistically significant.
3. Results
3.1. Patients, BVCA and GLD
Thirty-two patients (18 men, 14 women; mean age = 74.4 ± 9.5 years) were included and their characteristics are shown in Table 1. The distribution of AMD subtypes was: typical AMD, 19 eyes; polypoidal choroidal vasculopathy (PCV), 9 eyes; and retinal angiomatous proliferation (RAP), 4 eyes. BCVA and GLD are shown in Table 2; BCVA ranged from 8/200 to 20/20 in AMD eyes, and from 20/40 to 30/20 in normal eyes. Mean visual acuity converted to logMAR was 0.56 ± 0.42 in AMD eyes, and 0.07 ± 0.13 in normal eyes. The mean difference in logMAR was 0.48 ± 0.39. GLD ranged from 1234 μm to 8821 μm, and mean GLD was 4362 ± 2078 μm.
Table 1.
Patients characteristics.
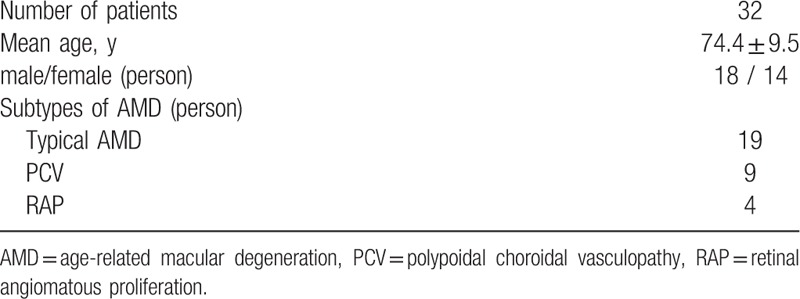
Table 2.
Best collected visual acuity and greatest liner dimension.

3.2. RAPDx measurement outcomes
Examples of the measurements made by the RAPDx, BCVA, and GLD, are shown in Figure 2. In this study, both Ac and Lmaxc were smaller in the AMD eye than in the normal eye. Additionally, the RAPD amplitude score was 0.91, while the RAPD latency score was −0.21. The outcomes of the measurements made by the RAPDx are shown in Table 3. Mean resting pupil diameter was 4.13 ± 0.73 mm in AMD eyes, and 4.21 ± 0.68 mm in normal eyes; mean AC was 0.91 ± 0.29 mm in AMD eyes, and 1.06 ± 0.32 mm in normal eyes, mean Loc was 194 ± 22 ms in AMD eyes, and 190 ± 20 ms in normal eyes; mean Lmaxc was 685 ± 53 ms in AMD eyes, and 723 ± 52 ms in normal eyes; mean Vc was 3.24 ± 0.79 mm/sec in AMD eyes, and 3.37 ± 0.80 mm/s in normal eyes; mean Vr was 1.96 ± 0.69 in AMD eyes, and 1.98 ± 0.65 in normal eyes. There were no significant differences between AMD eyes and normal eyes with regard to mean resting pupil diameter, mean Loc, and Vc, and mean Vr. That said, there were significant differences in both AC (P < 0.05) and Lmaxc (P < 0.01).
Figure 2.
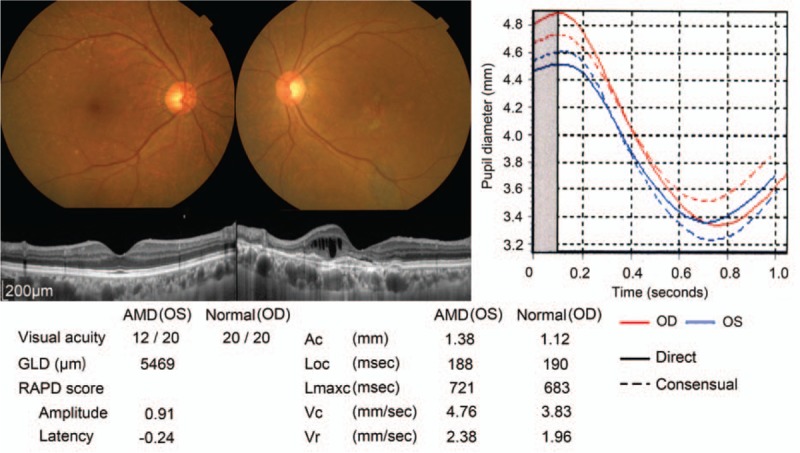
Example of an eye with AMD measured using the RAPDx. Color photographs, optical coherence tomography images, and outcomes of measurements made using the RAPDx. The left eye had typical AMD and the right eye had a normal fundus. AMD = age-related macular degeneration, RAPD = relative afferent pupillary defect.
Table 3.
Outcomes of RAPDx and RAPD scores.
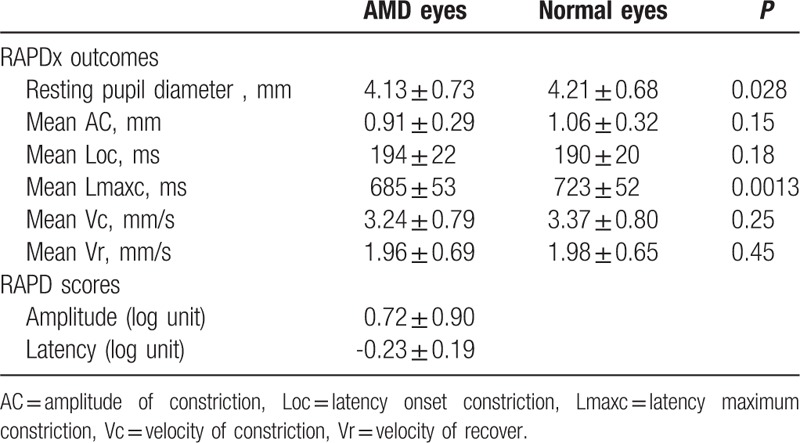
We converted these outcomes for AMD eyes to RAPD scores. Mean amplitude score was 0.72 ± 0.90 log units, while mean latency score was −0.23 ± 0.19 log units. Absolute RAPD amplitude scores of 0.3 log units or more in response to light stimulation were present in 25 eyes (78.1%), and RAPD latency scores of 0.3 log units occurred in 10 eyes (31.3%).
3.3. The correlations of RAPD with visual acuity and GLD
The correlations of the differences in RAPD scores with differences in BCVA and GLD are shown in Figure 3. The differences in logMAR were moderately correlated with differences in RAPD amplitude scores (P = 0.0014, r = 0.53; Fig. 3A), and weakly correlated with differences in RAPD latency scores (P = 0.034, r = 0.33; Fig. 3B). GLD difference was weakly correlated with the difference in both RAPD amplitude scores (P = 0.021, r = 0.36; Fig. 3C) and RAPD latency scores (P = 0.033, r = 0.33; Fig. 3D).
Figure 3.
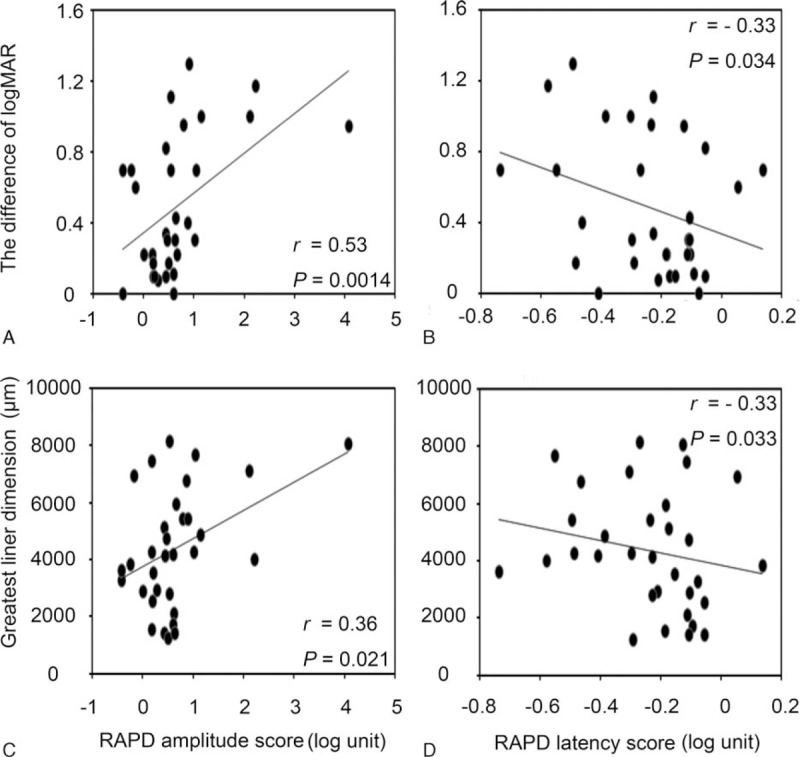
The correlations between the difference in RAPD score and differences in visual acuity and GLD. Differences in logMAR and GLD were correlated with differences in RAPD amplitude score and in RAPD latency score. GLD = greatest linear dimension, logMAR = logarithm of the minimum angle of resolution, RAPD = relative afferent pupillary defect.
4. Discussion and conclusion
In this study, we have shown that Ac and Lmaxc were significantly lower, but that resting pupil diameter, Loc, Vc, and Vr were not significantly different, in AMD eyes compared to their contralateral normal eyes. Converting RAPD outcomes to RAPD scores, we found that mean amplitude score was 0.72 ± 0.90 log units, and that mean latency score was −0.23 ± 0.19 log units. The differences in both logMAR and GLD were correlated with differences in both RAPD amplitude scores and RAPD latency scores.
RAPD is caused by lesions in the anterior visual pathway—the cornea, lens, vitreous, retina, and optic nerve—and the outcomes of pupillography in this condition as well as correlations with other ocular diseases, have previously been reported.[5,26,27,29] Automated pupillometry records the precise amplitudes and latencies of pupil responses to stimulation using the same light intensity, analyzes these pupil responses, and converts the results of this analysis to RAPD scores without examiner bias. In this way, the technique offers more reliable assessment of RAPD.[14]
In previous studies involving eyes with glaucoma, amplitude has been found using this technique to be significantly decreased, although latency is not delayed.[25,30] Similarly, in eyes with optic neuritis or multiple sclerosis, amplitude is decreased and latency is prolonged. In the present study involving eyes with AMD, Loc in AMD did not differ significantly from that in normal eyes; this indicates that the speed of the impulse from the eye to the midbrain, and from the midbrain to the pupil, is almost the same in both eyes. However, the mean AC was smaller in the AMD eyes, mean Lmaxc was shorter, and pupil movement was not defected. Furthermore, the duration between onset and maximum constriction was shorter in AMD eyes, whereas velocity was normal; this likely resulted from the smaller amplitude in eyes with AMD.
We have previously reported a decrease in focal retinal function, determined using the focal macular electroretinogram, in AMD eyes.[19,31,32] It is possible in this case that light stimulation to the midbrain decreases with retinal function in the macular area of AMD eyes; this would explain the smaller amplitude and shorter Lmaxc found in the present study. The speed of stimulation was the same in AMD eyes as in normal eyes because of the normal optic nerve in AMD eyes. In eyes with optic neuritis, nerve transmission resulting from light stimulation is slower because of the defect to the optic nerve fiber; therefore, both Loc and Lmaxc are larger in these eyes than in normal eyes.
A significant correlation of visual acuity with focal retinal function has been shown using focal macular electroretinogram combined with visual acuity measurement in AMD eyes.[19,31] What is more, a significant correlation of GLD with visual acuity has been reported.[33,34] In the present study, difference in logMAR visual acuity and difference in GLD were significantly correlated (P = 0.034, r = 0.33) and both were correlated with differences in RAPD scores.
The pupillary light reflex occurs in response to stimulation of photosensitive retinal ganglion cells, which are most sensitive to short wavelength blue light.[35] However, measurement of RAPD in eyes with glaucoma has shown that stimulation using white light is most strongly correlated with differences in glaucoma progress, and that stimulation with blue light is not more strongly correlated than stimulation with other colors.[25] This is the reason we used white light as a stimulant in the present study.
Some limitations of the present study include the small sample size, the use of only 30° light stimulation, and the lack of corroborating focal macular electroretinogram measurement or scotoma caused by AMD. The RAPDx can be freely modified in terms of range and patterns of stimulation. Conversely, the focal macular electroretinogram can only be modified in terms of an area of 5°, 10°, 15°, and 30° within the measured area of focal retinal function. Therefore, future studies can be expected to detect focal retinal function and photoreceptor function in asymmetry with a greater degree of accuracy.
In conclusion, automated pupillography may be a useful tool in monitoring progression of AMD and assessing changes in retinal function that result from novel interventions. Longitudinal studies are required in order to identify more correlations between retinal function and RAPD.
Acknowledgments
We thank Konan Medical for providing the photographs shown in Figure 1 as well as all the patients included in the study.
Footnotes
Abbreviations: AC = amplitude of constriction, AMD = age-related macular degeneration, BCVA = best corrected visual acuity, GLD = greatest linear dimension, Lmaxc = latency of maximum constriction, Loc = latency of onset constriction, LogMAR = logarithmic minimum angle of resolution, PCV = polypoidal choroidal vasculopathy, RAP = retinal angiomatous proliferation, RAPD = relative afferent pupillary defect, Vc = velocity of constriction, Vr = velocity of recover.
This work was supported by a Grant-in-Aid for Young Scientists (A) Grant Number 20647458 from the Japan Society for the Promotion of Science (H.K.). The study was also supported by the Japan Intractable Diseases Research Foundation (H.K.), the Takeda Science Foundation (H.K.), the Takeda Medical Research Foundation (H.K.), the Yokoyama Foundation for Clinical Pharmacology (YRY1411, H.K.), and the Uehara Memorial Foundation (H.K.).
The authors report no conflicts of interest.
References
- 1.Swienton DJ, Thomas AG. The visual pathway—functional anatomy and pathology. Semin Ultrasound CT MR 2014; 35:487–503. [DOI] [PubMed] [Google Scholar]
- 2.Burton JM, Costello F. A review of the anterior visual pathway model and the study of vitamin D in demyelinating disease. Mult Scler Relat Disord 2014; 3:22–27. [DOI] [PubMed] [Google Scholar]
- 3.Sanderson J, Dartt DA, Trinkaus-Randall V, et al. Purines in the eye: recent evidence for the physiological and pathological role of purines in the RPE, retinal neurons, astrocytes, Muller cells, lens, trabecular meshwork, cornea and lacrimal gland. Exp Eye Res 2014; 127:270–279. [DOI] [PMC free article] [PubMed] [Google Scholar]
- 4.Miki A, Iijima A, Takagi M, et al. Pupillography of relative afferent pupillary defect contralateral to monocular mature cataract. Can J Ophthalmol 2006; 41:469–471. [DOI] [PubMed] [Google Scholar]
- 5.Tatham AJ, Meira-Freitas D, Weinreb RN, et al. Detecting glaucoma using automated pupillography. Ophthalmology 2014; 121:1185–1193. [DOI] [PMC free article] [PubMed] [Google Scholar]
- 6.Levatin P. Unilateral papilledema and the swinging flashlight test. Trans Pac Coast Otoophthalmol Soc Annu Meet 1969; 50:161–177. [PubMed] [Google Scholar]
- 7.Levatin P, Prasloski PF, Collen MF. The swinging flashlight test in multiphasic screening for eye disease. Can J Ophthalmol 1973; 8:356–360. [PubMed] [Google Scholar]
- 8.Modica PA. Afferent pupillary defects and the swinging flashlight test. What you thought you already knew. Optom Clin 1996; 5:1–15. [PubMed] [Google Scholar]
- 9.Bell RA, Waggoner PM, Boyd WM, et al. Clinical grading of relative afferent pupillary defects. Arch Ophthalmol 1993; 111:938–942. [DOI] [PubMed] [Google Scholar]
- 10.Thompson HS, Corbett JJ, Cox TA. How to measure the relative afferent pupillary defect. Surv Ophthalmol 1981; 26:39–42. [DOI] [PubMed] [Google Scholar]
- 11.Wilhelm H, Peters T, Ludtke H, et al. The prevalence of relative afferent pupillary defects in normal subjects. J Neuroophthalmol 2007; 27:263–267. [DOI] [PubMed] [Google Scholar]
- 12.Kawasaki A, Moore P, Kardon RH. Variability of the relative afferent pupillary defect. Am J Ophthalmol 1995; 120:622–633. [DOI] [PubMed] [Google Scholar]
- 13.Lankaranian D, Altangerel U, Spaeth GL, et al. The usefulness of a new method of testing for a relative afferent pupillary defect in patients with ocular hypertension and glaucoma. Trans Am Ophthalmol Soc 2005; 103:200–207.discussion 207-208. [PMC free article] [PubMed] [Google Scholar]
- 14.Volpe NJ, Plotkin ES, Maguire MG, et al. Portable pupillography of the swinging flashlight test to detect afferent pupillary defects. Ophthalmology 2000; 107:1913–1921. [DOI] [PubMed] [Google Scholar]
- 15.Volpe NJ, Dadvand L, Kim SK, et al. Computerized binocular pupillography of the swinging flashlight test detects afferent pupillary defects. Curr Eye Res 2009; 34:606–613. [DOI] [PubMed] [Google Scholar]
- 16.Shelley EJ, Madigan MC, Natoli R, et al. Cone degeneration in aging and age-related macular degeneration. Arch Ophthalmol 2009; 127:483–492. [DOI] [PubMed] [Google Scholar]
- 17.Dimitrov PN, Guymer RH, Zele AJ, et al. Measuring rod and cone dynamics in age-related maculopathy. Invest Ophthalmol Vis Sci 2008; 49:55–65. [DOI] [PubMed] [Google Scholar]
- 18.Dimitrov PN, Robman LD, Varsamidis M, et al. Visual function tests as potential biomarkers in age-related macular degeneration. Invest Ophthalmol Vis Sci 2011; 52:9457–9469. [DOI] [PubMed] [Google Scholar]
- 19.Nishihara H, Kondo M, Ishikawa K, et al. Focal macular electroretinograms in eyes with wet-type age-related macular degeneration. Invest Ophthalmol Vis Sci 2008; 49:3121–3125. [DOI] [PubMed] [Google Scholar]
- 20.Terasaki H, Miyake Y, Niwa T, et al. Focal macular electroretinograms before and after removal of choroidal neovascular lesions. Invest Ophthalmol Vis Sci 2002; 43:1540–1545. [PubMed] [Google Scholar]
- 21.Iwata E, Ueno S, Ishikawa K, et al. Focal macular electroretinograms after intravitreal injections of bevacizumab for age-related macular degeneration. Invest Ophthalmol Vis Sci 2012; 53:4185–4190. [DOI] [PubMed] [Google Scholar]
- 22.Nishimura T, Machida S, Harada T, et al. Retinal ganglion cell function after repeated intravitreal injections of ranibizumab in patients with age-related macular degeneration. Clin Ophthalmol 2012; 6:1073–1082. [DOI] [PMC free article] [PubMed] [Google Scholar]
- 23.Ishikawa K, Nishihara H, Ozawa S, et al. Focal macular electroretinograms after photodynamic therapy combined with intravitreal bevacizumab. Graefes Arch Clin Exp Ophthalmol 2011; 249:273–280. [DOI] [PubMed] [Google Scholar]
- 24.Ishikawa K, Nishihara H, Ozawa S, et al. Focal macular electroretinograms after photodynamic therapy combined with posterior juxtascleral triamcinolone acetonide. Retina 2009; 29:803–810. [DOI] [PubMed] [Google Scholar]
- 25.Ozeki N, Yuki K, Shiba D, et al. Pupillographic evaluation of relative afferent pupillary defect in glaucoma patients. Brit J Ophthalmol 2013; 97:1538–1542. [DOI] [PubMed] [Google Scholar]
- 26.Sarezky D, Volpe NJ, Park MS, et al. Correlation between inter-eye difference in average retinal nerve fiber layer thickness and afferent pupillary response as measured by an automated pupillometer in glaucoma. J Glaucoma 2015; 25:312–316. [DOI] [PubMed] [Google Scholar]
- 27.Schiefer U, Dietzsch J, Dietz K, et al. Associating the magnitude of relative afferent pupillary defect (RAPD) with visual field indices in glaucoma patients. Br J Ophthalmol 2012; 96:629–633. [DOI] [PubMed] [Google Scholar]
- 28.Charalel RA, Lin HS, Singh K. Glaucoma screening using relative afferent pupillary defect. J Glaucoma 2014; 23:169–173. [DOI] [PubMed] [Google Scholar]
- 29.Hennessy AL, Katz J, Ramakrishnan R, et al. The utility of relative afferent pupillary defect as a screening tool for glaucoma: prospective examination of a large population-based study in a south Indian population. Br J Ophthalmol 2011; 95:1203–1206. [DOI] [PubMed] [Google Scholar]
- 30.Link B, Junemann A, Rix R, et al. Pupillographic measurements with pattern stimulation: the pupil's response in normal subjects and first measurements in glaucoma patients. Invest Ophthalmol Vis Sci 2006; 47:4947–4955. [DOI] [PubMed] [Google Scholar]
- 31.Terasaki H, Miyake Y, Kondo M, et al. Focal macular electroretinogram before and after drainage of macular subretinal hemorrhage. Am J Ophthalmol 1997; 123:207–211. [DOI] [PubMed] [Google Scholar]
- 32.Falsini B, Serrao S, Fadda A, et al. Focal electroretinograms and fundus appearance in nonexudative age-related macular degeneration. Quantitative relationship between retinal morphology and function. Graefes Arch Clin Exp Ophthalmol 1999; 237:193–200. [DOI] [PubMed] [Google Scholar]
- 33.Moutray T, Alarbi M, Mahon G, et al. Relationships between clinical measures of visual function, fluorescein angiographic and optical coherence tomography features in patients with subfoveal choroidal neovascularisation. Brit J Ophthalmol 2008; 92:361–364. [DOI] [PubMed] [Google Scholar]
- 34.Yaylali SA, Akcakaya AA, Erbil HH, et al. The relationship between optical coherence tomography patterns, angiographic parameters and visual acuity in age-related macular degeneration. Int Ophthalmol 2012; 32:25–30. [DOI] [PubMed] [Google Scholar]
- 35.Zaidi FH, Hull JT, Peirson SN, et al. Short-wavelength light sensitivity of circadian, pupillary, and visual awareness in humans lacking an outer retina. Curr Biol 2007; 17:2122–2128. [DOI] [PMC free article] [PubMed] [Google Scholar]


