Supplemental Digital Content is available in the text
Keywords: femur fracture, inequity, mortality, socioeconomic status, surgery, treatment of choice
Abstract
Femur fracture is an emerging public health concern in aging societies, owing to the substantially high morbidity and mortality. Because the recent increase in femur fracture incidence in Asian populations is comparable to that in the West, it is necessary to investigate the association between socioeconomic status (SES) and mortality after femur fracture in developed Asian societies.
Data were obtained from the National Health Insurance Claims Database. During 2002 to 2013, femur fractures were newly diagnosed in 5441 patients among 1025,340 enrollees. Multiple logistic regression and the Cox proportional model were used to investigate the associations between individual SES and probability of surgery and mortality after femur fracture.
Of 5441 patients, 1928 (35.4%) received surgery. Patients with low (odds ratio [OR] = 0.87, 95% confidence interval [CI]: 0.75–0.99) and middle (OR = 0.85, 95% CI: 0.74–0.98) income were less likely to undergo surgery than high-income patients. Patients with low (hazard ratio [HR] = 1.12, 95% CI: 1.01–1.24) and middle (HR = 1.20, 95% CI: 1.08–1.33) income had a higher HR for mortality. This difference was more prominent in patients who underwent surgery (low income: HR = 1.07, 95% CI: 0.94–1.21; middle income: HR = 1.18, 95% CI: 1.04–1.33) than in patients with conservative treatment (low income: HR = 1.24, 95% CI: 1.04–1.49; middle income: HR = 1.30, 95% CI: 1.08–1.56).
Femur-fracture patients with low SES are less likely to receive surgery for and more likely to die after femur fracture. The difference in mortality risk remained even when only the patients who received surgery were considered, suggesting that we need to consider support measures for these deprived patients.
1. Introduction
Femur fracture is an emerging public health concern in aging societies, with high morbidity and mortality.[1] According to previous studies, 1/3 of femur-fracture patients die in the year following injury, and many experience significant functional loss.[2–4]
Treating femur fracture, including rehabilitation treatment, is expensive to pay for, especially for patients with low socioeconomic status (SES). A typical femur fracture treatment may cost $40,000 USD in direct medical costs within the first year.[5,6] In Korea, the direct medical cost for femur fracture treatment was $3000 USD during the period from 2002 to 2004.[7] When we consider the Korean gross domestic product per capita (about $15,000 USD during this period), the treatment cost is more than 20% of total income.
Adding to the disproportionate burden of disease is the well documented association between social disadvantage and most causes of morbidity.[8] Various lifestyle factors related to increased risk of femur fracture, including smoking, lack of physical activity, and unbalanced diet, are more frequently and consistently found in people with lower SES.[9–11]
Since the Korean society is rapidly aging, the recent increase in incidence of femur fracture in the Korean population is comparable to that in Western society.[12,13] Given the environmental and demographic differences in SES between Western and Asian societies such as Korea, Japan, and China, it is unknown whether patterns of femur fracture mortality rate across individual SES may render the same results as those seen in Western society. In addition, the association between SES and mortality after femur fracture has not been extensively examined in Korea.
The aim of this study was to investigate the association between SES and mortality after femur fracture in Korea.
2. Methods
2.1. Data
The Korean National Health Insurance (NHI) cohort data included health information of approximately 1 million patients. This is a random sample stratified dataset by age, sex, region, income decile, and individual total medical costs from 2002 to 2013. National Health Security System is mandated to cover all Korean people, and this comprised the NHI and Medical Aid and overseen by the Ministry of Health and Welfare. The data have its own identifiable random numbers for each patient with age, sex, type of insurance, a list of diagnoses according to the Korean Classification of Diseases, which is basically identical to International Classification of Disease-10 (ICD-10). Medical costs claimed, prescribed drugs, and medical history are also contained in the dataset. In addition, unique anonymous numbers are linked to information on mortality obtained from the Korean National Statistical Office.
2.2. Participants
We conducted a cohort study using data on newly diagnosed femur-fracture patients (ICD-10 code: S72) using a 2.5% stratified random sample (N = 1025,340) of all Koreans enrolled in the Korean NHI Data on December 31, 2002 (Supplementary figure 1). From the 9031 patients with a primary diagnosis of femur fracture between 2002 and 2013, we excluded 1117 patients with preexisting femur fracture history from January 2002 to December 2003 and 2473 patients who were aged under 65 years at initial diagnosis. The remaining 5441 patients aged 65 years and older and free of femur fracture before the study were enrolled.
If patients had disqualification due to any reason such as emigration and imprison, they did not have further information for NHI in sequent years. Then, we censored them at the end of year with the last medical record.
2.3. Covariates
Demographic characteristics including age, sex, and residential area, as well as medical history of hypertension, prior fracture history due to osteoporosis, and disabled status were included in the data. Age group is divided into 2 categories, aged below 75 years and 75 years or over. Residential area means whether patients are living in urban and rural. There are 18 provinces in Korea, 1 capital (Seoul), 6 metropolitans (Busan, Daegu, Incheon, Daejeon, Gwangju, and Ulsan), and 11 rural provinces. Thus, urban means whether the patients are living in capital or metropolitans, while rural means the other provinces in Korea. We adjusted the Charlson Comorbidity Index (CCI) for the potential effect of preexisting medication conditions.[15] The CCI is the most widely studied morbidity index, and its validity has been confirmed by comparison with other indices. It has been validated for application to longitudinal study design. The CCI takes into account both the number and severity of the comorbid condition. However, since we are also interested in the medical history of dementia, which is included in calculating the equation for the CCI, we excluded dementia in the calculation for the CCI to avoid overadjustment.
In addition, we included neurologic disorders such as parkinsonism, dementia, and others related to aging and movement because they are well known risk factors to femur fracture. Since patients in nursing facilities and their families usually do not prefer aggressive and invasive treatment such as surgery, the history of staying in nursing facilities before the date of femur fracture was also included. Nursing facilities means long-term healthcare hospitals or facilities which are very popular organizations for caring elderlies in Korea.
We also considered the level of hospitals where patients were first treated and categorized them using a hierarchy with 3 components: general hospitals, hospitals, and clinics. According to the healthcare delivery system in Korea, we divided all healthcare organizations into 3 categories. General hospital means a healthcare organization which is able to provide specific specialist care for rare and almost incurable diseases. Hospital usually provides professional treatments in community level. Clinics are the primary healthcare organizations for general health problems. The location of the hospital, the number of beds and doctors, and the presence of magnetic resonance imaging (MRI) were included as indicators of medical performance.
2.4. Individual-level income measures
The NHI premium was used as a proxy measure of precise income because it is proportional to monthly income, including earnings and capital gains. For employees, a monthly insurance premium is calculated based on annual salary, while self-employees pay for their premium according to the value of their own property including house, account, car ownership, and so on. We categorized participants’ household incomes into 3 categories (low, 0–30 percentile; middle, 31–70 percentile; and high, 71–100 percentile).
2.5. Outcome variables
Femur fracture fixation using surgical electronic data interchange (EDI) transaction codes was used to identify surgical treatments for femur fractures. The extracted EDI transaction codes are given in Supplementary table 1. We also set another outcome variable of mortality, defined as all-cause mortality, after the initial diagnosis of femur fracture.
2.6. Statistical analysis
First of all, we evaluated the distribution of participants’ demographic characteristics at baseline. We described means and standard deviations for continuous and analyzed using t tests or the Kruskal–Wallis test where appropriate. In terms of categorical variables, we expressed as numbers and percentages and compared using the χ2 test.
We also estimated the adjusted odds ratios (ORs) and 95% confidence intervals (CIs) of the probability of surgical treatment by applying the multiple logistic regression model. It was also provided that another logistic model using backward stepwise regression. A significance level of 0.3 is required to allow a variable into the model, and a significance level of 0.35 is required for a variable to stay in the model. Model fitting was performed using the PROC LOGISTIC procedure in SAS version 9.3 (SAS Institute Inc., Cary, NC). The essential assumption of proportional hazard model was satisfied by graphical proof. In addition, we calculated mean survival time by each categorical variable with log-rank test. The adjusted hazard ratios (HRs) for mortality by the Cox proportional hazard model were performed using the PROC PHREG procedure in SAS.
3. Results
3.1. Demographic characteristics
The demographic characteristics of participants are presented in Table 1 and Supplementary table 2. A total number of 5441 patients were newly diagnosed with femur fractures from 2004 to 2013 and were enrolled in this study. Among all cases, 1928 patients (35.4%) were treated with surgery. The number of patients aged between 65 and 74 years was 1690 (31.1%) and another of aged 75 years and over was 3751 (68.9%). Of all patients, 2025 patients (37.2%) lived in urban areas, while the other 3416 (62.8%) patients lived in rural areas. Of all participants, 1561 (28.7%) were in the low-income category, 1388 (25.5%) were in the middle-income category, and 2492 (45.8%) were in the high-income category.
Table 1.
Demographic characteristics of enrolled subjects with femur fracture by treatment type, at baseline.
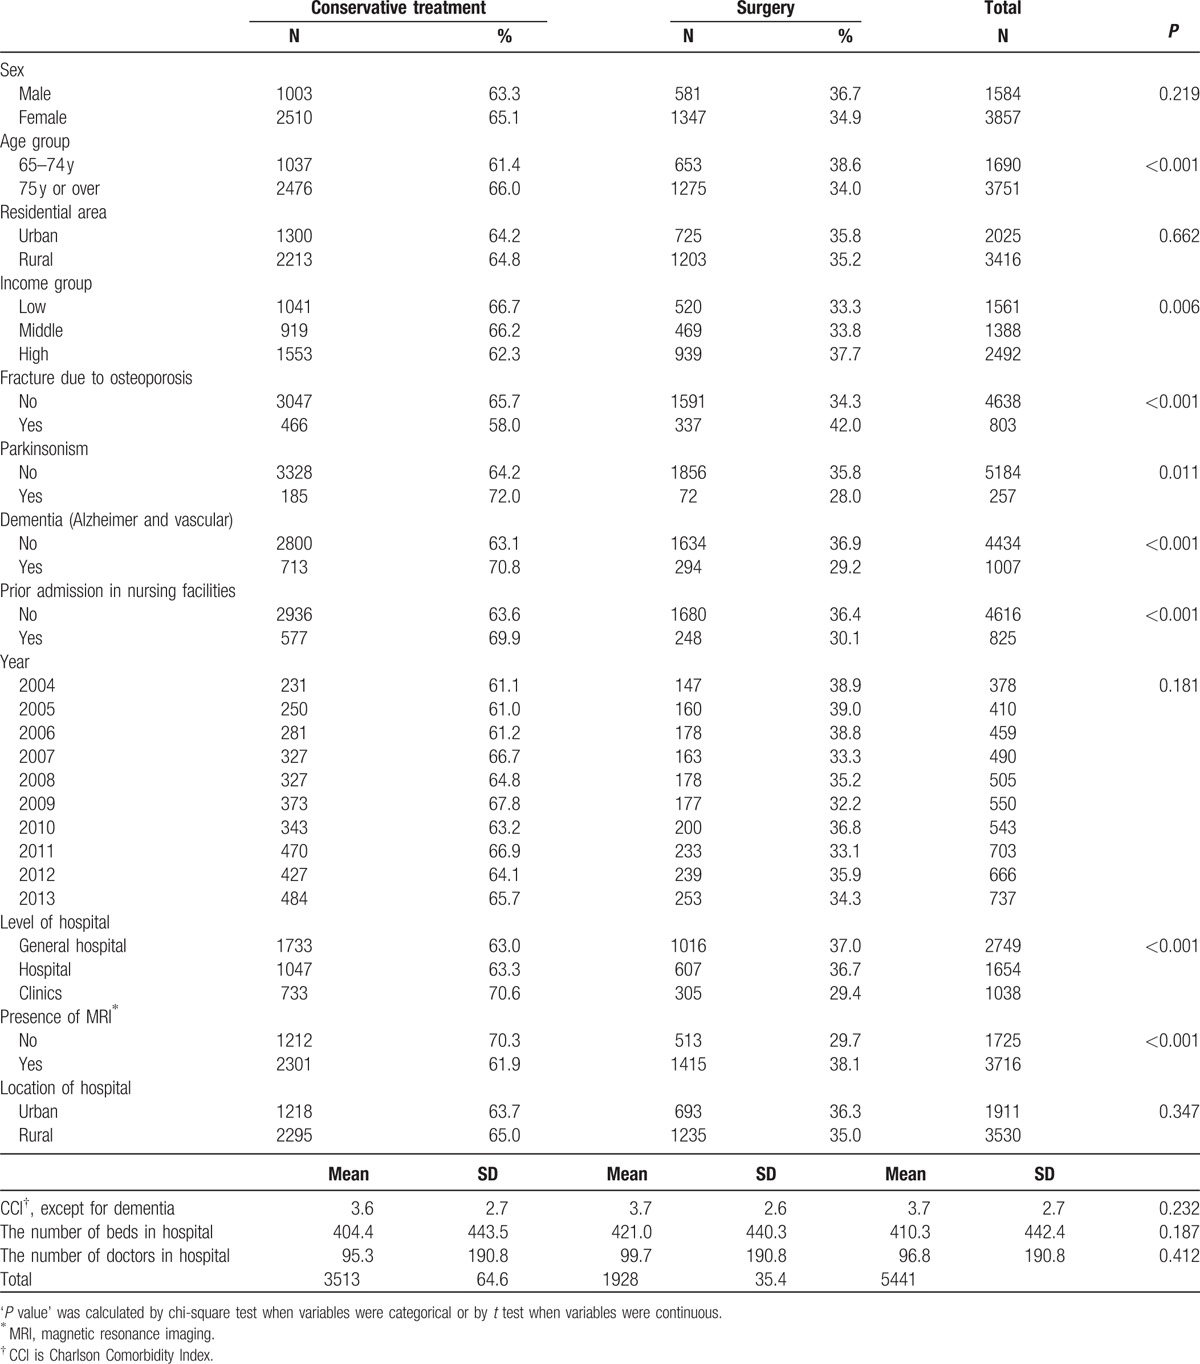
According to bivariate analysis, higher age group, low income, previous fracture history due to osteoporosis, medical history of parkinsonism and dementia, prior history staying nursing facilities, and absence of MRIs in hospitals were statistically associated with a lower probability of surgical treatment among femur-fracture patients.
3.2. Adjusted odds ratios for surgical treatment
Table 2 demonstrates the results of our logistic regression analysis in terms of ORs and 95% CIs of the relationships between covariates and the probability of surgical treatment of femur fracture. In terms of model fit statistics, −2 log L was 34,374, and Akaike information criterion was 34,406 with covariates. The patients in the elder age group of 75 years or over (OR = 0.87, 95% CI: 0.77–0.99) had statistically lower ORs of surgical treatment than those aged between 65 and 74 years. In terms of the income level, the low- (OR = 0.87, 95% CI: 0.75–0.99) and middle-income categories (OR = 0.85, 95% CI: 0.74–0.98) were associated with a lower probability of receiving surgery, compared to the high-income category reference group. The medical histories of fracture related to osteoporosis (OR = 1.43, 95% CI: 1.22–1.68) and dementia (OR = 0.77, 95% CI: 0.66–0.91) were statistically significantly associated with surgical treatment. However, the CCI was not associated with surgery. The patients with prior admissions to nursing facilities were less likely to get surgery (OR = 0.82, 95% CI: 0.69–0.97). The presence of MRIs in hospitals was associated with a higher OR of surgery (OR = 1.58, 95% CI: 1.30–1.93).
Table 2.
Adjusted OR for surgical treatment among femur-fracture patients.
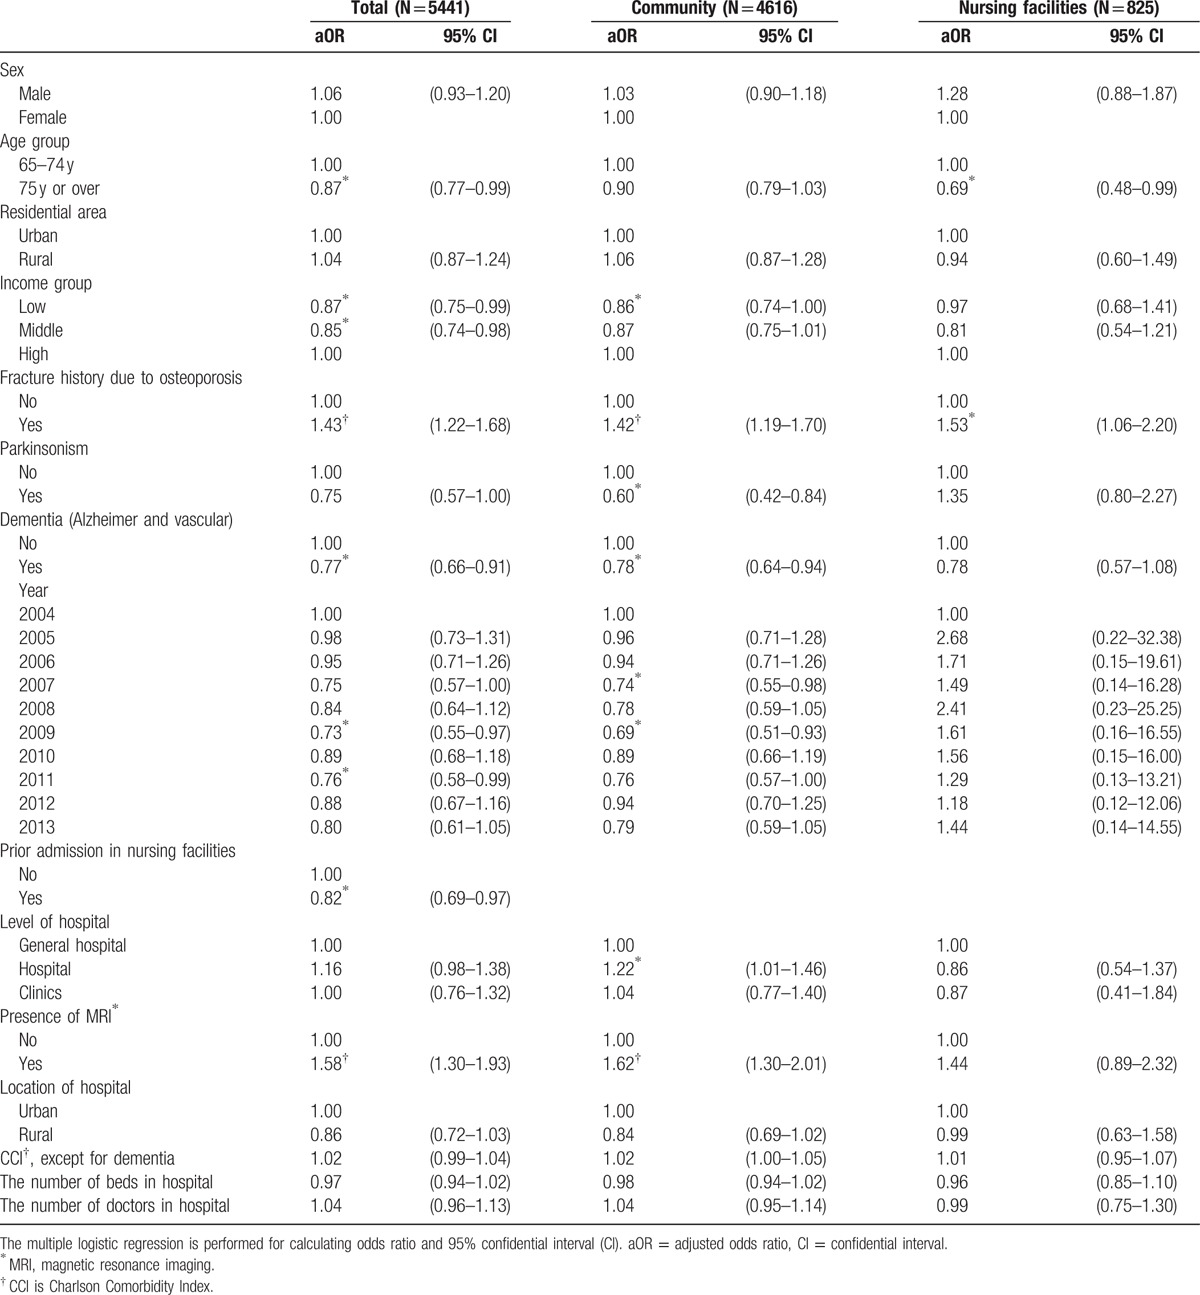
In terms of the sensitivity analysis using backward stepwise regression, there were similar results that low- (OR = 0.83, 95% CI: 0.72–0.96) and middle-income (OR = 0.85, 95% CI: 0.73–0.99) patients in community were associated with lower ORs for surgical treatments, compared to the other high-income patients (Supplementary table 3).
According to a subgroup analysis of patients with prior stays in nursing facilities, the income level was not associated with the probability of surgery, while the low-income group still had a lower OR (OR = 1.58, 95% CI: 1.30–1.93) in another subgroup analysis of patients without a history of stays in nursing facilities. Moreover, the medical conditions of neurodegenerative disorders including parkinsonism were not associated with ORs in the subgroup analysis of patients with a history of stays in nursing facilities.
3.3. Unadjusted probability of mortality
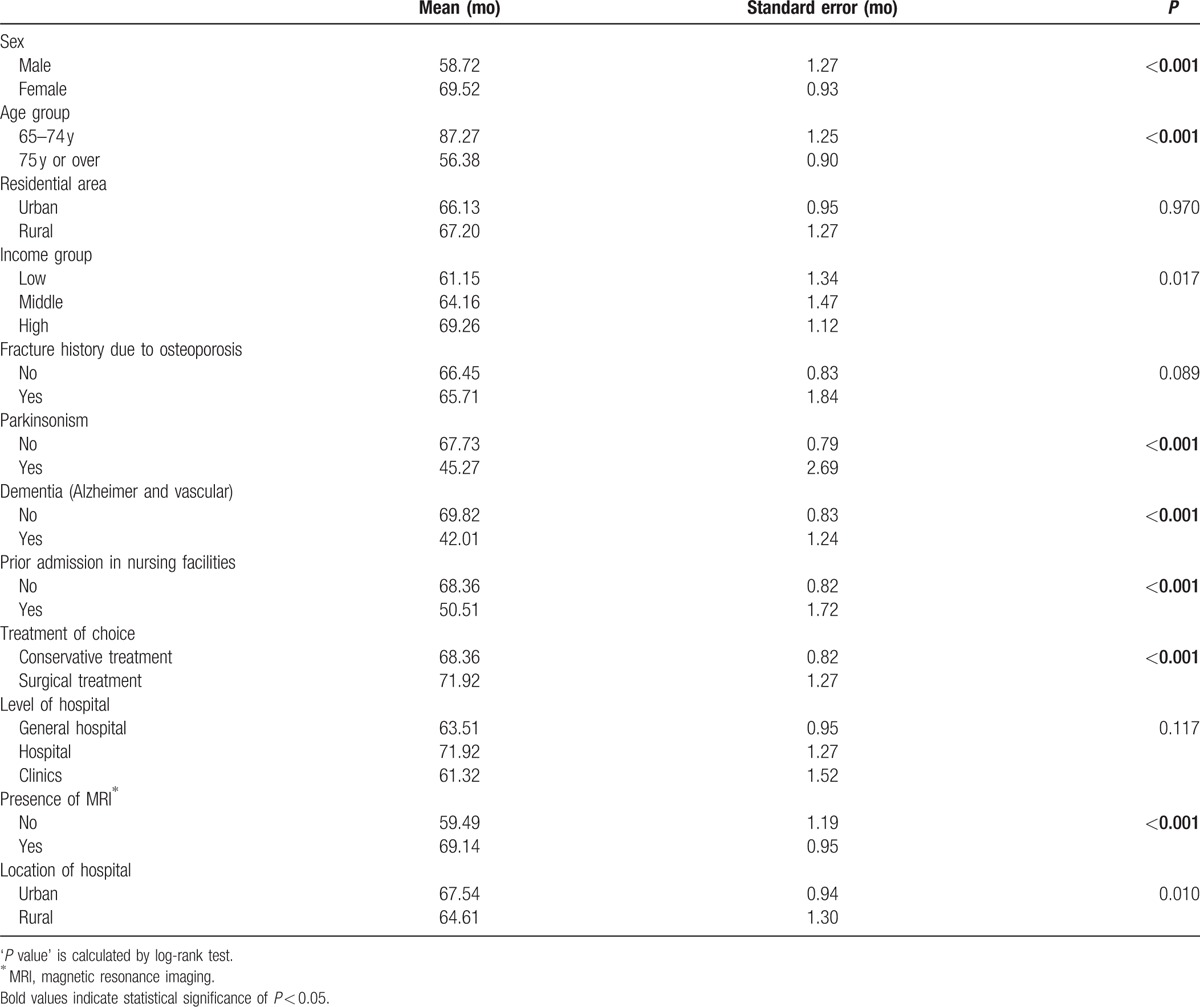
First, we did not adjust any covariates to investigate the association between tertile income level and death. Through this process, we could figure out the approximate trend of mortality across tertile income groups. When we compared the mortality cases per 100 person-years (PYs), the low- (15.0 cases/100 PYs) and middle-income (14.6 cases/100 PYs) patients had higher rates than high-income patients (12.7 cases/100 PYs) (Fig. 1). We also calculated mean survival time by categorical variables and performed statistical assessment using log-rank test (Table 3). In terms of income level, the mean survival time was extended as the income level was increased (P < 0.013).
Figure 1.
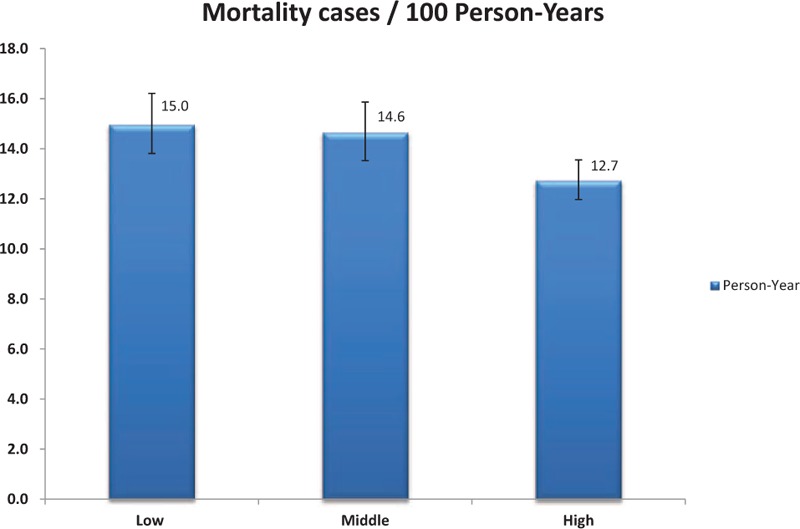
Mortality cases per 100 person-years, by tertile income groups. The 95% confidential intervals are presented in figure together.
Table 3.
Mean survival time and its standard error by each categorical variable.
According to the Kaplan–Meier survival analysis by specific type of treatment (Fig. 2), there is no statistical difference across income levels among femur-fracture patients with conservative treatments. However, the unadjusted survival analysis for the patients with surgical treatment showed statistical significance by the income level (P = 0.003).
Figure 2.
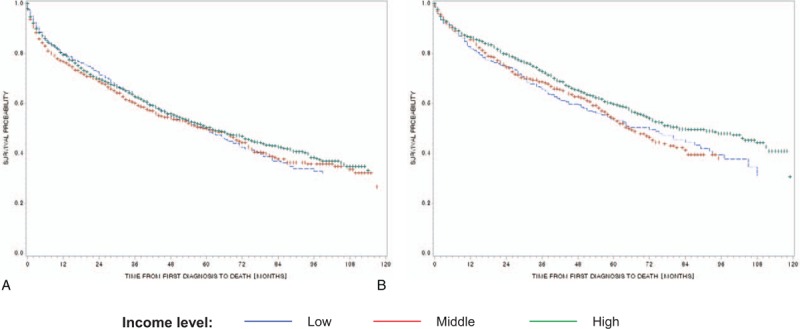
(A) Patients with conservative treatment, by income level (P = 0.4592). (B) Patients with surgical treatment, by income level.
3.4. Adjusted hazard ratio for mortality
Table 4 demonstrates the result of Cox proportional analysis for mortality by both treatments and each type of treatment. In terms of gender, men had higher HRs than women in total (HR = 1.52, 95% CI: 1.39–1.67) and in treatment subgroups (conservative—HR = 1.49, 95% CI: 1.33–1.67; surgical—HR = 1.61, 95% CI: 1.38–1.89). In terms of age group and residential area, the elder age group of 75 years or above (HR = 2.60, 95% CI: 2.33–2.89) and those living in urban areas (HR = 1.24, 95% CI: 1.08–1.41) had statistically significantly higher HRs compared to patients aged between 65 and 74 years and patients living in rural areas, respectively.
Table 4.
HRs for death among femur-fracture patients, depending on the type of treatments after femur fractures.
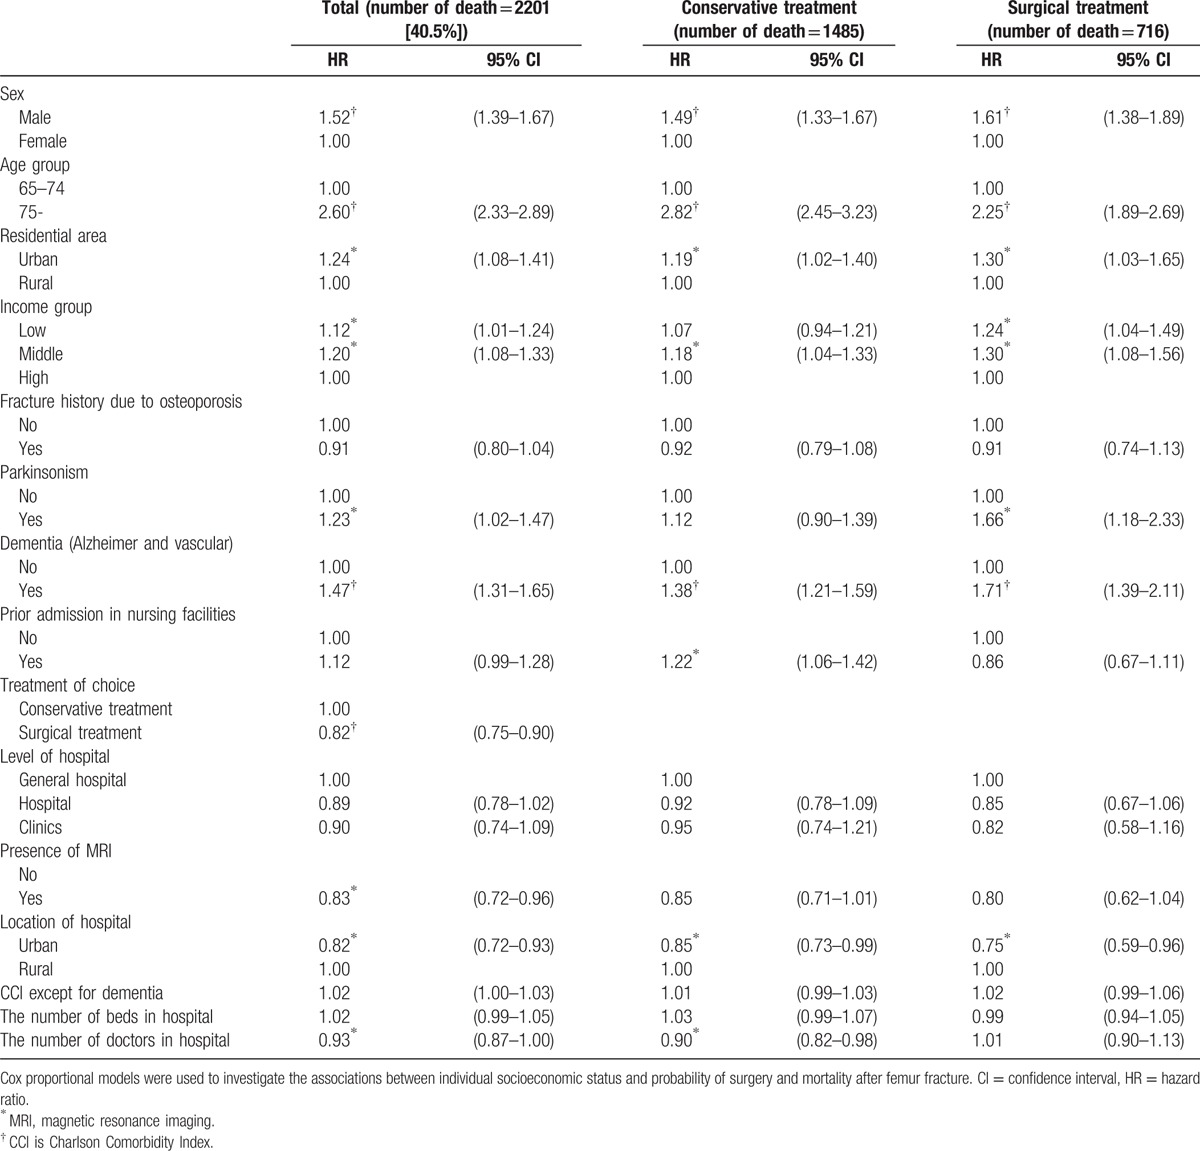
In terms of the income level, the patients with low (HR = 1.12, 95% CI: 1.01–1.24) and middle incomes (HR = 1.20, 95% CI: 1.08–1.33) had statistically significantly higher HRs. This difference by income level was more prominent in the subgroup analysis in the surgical treatment group (low income: HR = 1.07, 95% CI: 0.94–1.21; middle income: HR = 1.18, 95% CI: 1.04–1.33) than another among the conservative treatment group (low income—HR = 1.24, 95% CI: 1.04–1.49; middle income—HR = 1.30, 95% CI: 1.08–1.56).
Parkinsonism was associated with higher HR among total population (HR = 1.23, 95% CI: 1.02–1.1.47) and subpopulation with surgical treatment (HR = 1.66, 95% CI: 1.18–2.33), while dementia was consistently associated with both total and subpopulation with surgical and conservative treatment both (total—HR = 1.47, 95% CI: 1.31–1.65; conservative treatment—HR = 1.38, 95% CI: 1.21–1.59; surgical treatment—HR = 1.71, 95% CI: 1.39–2.11). Patients who received surgical treatment had lower HRs (HR = 0.82, 95% CI: 0.75–0.90) than those who received conservative treatment.
The hospitals in urban areas had lower mortality rates (HR = 0.82, 95% CI: 0.72–0.93) than hospitals in rural areas. There were similar trends in both subgroup analyses. In addition, the number of doctors per 1000 beds was inversely associated with HR (HR = 0.93, 95% CI: 0.87–1.00).
4. Discussion
Among the 5441 femur-fracture patients included in the study, the low- and middle-income groups were less likely to receive surgical treatment, compared to the high-income group. In addition, the patients with prior admission to nursing facilities and the patients with degenerative neurologic disorders of parkinsonism and dementia also had lower ORs of surgery. Prior stays at nursing facilities and medical histories of neurodegenerative disorders might make the patients, their family, and healthcare professionals opt out of surgical treatment because of the difficulty of rehabilitation and the lower chance for full recovery.[14,15] Furthermore, patients are not the sole decision-makers in their care plans.[16]
However, we have to consider the negative associations between income level and probability of surgery, regardless of the adjustment for each patient's medical condition. The accessibility to health care for low-income groups is insufficient. However, because surgical treatment is one of the most favorable independent variables associated with lower mortality rates,[17,18] the accessibility to surgery should ideally not be different across income levels. Unfortunately, it still seems that there is a difference in accessibility depending on individuals’ SES, according to many studies. Chopra et al[19] reported that US patients with annual incomes of over $39,000 USD and private insurance were more likely to receive curable primary femur arthroplasty according to the 2009 Nationwide Inpatient Sample data. Moreover, whites were more likely to undergo surgery, which is consistent with results from studies by Liu et al[20] and Jain et al.[21] Moreover, it is a universal phenomenon that femur-fracture patients with low incomes have a lower chance of receiving surgery in both Western and Asian societies. The Korean government offers universal health coverage for all citizens, while the US government has a different system that is now in transition, with the implementation of the Accountable Care Act. Out-of-pocket costs for femur surgery can be an even bigger burden for patients and families with low incomes, even under the universal health coverage system.
In terms of the mortality rate, male gender and the elder age group (75 years or over) were associated with higher HRs. Both advanced age and male gender have been recognized as strong mortality predictors among femur-fracture patients.[22,23] However, since overall medical conditions and surgical treatment are also highly associated with mortality, it is important to perform separate Cox analyses by specific treatment type.
In both patients who received surgery and patients who received conservative treatment, the patients with low and middle incomes had relatively higher HRs for mortality than others with high incomes. Interestingly, the magnitudes of increasing HRs for mortality in low- and middle-income groups among surgical treatment groups are higher than those in the conservative treatment group. Since the primary goal for surgical treatment is to make the patients resume normal activity and daily life without serious discomfort, and ultimately reduce the mortality rate, the differences in HRs by income level are a matter of great concern in public health. According to studies of other medical conditions, the postoperative outcome is associated with SES as well as preexisting medical conditions.[24,25] Moreover, the higher mortality rate for surgery after femur fracture in Italy has been shown to be related to lower SES.[26] Korean femur-fracture patients with National Medical Aid, the public health coverage system for the poor, had a 30% higher risk of mortality after femur fracture than those with NHI.[27] However, this previous Korean study did not have a distinguishable individual income variable, which our study has.
Although the clear mechanism between low SES and high mortality rate among femur-fracture patients has remained unknown, we can suggest some possible explanations. One is that hospitals are located in areas where patients of lower SES live. In Korea, hospital profit is mainly derived from out-of-pocket money from patients, because of low coverage rates in universal health coverage. This less-favorable inflow may translate into lower operating margin and less capacity to invest in infrastructure associated with higher surgical quality. Some of these structural components, such as health professionals staffing in the intensive care unit, nurse staffing, and technology in postoperative care, are well known predictors of lower surgical mortality rates.[28,29]
Another possibility is participation in appropriate rehabilitation programs following surgery. In the cases of cardiovascular and cancer patients, rehabilitation services are not equally distributed by SES group, even after adjustment for other demographic characteristics and medical conditions.[30,31] According to the study from the United States, femur-fracture patients with low SES, such as Black, Hispanic, and Medicaid patients, had lower use of institutional care, which has the more dramatic outcomes than home care.[32] Through rehabilitation programs, patients are able to increase performance in daily life and reduce the reoccurrence of fractures, which is consequently associated with lower mortality rates.
This study has several limitations. First, we could not adjust for the daily activities for each patient, such as activities of daily living or instrumental activities of daily living. These are related to the incidence of femur fracture and overall mortality rate in the elderly population. Nevertheless, we took into account the other medical conditions and general health of all participants using the CCI and the medical history of neurodegenerative disorders, which are among the most well known predictors for survival among femur-fracture patients. Second, there are some issues with using administrative claim data. The reliance on the ICD-10 code for femur fracture might yield some misclassification due to the unavoidable miscoding in claim data, whether intended or unintentional. However, through the efforts of both the government and hospitals, nearly 70% of primary, secondary, and tertiary diagnosis codes from claims records coincide with those from medical records in hospitals.[33] Third, we could not account for femur-fracture patients who did not use health facilities in spite of the fracture. However, since femur fracture is life threatening, it was assumed that virtually all femur-fracture patients visited healthcare facilities. Finally, we did not clearly suggest the higher HR in middle-income than another in high-income patients, although it was not statistically meaningful. One possible hypothesis is that the adjusted variables are not enough to control different characteristics across 3 income groups. However, we still need some further investigations for this result.
In spite of these limitations, our study had a number of key strengths. First, it is the first investigation to reveal the association between individual SES using income and probability of receiving surgery and probability of mortality after femur fracture, by type of treatment, in a developed Asian society. Although 1 study had already looked at the incidence of and mortality after femur fracture, the researchers did not concretely specify indicator variables for individual SES and analyzed only the patients who underwent surgical treatment alone. Second, our results are highly representative because we used data from nationwide claim data and because the target population had been identified by random stratified sampling methods. Third, as the study design is an observational cohort study, the association between the independent variables and survival is more confirmative than in a cross-sectional study. Fourth, we used survival and medical history data from national statistics and the NHI, which are the most accurate survival and disease databases. Therefore, our data on previous medical conditions and mortality were highly reliable.
5. Conclusion
In summary, femur-fracture patients with low SES were less likely to get surgical treatment and had higher mortality rates, compared with patients with high SES. Moreover, after surgical treatment, the difference in survival between low/middle and high SES groups was still apparent. This suggests that further investigation is needed to reveal the exact mechanism relating SES and femur fracture survival. It is also necessary to consider support measures to increase the probability of surgery and survival among patients with low SES.
Supplementary Material
Footnotes
Abbreviations: CCI = Charlson Comorbidity Index, CI = confidence interval, EDI = electronic data interchange, HR = hazard ratio, ICD = International Classification of Diseases, MRI = magnetic resonance imaging, NHI = National Health Insurance, OR = odds ratio, SES = socioeconomic status.
JS and YC are the co–first authors.
IRB statement: All authors are approved to use the data, and the ethical board of Graduate School of Public Health in Yonsei University granted this study (2-1040939-AB-N-01-2014-239).
The authors have no funding and conflicts of interest to disclose.
Supplemental Digital Content is available for this article.
References
- [1].(OECD) OfEC-oad. Health at a Glance 2013: OECD Indicators. 2015. [Google Scholar]
- [2].Melton LJ, 3rd, Gabriel SE, Crowson CS, et al. Cost-equivalence of different osteoporotic fractures. Osteoporos Int 2003;14:383–8. [DOI] [PubMed] [Google Scholar]
- [3].Roberts SE, Goldacre MJ. Time trends and demography of mortality after fractured neck of femur in an English population, 1968–98: database study. BMJ 2003;327:771–5. [DOI] [PMC free article] [PubMed] [Google Scholar]
- [4].Kang BJ, Lee YK, Lee KW, et al. Mortality after hip fractures in nonagenarians. J Bone Metab 2012;19:83–6. [DOI] [PMC free article] [PubMed] [Google Scholar]
- [5].Tosteson AN, Burge RT, Marshall DA, et al. Therapies for treatment of osteoporosis in US women: cost-effectiveness and budget impact considerations. Am J Manag Care 2008;14:605–15. [PubMed] [Google Scholar]
- [6].Burge R, Dawson-Hughes B, Solomon DH, et al. Incidence and economic burden of osteoporosis-related fractures in the United States, 2005–2025. J Bone Miner Res 2007;22:465–75. [DOI] [PubMed] [Google Scholar]
- [7].Kang HY, Park SE, Kang DR, et al. Estimating medical expenditure associated with osteoporotic hip fracture in elderly Korean women based on the National Health Insurance Claims Database 2002–2004. Value Health 2009;12suppl 3:S93–96. [DOI] [PubMed] [Google Scholar]
- [8].Commission on Social Determinants of Health. Commission on Social Determinants of Health—Final Report. Geneva, Switzerland: Commission on Social Determinants of Health; 2008. [Google Scholar]
- [9].Araujo AB, Yang M, Suarez EA, et al. Racial/ethnic and socioeconomic differences in bone loss among men. J Bone Miner Res 2014;29:2552–60. [DOI] [PubMed] [Google Scholar]
- [10].Brennan SL, Henry MJ, Wluka AE, et al. BMD in population-based adult women is associated with socioeconomic status. J Bone Miner Res 2009;24:809–15. [DOI] [PubMed] [Google Scholar]
- [11].Brennan SL, Winzenberg TM, Pasco JA, et al. Social disadvantage, bone mineral density and vertebral wedge deformities in the Tasmanian Older Adult Cohort. Osteoporos Int 2013;24:1909–16. [DOI] [PubMed] [Google Scholar]
- [12].Ha YC, Park YG, Nam KW, et al. Trend in hip fracture incidence and mortality in Korea: a prospective cohort study from 2002 to 2011. J Korean Med Sci 2015;30:483–8. [DOI] [PMC free article] [PubMed] [Google Scholar]
- [13].Hagino H, Furukawa K, Fujiwara S, et al. Recent trends in the incidence and lifetime risk of hip fracture in Tottori, Japan. Osteoporos Int 2009;20:543–8. [DOI] [PubMed] [Google Scholar]
- [14].van der Steen JT, van Soest-Poortvliet MC, Hallie-Heierman M, et al. Factors associated with initiation of advance care planning in dementia: a systematic review. J Alzheimers Dis 2014;40:743–57. [DOI] [PubMed] [Google Scholar]
- [15].Legare F, Ratte S, Stacey D, et al. Interventions for improving the adoption of shared decision making by healthcare professionals. Cochrane Database Syst Rev 2010. Cd006732. [DOI] [PubMed] [Google Scholar]
- [16].Ampe S, Sevenants A, Coppens E, et al. Study protocol for ’we DECide’: implementation of advance care planning for nursing home residents with dementia. J Adv Nurs 2015;71:1156–68. [DOI] [PubMed] [Google Scholar]
- [17].Mariconda M, Costa GG, Cerbasi S, et al. The determinants of mortality and morbidity during the year following fracture of the hip: a prospective study. Bone Joint J 2015;97-b:383–90. [DOI] [PubMed] [Google Scholar]
- [18].de Palma L, Torcianti M, Meco L, et al. Operative delay and mortality in elderly patients with hip fracture: an observational study. Eur J Orthop Surg Traumatol 2014;24:783–8. [DOI] [PubMed] [Google Scholar]
- [19].Chopra I, Kamal KM, Sankaranarayanan J, et al. Factors associated with primary hip arthroplasty after hip fracture. Am J Manag Care 2013;19:e74–84. [PubMed] [Google Scholar]
- [20].Liu SS, Della Valle AG, Besculides MC, et al. Trends in mortality, complications, and demographics for primary hip arthroplasty in the United States. Int Orthop 2009;33:643–51. [DOI] [PMC free article] [PubMed] [Google Scholar]
- [21].Jain NB, Losina E, Ward DM, et al. Trends in surgical management of femoral neck fractures in the United States. Clin Orthop Relat Res 2008;466:3116–22. [DOI] [PMC free article] [PubMed] [Google Scholar]
- [22].Hu F, Jiang C, Shen J, et al. Preoperative predictors for mortality following hip fracture surgery: a systematic review and meta-analysis. Injury 2012;43:676–85. [DOI] [PubMed] [Google Scholar]
- [23].Stewart NA, Chantrey J, Blankley SJ, et al. Predictors of 5 year survival following hip fracture. Injury 2011;42:1253–6. [DOI] [PubMed] [Google Scholar]
- [24].Birkmeyer NJ, Gu N, Baser O, et al. Socioeconomic status and surgical mortality in the elderly. Med Care 2008;46:893–9. [DOI] [PubMed] [Google Scholar]
- [25].Reames BN, Birkmeyer NJ, Dimick JB, et al. Socioeconomic disparities in mortality after cancer surgery: failure to rescue. JAMA Surg 2014;149:475–81. [DOI] [PMC free article] [PubMed] [Google Scholar]
- [26].Barone AP, Fusco D, Colais P, et al. Effects of socioeconomic position on 30-day mortality and wait for surgery after hip fracture. Int J Qual Health Care 2009;21:379–86. [DOI] [PubMed] [Google Scholar]
- [27].Kang HY, Yang KH, Kim YN, et al. Incidence and mortality of hip fracture among the elderly population in South Korea: a population-based study using the national health insurance claims data. BMC Public Health 2010;10:230. [DOI] [PMC free article] [PubMed] [Google Scholar]
- [28].Bellomo R, Goldsmith D, Uchino S, et al. Prospective controlled trial of effect of medical emergency team on postoperative morbidity and mortality rates. Crit Care Med 2004;32:916–21. [DOI] [PubMed] [Google Scholar]
- [29].Jones D, Opdam H, Egi M, et al. Long-term effect of a Medical Emergency Team on mortality in a teaching hospital. Resuscitation 2007;74:235–41. [DOI] [PubMed] [Google Scholar]
- [30].Moustsen IR, Larsen SB, Vibe-Petersen J, et al. Social position and referral to rehabilitation among cancer patients. Acta Oncol 2015;54:720–6. [DOI] [PubMed] [Google Scholar]
- [31].Wolf SL, Sahu K, Bay RC, et al. The HAAPI (Home Arm Assistance Progression Initiative) Trial: a novel robotics delivery approach in stroke rehabilitation. Neurorehabil Neural Repair 2015;29:958–68. [DOI] [PMC free article] [PubMed] [Google Scholar]
- [32].Freburger JK, Holmes GM, Ku LJ. Postacute rehabilitation care for hip fracture: who gets the most care? J Am Geriatr Soc 2012;60:1929–35. [DOI] [PMC free article] [PubMed] [Google Scholar]
- [33].JY K. Strategies to Enhance the use of National Health Insurance Claims Database in Generating Health Statistics. Korea: Health Insurance Review and Assessment Services; 2005. [Google Scholar]
Associated Data
This section collects any data citations, data availability statements, or supplementary materials included in this article.


