Abstract
Three-dimensional (3D) transesophageal echocardiography (TEE) is the gold standard for mitral valve (MV) anatomic and functional evaluation. Currently, dedicated MV analysis software has limitations for its use in clinical practice. Thus, we tested here a complete and reproducible evaluation of a new fully automatic software to characterize MV anatomy in different forms of mitral regurgitation (MR) by 3D TEE.
Sixty patients were included: 45 with more than moderate MR (28 organic MR [OMR] and 17 functional MR [FMR]) and 15 controls. All patients underwent TEE. 3D MV images obtained using 3D zoom were imported into the new software for automatic analysis. Different MV parameters were obtained and compared. Anatomic and dynamic differences between FMR and OMR were detected. A significant increase in systolic (859.75 vs 801.83 vs 607.78 mm2; P = 0.002) and diastolic (1040.60 vs. 1217.83 and 859.74 mm2; P < 0.001) annular sizes was observed in both OMR and FMR compared to that in controls. FMR had a reduced mitral annular contraction compared to degenerative cases of OMR and to controls (17.14% vs 32.78% and 29.89%; P = 0.007). Good reproducibility was demonstrated along with a short analysis time (mean 4.30 minutes).
Annular characteristics and dynamics are abnormal in both FMR and OMR. Full 3D software analysis automatically calculates several significant parameters that provide a correct and complete assessment of anatomy and dynamic mitral annulus geometry and displacement in the 3D space. This analysis allows a better characterization of MR pathophysiology and could be useful in designing new devices for MR repair or replacement.
Keywords: automatic software, mitral valve, 3-dimensional transesophageal echocardiography
1. Introduction
The mitral annulus (MA) plays a critical role in mitral valve (MV) function. Its saddle shape and nonplanar configuration, along with leaflet billowing, work together to optimize leaflet curvature, reducing leaflet stress.[1] Improvements in 3-dimensional (3D) echocardiography allow noninvasive evaluation of the 3D geometry of the mitral apparatus in the clinical setting.[2–4] Different studies characterizing the MA dynamics and anatomy in mitral regurgitation (MR) have shown a clear differential behavior in functional mitral regurgitation (FMR) and organic MR (OMR).[5,6] This has been proven in humans, but also in animal models where the importance of MA dynamics in the surgical approach with different annuloplasty rings has been shown.[7–10]
Despite advances in real-time 3D transesophageal echocardiography (TEE) that allow acquisition of high-quality images in 1 single beat, fully automatic and reproducible software analysis is lacking. Current technologies allow manual or automatic measurements of different MV apparatus structures. However, manual measurements are limited to some simple measurements at 1 point of the cardiac cycle and automatic measurements require training, expertise, and excellent image quality and are time consuming. For this reason, quantitative evaluation of the MV is rarely performed in clinical practice despite its potential impact in patient management and surgical approach.
Recently, new fully automatic software for mitral and aortic valve analysis has been evaluated in several studies with promising results for its use in clinical practice.[11–13] It allows fast and automatic quantitation of different MV components from 3D TEE images, with minimal human intervention, and seems to overcome many of the limitations of available software so far. Thus, the aim of the present study was to evaluate the feasibility of this new software to analyze MA dynamics in significant FMR and OMR and to correctly identify each of them, to provide additional noncurrently available parameters of MV function with possible clinical impact, and to evaluate reproducibility and time to perform the full analysis as a surrogate of its potential clinical applicability.
2. Methods
2.1. Study population
The present study was approved by the Ethics Committee of the Hospital Universitario Ramón y Cajal, Madrid, Spain. A total of 125 consecutive patients with MR as main indication referred to our Cardiac Imaging Unit for TEE from January 2013 to March 2015 were initially screened for this study. Patients were selected based on TEE performance with an iE33 or an EPIQ 7 ultrasound imaging system (Philips Medical System, Andover, MA), excluding patients with previous MV replacement, significant mitral stenosis, MR severity less than moderate, frame rate <7 volumes/s, and severe calcific valvular disease, and patients who did not have a 3D zoom image of the MV. The remaining 59 patients with moderate or severe regurgitation and with zoom 3D of MV images were enrolled in the present study. Of these 59 patients, we excluded 3 patients for technical problems (i.e., incorrect digital format) and 11 patients for poor-quality 3D images (e.g., incomplete imaging of the MA) or poor image quality for the software automatic quantification. Thus, the final study population consisted of a total of 45 patients. Fifteen patients referred for TEE with normal anatomic and functional MV were included as control subjects (Fig. 1). Clinical data of all patients were collected from electronic medical reports for the present study. All patients signed an informed consent.
Figure 1.
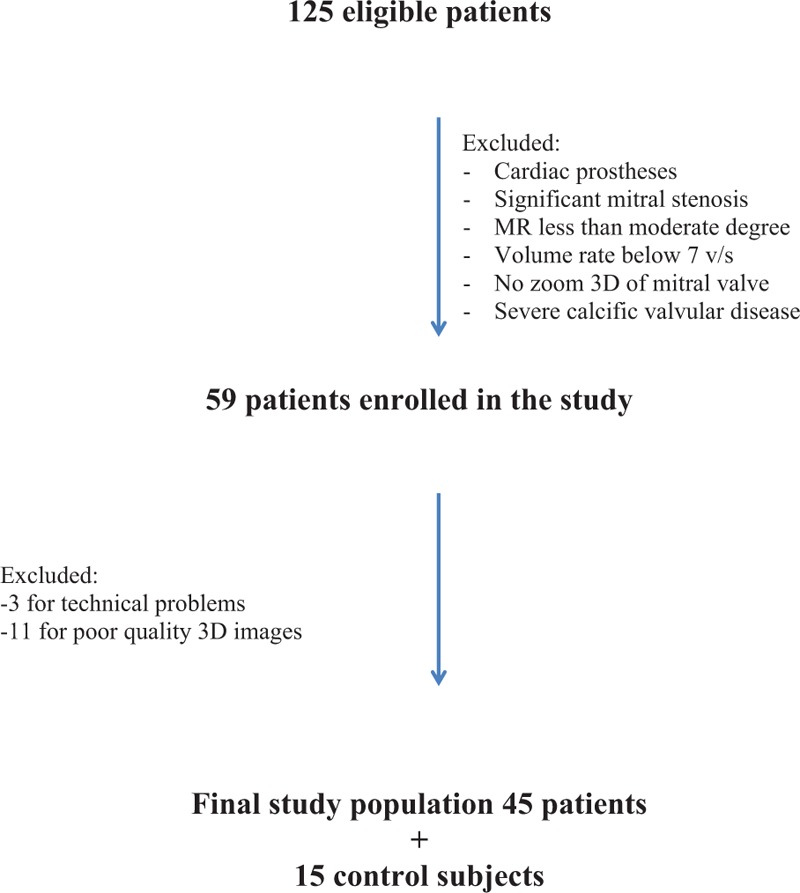
Patient's inclusion algorithm. 3D = 3-dimensional.
2.2. Image acquisition
All patients underwent TEE according to the European Association of Cardiovascular Imaging guidelines[14] using a multiplane transesophageal 7X-2t matrix probe. Both clinical TEE examination and 3D MV images were recorded according to the performing physician. 3D MV images were obtained using 3D zoom modalities acquired over 1 cardiac cycle with a frame rate average of 22 volumes/s except for 3 patients for whom the images were obtained over 4 cardiac cycles. Full-volume 3D data sets were digitally stored and transferred to a workstation for offline analysis.
2.3. Image analysis
In each subject the highest quality 3D images were selected for the analysis. After importing the images into the software (eSie Valves, Autovalve prototype version 1.22, Siemens Medical Solutions, Malvern, PA), the MV is shown in different views. The analysis was done by the same observer (IA). A second observer (LMR), blinded to the results previously obtained, analyzed a subset of 21 patients randomly selected for interobserver reproducibility assessment. Initial recognition of the MV within the RT3DE data set was performed automatically by detection of 7 major landmarks of the MV annulus and leaflets for each frame.[12] The major landmarks are as follows: the left trigone, the right trigone, the middle of the posterior annulus, the leaflet tips of the anterior and posterior leaflet in the plane between the middle of the posterior and the anterior annulus, and the 2 commissures. In addition to these 7 major landmarks, a total of 459 landmarks of the MV annulus are detected automatically in 50 differently orientated planes over each frame to depict detailed morphology of the MV (Figs. 2 and 3; Table 1). From the calculated mitral annular area (MAA) values throughout a cardiac cycle, the maximum and minimum MAA values were extracted. Mitral annulus contraction was expressed as the percentage change in MA area between maximum and minimum values {([maximum MAA] − [minimum MAA])/[maximum MAA] × 100}. In the same way, we calculated the percentage change in the other parameters. Sphericity index was manually calculated as the ratio between anteroposterior and anterolateral–posteromedial diameters.
Figure 2.
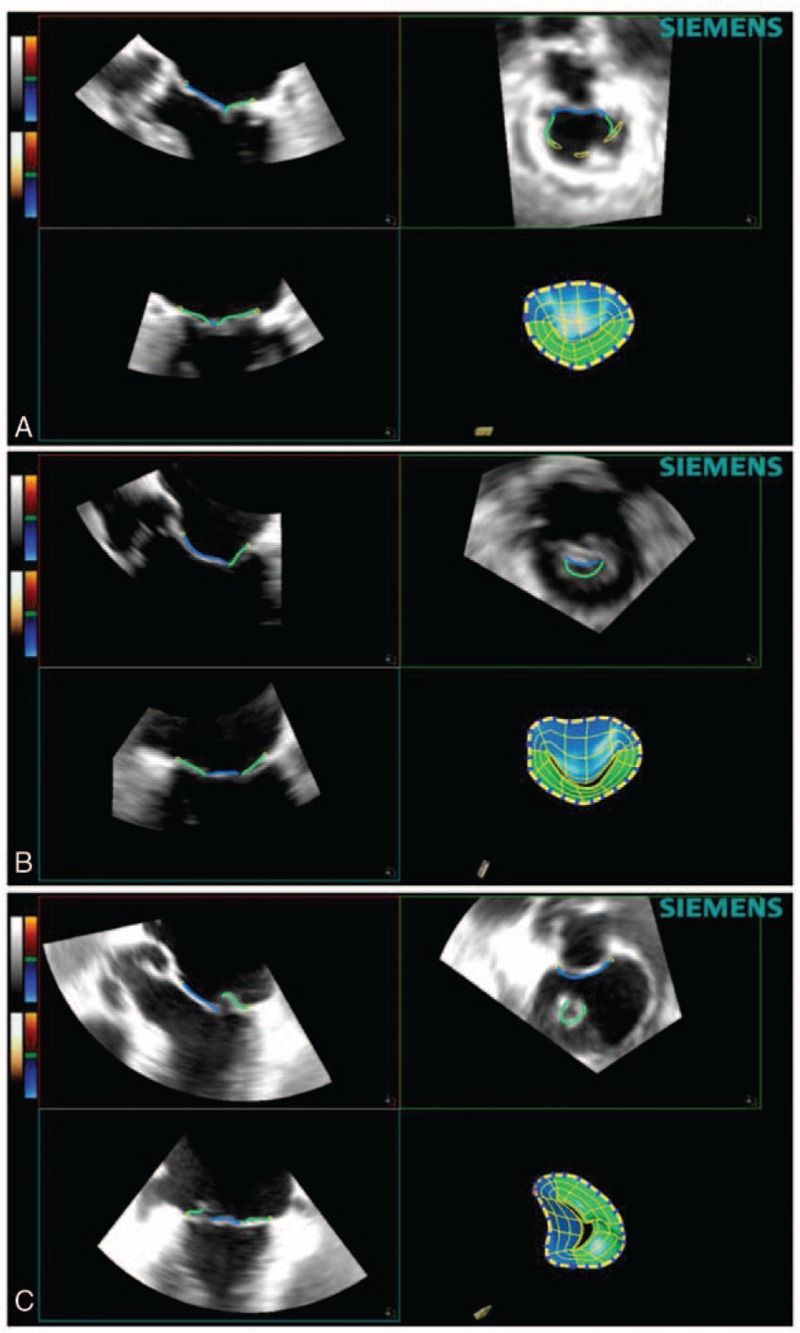
Software mitral valve reconstruction image of a normal patient (A), functional mitral regurgitation patient (B), and degenerative mitral valve patient (C).
Figure 3.
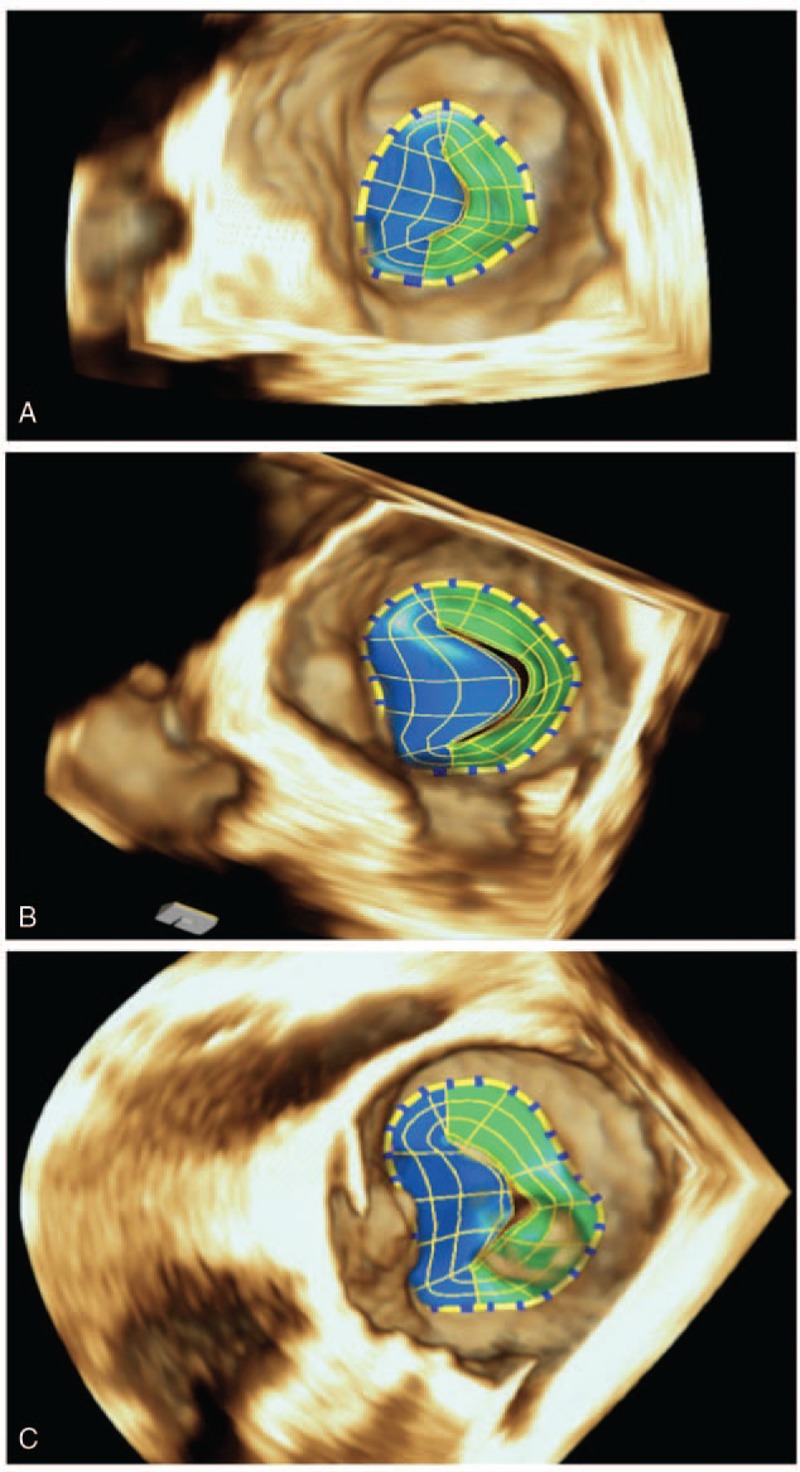
Final 3D mitral valve reconstruction model in a normal patient (A), functional mitral regurgitation (B), and degenerative mitral valve patient (C). 3D = 3-dimensional.
Table 1.
Annular mitral valve automatic software parameters analyzed.

Time consumed to perform the complete offline data set analysis was measured with a digital stopwatch.
2.4. Statistical analysis
eSie Valves automated software tracks the MV during the whole cardiac cycle and provides information for each parameter during every frame. Maximal and minimum values during systole and diastole were considered for the statistical analysis. Data were summarized as the mean ± standard deviation (SD) or number of cases (percentage) for continuous or categorical variables, respectively. The analysis focused on characterizing MV annulus in patients with MR and comparing it with the annulus of normal control subjects. Patients with MR were subsequently classified based on etiology in OMR or FMR groups. A paired Student t test and analysis of variance (ANOVA) were used for intergroup comparisons of each annular measure and analyzed differences in annular dynamics through the cardiac cycle. P values <0.05 were considered statistically significant for prespecified study comparisons. Post hoc Bonferroni correction was used when appropriate. To assess the reproducibility of the parameters measured using eSie Valves software, the data of 21 patients were reanalyzed by a second observer (LMR) blinded to the results of the first observer. Interobserver reproducibility was reported as the absolute difference of the corresponding pair of repeated measurements normalized to their average value in each patient and expressed as mean ± SD for the entire population. Data analysis was performed using SPSS version 22.0 (SPSS Inc, Chicago, IL) and Stata SE version 12.0 (StataCorp, College Station, TX) statistical software.
3. Results
3.1. Study population
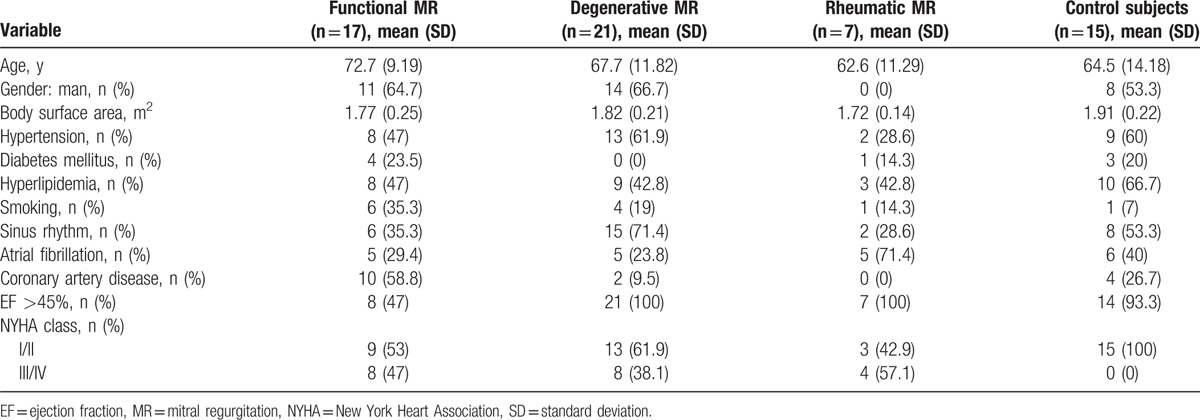
The main characteristics of the 45 patients with OMR and FMR and of the 15 control subjects are shown in Table 2. All patients with OMR and FMR had moderate to severe MR. The degree of MR was assessed quantitatively, with mean effective regurgitant orifice area of 0.59 ± 0.30 by 2D imaging and 0.58 ± 0.38 by 3D imaging in OMR patients, and of 0.19 ± 0.08 and 0.37 ± 0.16 in FMR patients, respectively. OMR was further divided into degenerative or rheumatic according to MR etiology. In degenerative MR, the lesions were prolapse/flail of P2 segment in 7 patients (33.3%), of P3 in 3 patients (14.3%), of A2 in 2 patients (9.6%), and multisegment in 9 patients (42.8%). In 15 control subjects without MV structural disease, the echocardiographic evaluation was performed to assess potential cardioembolic source (n = 13) or to exclude endocarditis (n = 2).
Table 2.
Population clinical characteristics.
3.2. Static annular geometry comparison
All analyzed annular parameters (Table 1) were significantly different in MR patients as compared with those in control patients. ANOVA showed significant intergroup differences for functional, degenerative, and rheumatic MR in all annular measurements (P < 0.05 for all) except for MA height to commissural width (systolic and diastolic time) and height of MA (systolic time). These results are summarized in Table 3.
Table 3.
Annular parameters.
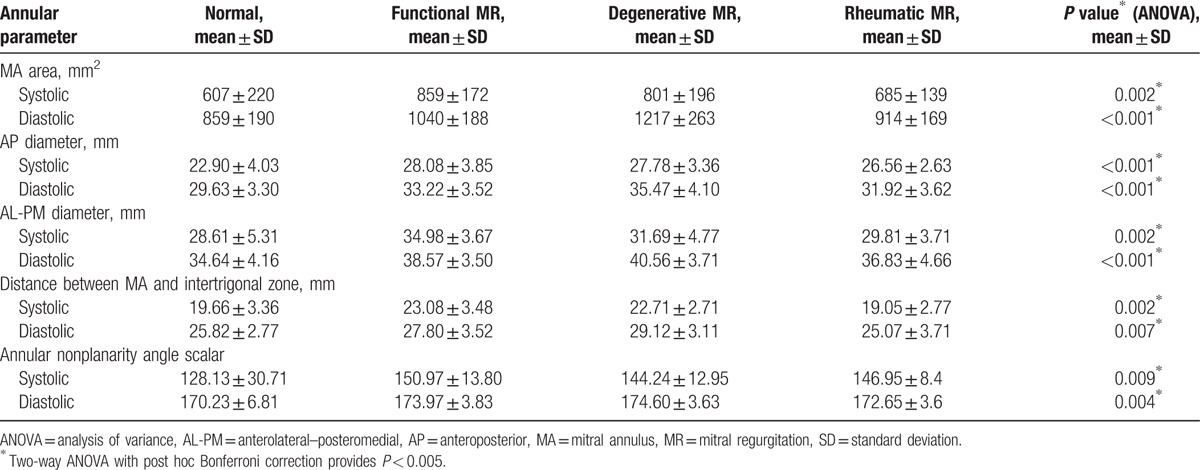
Both OMR (degenerative and rheumatic diseases) and FMR annuli were larger than normal annuli for all software parameter analyses (Table 3). The automated software analysis in FMR and in degenerative disease MR showed a significant increase in annular size when compared to that in controls (859.75 and 801.83 vs 607.78 mm2; P = 0.002) during systole and (1040.60 vs. 1217.83 and 859.74 mm2; P < 0.001) in diastole. Comparison of values in FMR versus OMR and controls showed that annular anterolateral–posteromedial diameter (34.98 vs 31.69 and 28.61 mm; P < 0.002), anteroposterior diameter (28.08 vs 27.78 and 22.90 mm; P = 0.001), the distance between MA and intertrigone (23.08 vs 22.71 and 19.66 mm; P = 0.002), and annular nonplanarity angle scalar (150.97° vs 144.24° and 128.13°; P = 0.009) in systole were significantly increased in FMR patients. An opposite behavior was noted in diastolic time in the OMR annuli parameters where the automated software analysis demonstrated in degenerative disease a larger value in comparison with FMR and controls in the following: annular anterolateral–posteromedial diameter, anteroposterior diameter (40.56 vs 38.57 and 34.64 mm; 35.47 vs 33.22 and 29.63 mm; P < 0.001 for all), annulus height (8.09 vs 6.07 and 7.1 mm; P = 0. 009), distance between MA and intertrigone (29.12 vs 27.80 and 25.82 mm; P = 0.007), and annular nonplanarity angle scalar (176.14° vs 173.97° and 170.23°; P = 0.004).
Significant differences were also noted in the annular sphericity index among different forms of MR (minimum 0.79 and maximum 0.85 FMR vs minimum 0.87 and maximum 0.87 prolapse), confirming that FMR annuli behavior is different depending on the MR etiology.
3.3. Dynamic change comparison
Patients with FMR had a reduced mitral annular contraction compared to those with degenerative MR and to controls (17.14% vs 32.78% and 29.89%; P = 0.007). On the other hand, ANOVA showed a significant change in the annular anterolateral–posteromedial diameter (9.3% vs 21.81% and 17.58%; P < 0.001), in the annulus height (50.08% vs 62.70% and 61.06%; P < 0.05), in the distance between MA and intertrigone (17.02% vs 21.79% and 23.93%; P = 0.007), in the annular nonplanarity angle scalar (13.25% vs 18.11% and 24.70%; P = 0.026), and in the total leaflet area (23.99% vs 38.67% and 34.36%; P = 0.002), respectively, in FMR versus degenerative MR and control group (Table 4; Fig. 4). Interestingly, there was no significant difference in change of the anteroposterior diameter (19.49% vs 24.73%; P = 0.059). These findings confirm that FMR annulus has lost 3D geometry and minimal displacement by dilating in an anterior to posterior direction. The opposite behavior was noted in the degenerative disease where the dynamic change indexes showed a greater mitral annular contraction when compared to FMR as well as controls (Table 4; Fig. 4).
Table 4.
Dynamic change comparison.

Figure 4.
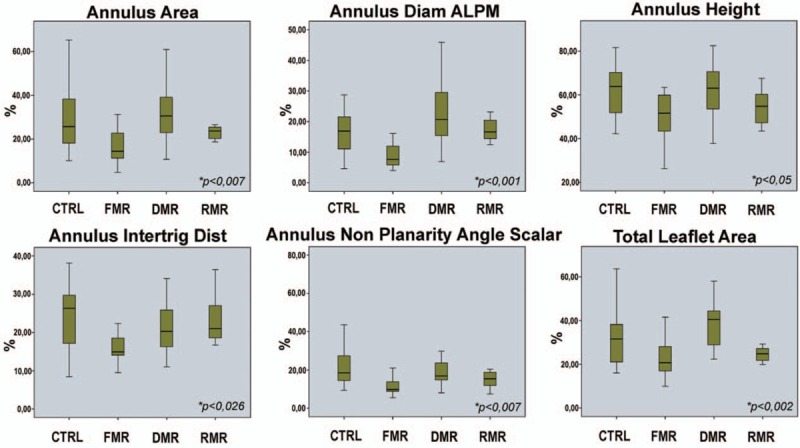
Cumulative data of the percentage dynamic changes of selected mitral valve parameters between the groups included in the study. CTRL = control, DMR = degenerative mitral regurgitation, FMR = functional mitral regurgitation, RMR = rheumatic mitral regurgitation.
3.4. Time of analysis
The time required for offline data set analysis including time for uploading images using eSie Valves software was 4 minutes and 30 ± 27 seconds. Manual optimization of boundary detection with eSie Valves software after automatic processing was required only in 14% of cases. Manual adjustment when required slightly increased the analysis time in comparison with fully automated eSie Valves software (<1 minute in all cases).
3.5. Reproducibility
The interobserver agreements, expressed in terms of the mean difference ± 2 SD (upper and lower limits of agreement) for eSie Valves software, were as follows: 0.06% (−2.5% to 2.4%) for maximal MA area, 0.5% (−3.3% to 4.3%) for maximal anteroposterior diameter, 0.4% (−0.8% to 0.67%) for maximal anterolateral–posteromedial diameter, 0.8 (−14.4% to 16.1%) for maximal intertrigonal distance, and 0.06 (−0.3% to 0.47%) for maximal nonplanarity angle scalar.
4. Discussion
In the current study, we assessed the MV annulus through a comprehensive automatic 3D imaging analysis in normal subjects and in patients with MR. The main findings of this analysis are as follows: this 3D automated software is able to correctly evaluate MA anatomy and function in different MR etiologies; MA dynamics are abnormal in OMR and FMR patients with significant differences in MA behavior between the 2 groups that allow to correctly discriminate among the 2 etiologies; and the automated software is reproducible and fast in the calculation of different MV parameters, many of them never analyzed before, allowing a better understanding of MR pathophysiology with possible clinical implications.
Characterization of MV anatomy and function is crucial for understanding MR pathophysiology and to decide best therapeutic approach in a given patient. Different 3D echo-based studies have shown the differential behavior of MV apparatus between different forms of MR, mainly OMR and FMR. Most studies, however, were performed in selected centers, with small number of patients and using semiautomatic software that require expertise and are time consuming. Moreover, 1 additional limitation of previous reports is the lack of an adequate number of parameters able to describe with complete accuracy and precision the annular physiology.[15,16] Our study confirms the ability of the new automatic software in analyzing MV annulus in different forms of MR and normal MV patients. Our results are in agreement with previous reports showing a difference in MV anatomy between normal patients and patients with significant MR. In the same line, our results confirm a clear different function of MV annulus between FMR and OMR: contractility of MA is attenuated in FMR and this reduction of annular contractility is significantly associated with loss of a physiologic morphology. Our findings support previous studies showing that mitral annular dysfunction and attenuated motion also play an important role in the development of FMR.[17,18] Indeed, alterations in MA size and shape contribute to the development of FMR as an adjunctive mechanism.[19,20] We show with the 3D software analysis that the annular dilatation is not limited to the anterior–posterior region but it extends to intertrigonal zone with loss of the typical saddle shape of the MA. The latter is well indicated by longer distance between MA and intertrigonal zone, bigger annular nonplanarity scalar angle, and increased anteroposterior and anterolateral–posteromedial diameters (Table 3). Additional to a decrease in MA contractility, smaller changes along the cardiac cycle were noted in annular nonplanarity angle scalar as well as in annular height, distance between MA and intertrigonal zone, and the anterolateral–posteromedial diameter (Fig. 3). The MA in FMR is static, losing the typical saddle-shape conformation throughout the cardiac cycle as it dilates and flattens.
Conversely, MA in degenerative disease shows at the diastolic time a greater MA area and longer anteroposterior and anterolateral–posteromedial diameters (Table 3). However, MV dynamics in our series show significant differences compared to those in normal patients (Table 4). These findings suggest that MV degenerative is associated with MA enlargement in the presence of a preserved dynamic MA function. This phenomenon was previously described by Ormiston et al,[21] showing that MV prolapse is associated with primary or intrinsic annular dilatation rather than with an annular dilatation secondary to left atrial or left ventricular enlargement.
Our results are in agreement with recent studies that have demonstrated that MA remodeling and deformation differ depending on the MR etiology. Patients with MR have significant MA enlargement irrespective of MV etiology, but in contrast to the significant increase shown in the degenerative MR group during diastole, patients with FMR demonstrated a smaller reduction in annular size during systole and a marked difference in dynamic area contraction.[22–24]
To the best of our knowledge, the current study is the first to examine at the same time a multitude of MA parameters in MR patients. This is possible due to the use of the described fully automatic 3D software analysis. The latter provides incremental information to describe abnormal annular geometry and behavior in MR. The software provides reliable and useful parameters of the MA such as distance between MA and intertrigonal zone, annular nonplanarity angle scalar, and change in annular height. These parameters cannot be assessed manually or with the available semiautomatic software. Their integration is clinically useful as it helps in understanding the mechanisms of FMR and OMR. These findings could be helpful in the design of rings or devices for MA distortion in FMR or OMR and in the reduction of postoperative recurrence of MR. Being fully automatic, reproducibility is high as proved in our study, which along with short time of analysis supports its use in clinical practice.
4.1. Study limitations
The present work mainly focused on the evaluation of the MA as assessed by the automatic software in distinguishing between OMR and FMR. However, the software provides a handful number of different parameters on the several components of the MV. Thus, it remains open to assess other MV components as additional or surrogate to discern among different MR etiologies. It should also be pointed out that in the present study we did not compare software measurements with pathologic findings during cardiac surgery or with a gold standard imaging able to define a correct validation of the automatic software measurements. However, we would like to point out that the new eSie Valves software has proved to be reproducible in MV anatomic evaluation.[25] Furthermore, the software is equally working in patients with aortic valve calcification. Indeed, our group demonstrated that this automatic software allows modeling and quantification of the aortic root from 3D TEE data with high reproducibility in patients who underwent transcatheter aortic valve implantation.[13] Yet a direct evaluation through cardiac surgery confirmation would be needed to assess accuracy of the software measurements. In the present study, we aimed at providing a correct and complete assessment of the anatomy as well as of the dynamic MA geometry and displacement in the 3D space, showing annular characteristics and dynamics abnormal in both FMR and OMR. We did not perform an intraobserver analysis as our previous study specifically evaluated interobserver and intraobserver reproducibility of this full-automated software in the evaluation of MV anatomy compared to routine clinical manual 3D assessment. In that study, the intraobserver variability was good for both methods with a better level of agreement with the automatic software.[25] Thus, these data show that this novel 3D automated software is reproducible in MV anatomy assessment. Finally it has to be noted that the software requires high quality of 3D TEE images and the need to include the entire MV annulus in the acquired volume, to assess a correct analysis of several MV parameters over the cardiac cycle. The latter somehow still limits the application of this software for all patients to be assessed.
5. Conclusions
Overall here we show that annular characteristics and dynamics are abnormal in both FMR and OMR. In FMR the annulus remains static, while on the other hand in degenerative MR the annulus is hyperdynamic. Full 3D software analysis automatically calculates several significant parameters that are sufficient for a successful and complete assessment of dynamic MA geometry and displacement in the 3D space. This new software allows a fast, complete, and reproducible evaluation of MV anatomy and function. This thorough 3D automatic evaluation of the annulus is able to provide a better characterization of the pathophysiology of MR discriminating among OMR and FMR and could be useful in designing new devices for MR repair or replacement. Indeed, the knowledge of the MV anatomy and function as provided by the automatic software will be essential to not only guide surgical treatment and define surgical repair technique but also decide type of ring or prostheses. The data presented may also play a role in developing specific devices for MV disease where a deep analysis of anatomy and function of the valve is needed.
Footnotes
Abbreviations: 3D = 3-dimensional, FMR = functional mitral regurgitation, MA = mitral annulus, MAA = mitral annular area, MR = mitral regurgitation, MV = mitral valve, OMR = organic mitral regurgitation, SD = standard deviation, TEE = transesophageal echocardiography.
The authors have no conflicts of interest to disclose.
References
- [1].Salgo IS, Gorman JH, 3rd, Gorman RC, et al. Effect of annular shape on leaflet curvature in reducing mitral leaflet stress. Circulation 2002;106:711–7. [DOI] [PubMed] [Google Scholar]
- [2].Kaplan SR, Bashein G, Sheehan FH, et al. Three-dimensional echocardiographic assessment of annular shape changes in the normal and regurgitant mitral valve. Am Heart J 2000;139:378–87. [DOI] [PubMed] [Google Scholar]
- [3].Otsuji Y, Handschumacher MD, Liel-Cohen N, et al. Mechanism of ischemic mitral regurgitation with segmental left ventricular dysfunction: three-dimensional echocardiographic studies in models of acute and chronic progressive regurgitation. Am Coll Cardiol 2001;37:641–8. [DOI] [PubMed] [Google Scholar]
- [4].Kwan J, Shiota T, Agler DA, et al. Geometric differences of the mitral apparatus between ischemic and dilated cardiomyopathy with significant mitral regurgitation: real-time three-dimensional echocardiography study. Circulation 2003;107:1135–40. [DOI] [PubMed] [Google Scholar]
- [5].Grewal J, Suri R, Mankad S, et al. Mitral annular dynamics in myxomatous valve disease: new insights with real-time 3-dimensional echocardiography. Circulation 2010;121:1423–31. [DOI] [PubMed] [Google Scholar]
- [6].Veronesi F, Corsi C, Sugeng L, et al. Quantification of mitral apparatus dynamics in functional and ischemic mitral regurgitation using real-time 3-dimensional echocardiography. J Am Soc Echocardiogr 2008;21:347–54. [DOI] [PubMed] [Google Scholar]
- [7].Messas E, Guerrero JL, Handschumacher MD, et al. Paradoxic decrease in ischemic mitral regurgitation with papillary muscle dysfunction: insights from three-dimensional and contrast echocardiography with strain rate measurement. Circulation 2001;104:1952–7. [DOI] [PubMed] [Google Scholar]
- [8].Messas E, Pouzet B, Touchot B, et al. Efficacy of chordal cutting to relieve chronic persistent ischemic mitral regurgitation. Circulation 2003;108suppl 1:II111–5. [DOI] [PubMed] [Google Scholar]
- [9].Timek TA, Glasson JR, Lai DT, et al. Annular height-to-commissural width ratio of annulolasty rings in vivo. Circulation 2005;112(9 suppl):I423–8. [DOI] [PubMed] [Google Scholar]
- [10].Eckert CE, Zubiate B, Vergnat M, et al. In vivo dynamic deformation of the mitral valve annulus. Ann Biomed Eng 2009;37:1757–71. [DOI] [PMC free article] [PubMed] [Google Scholar]
- [11].Noack T, Kiefer P, Ionasec R, et al. New concepts for mitral valve imaging. Ann Cardiothorac Surg 2013;2:787–95. [DOI] [PMC free article] [PubMed] [Google Scholar]
- [12].Noack T, Mukherjee C, Kiefer P, et al. Four-dimensional modelling of the mitral valve by real-time 3D transoesophageal echocardiography: proof of concept. Interact Cardiovasc Thorac Surg 2015;20:200–8. [DOI] [PubMed] [Google Scholar]
- [13].García-Martín A, Lázaro-Rivera C, Fernández-Golfín C, et al. Accuracy and reproducibility of novel echocardiographic three-dimensional automated software for the assessment of the aortic root in candidates for thanscatheter aortic valve replacement. Eur Heart J Cardiovasc Imaging 2016;17:772–8. [DOI] [PubMed] [Google Scholar]
- [14].Flachskampf FA, Badano L, Daniel WG, et al. Recommendations for transoesophageal echocardiography: update 2010. Eur J Echocardiogr 2010;11:557–76. [DOI] [PubMed] [Google Scholar]
- [15].Daimon M, Saracino G, Fukuda S, et al. Dynamic change of mitral annular geometry and motion in ischemic mitral regurgitation assessed by a computerized 3D echo method. Echocardiography 2010;27:1069–77. [DOI] [PubMed] [Google Scholar]
- [16].Little SH, Ben Zekry S, Lawrie GM, et al. Dynamic annular geometry and function in patients with mitral regurgitation: insight from three-dimensional annular tracking. J Am Soc Echocardiogr 2010;23:872–9. [DOI] [PubMed] [Google Scholar]
- [17].Gorman JH, 3rd, Jackson BM, Enomoto Y, et al. The effect of regional ischemia on mitral valve annular saddle shape. Ann Thorac Surg 2004;77:544–8. [DOI] [PubMed] [Google Scholar]
- [18].Tibayan FA, Rodriguez F, Langer F, et al. Annular remodeling in chronic ischemic mitral regurgitation: ring selection implications. Ann Thorac Surg 2003;76:1549–54. [DOI] [PubMed] [Google Scholar]
- [19].Otsuji Y, Kumanohoso T, Yoshifuku S, et al. Isolated annular dilation does not usually cause important functional mitral regurgitation: comparison between patients with lone atrial fibrillation and those with idiopathic or ischemic cardiomyopathy. J Am Coll Cardiol 2002;39:1651–6. [DOI] [PubMed] [Google Scholar]
- [20].Watanabe N, Ogasawara Y, Yamaura Y, et al. Mitral annulus flattens in ischemic mitral regurgitation: geometric differences between inferior and anterior myocardial infarction: a real-time 3-dimensional echocardiographic study. Circulation 2005;112(9 suppl):I458–62. [DOI] [PubMed] [Google Scholar]
- [21].Ormiston JA, Shah PM, Tei C, et al. Size and motion of the mitral valve annulus in man. II. Abnormalities in mitral valve prolapse. Circulation 1982;65:713–9. [DOI] [PubMed] [Google Scholar]
- [22].Kwan J, Qin JX, Popović ZB, et al. Geometric changes of mitral annulus assessed by real-time 3-dimensional echocardiography: becoming enlarged and less nonplanar in the anteroposterior direction during systole in proportion to global left ventricular systolic function. J Am Soc Echocardiogr 2004;17:1179–84. [DOI] [PubMed] [Google Scholar]
- [23].Levack MM, Jassar AS, Shang EK, et al. Three-dimensional echocardiographic analysis of mitral annular dynamics: implication for annuloplasty selection. Circulation 2012;126(11 suppl 1):S183–8. [DOI] [PMC free article] [PubMed] [Google Scholar]
- [24].Lancellotti P, Zamorano JL, Vannan MA. Imaging challenges in secondary mitral regurgitation: unsolved issues and perspectives. Circ Cardiovasc Imaging 2014;7:735–46. [DOI] [PubMed] [Google Scholar]
- [25].Aquila I, González A, Fernández-Golfín C, et al. Reproducibility of a novel echocardiographic 3D automated software for the assessment of mitral valve anatomy. Cardiovasc Ultrasound 2016;14:17. [DOI] [PMC free article] [PubMed] [Google Scholar]


