Abstract
To compare diagnostic performance and confidence of a standard visual reading and combined 3-dimensional stereotactic surface projection (3D-SSP) results to discriminate between Alzheimer disease (AD)/mild cognitive impairment (MCI), dementia with Lewy bodies (DLB), and frontotemporal dementia (FTD).
[18F]fluorodeoxyglucose (FDG) PET brain images were obtained from 120 patients (64 AD/MCI, 38 DLB, and 18 FTD) who were clinically confirmed over 2 years follow-up. Three nuclear medicine physicians performed the diagnosis and rated diagnostic confidence twice; once by standard visual methods, and once by adding of 3D-SSP. Diagnostic performance and confidence were compared between the 2 methods.
3D-SSP showed higher sensitivity, specificity, accuracy, positive, and negative predictive values to discriminate different types of dementia compared with the visual method alone, except for AD/MCI specificity and FTD sensitivity. Correction of misdiagnosis after adding 3D-SSP images was greatest for AD/MCI (56%), followed by DLB (13%) and FTD (11%). Diagnostic confidence also increased in DLB (visual: 3.2; 3D-SSP: 4.1; P < 0.001), followed by AD/MCI (visual: 3.1; 3D-SSP: 3.8; P = 0.002) and FTD (visual: 3.5; 3D-SSP: 4.2; P = 0.022). Overall, 154/360 (43%) cases had a corrected misdiagnosis or improved diagnostic confidence for the correct diagnosis.
The addition of 3D-SSP images to visual analysis helped to discriminate different types of dementia in FDG PET scans, by correcting misdiagnoses and enhancing diagnostic confidence in the correct diagnosis. Improvement of diagnostic accuracy and confidence by 3D-SSP images might help to determine the cause of dementia and appropriate treatment.
Keywords: Alzheimer disease, brain PET, dementia with Lewy bodies, FDG, frontotemporal dementia
1. Introduction
The use of [18F]fluorodeoxyglucose (FDG) positron emission tomography (PET) is increasing in the assessment of patients with neurodegenerative disorders. Because cerebral glucose metabolism predicts cognitive decline and is closely related to disease severity,[1–3] FDG PET has become an important biomarker of neurodegeneration or neuronal injury.[4] FDG PET scans show characteristic patterns of glucose hypometabolism based on the types of dementia present.[5] Previous studies have demonstrated that FDG PET is useful for accurate diagnosis and differentiation of dementia,[6] which is important because it affects patient management and therapy. However, the accurate diagnosis and differentiation of dementia is very difficult at early stage even by FDG PET brain imaging.
Many researchers have developed computer-assisted analysis systems for FDG PET brain imaging. Automatic software tools such as 3-dimensional stereotactic surface projection (3D-SSP) have improved diagnostic accuracy for Alzheimer disease (AD) by brain perfusion single-photon emission computed tomography and FDG PET.[7–12] However, previous FDG PET studies using 3D-SSP focused mainly on AD or mild cognitive impairment (MCI),[9–13] and discriminating AD from dementia with Lewy bodies (DLB) and frontotemporal dementia (FTD), which are frequently occurring types of dementia, has not been comprehensively evaluated. The aim of this retrospective study was to compare the diagnostic performance and confidence of a standard visual reading and combined 3D-SSP to discriminate between AD/MCI, DLB, and FTD by 3 readers based on clinical follow-up in a dementia clinic.
2. Methods
2.1. Study population
This retrospective analysis was approved by our institutional review board. Subjects who were referred to the Nuclear Medicine Department of our hospital from 2009 to 2013 for FDG PET/computed tomography (CT) brain imaging were consecutively selected. FDG PET/CT brain imaging was performed within 2 months from the Mini-Mental State Examination (MMSE). From these subjects, those confirmed as AD/MCI, DLB, or FTD were enrolled. Clinical diagnosis was performed with more than 2 years of regular follow-up by a dementia expert with over 20 years of experience. Patients who had a prior cerebral infarction on brain magnetic resonance imaging or unmet diagnostic criteria were excluded. On the basis of these selection criteria, 120 patients – 64 with AD/MCI, 38 with DLB, and 18 with FTD – were selected.
2.2. Image acquisition
All subjects fasted for at least 4 hours before the procedure and their blood glucose was <160 mg/dL at the time of the scan. Subjects were injected with 185 to 370 MBq of 18F-FDG, and followed by 30 minutes resting in a quiet, dimly lit room. Brain PET/CT scans were acquired using a dedicated PET/CT scanner (Discovery STE, GE Healthcare). Emission scans were started 30 minutes after injection and data were acquired for 10 minutes in the 3-dimensional mode. Images were reconstructed using an ordered subset expectation maximization (OSEM) algorithm. Attenuation correction was based on the CT scan and scatter correction was performed using standard software as supplied by the scanner manufacturer.
2.3. Image processing
For the visual analysis, 47 transaxial PET images with 2 different color displays were prepared as screen-captured images, where the highest pixel value in the scan was set to the highest value on each color scale. For the preparation of 3D-SSP results, commercially available CortexID software (GE Medical) was used. The activities of each PET image were normalized by pons and compared with normal age-matched databases for FDG PET. Both metabolic maps and statistical maps were provided to readers.
2.4. Image reading
PET interpretations were performed by 3 nuclear medicine physicians with high (reader 1), intermediate (reader 2), and low (reader 3) levels of experience in the evaluation of FDG PET brain imaging. Reader 3 underwent training with educational cases of each disease for 1 hour before reading. A total of 120 PET scans were interpreted twice by the three readers; once by visual mode, and a month later after randomization of the order of cases, by visual mode combined with 3D-SSP images in order to minimize recall bias. Captured transaxial images were provided in the visual mode, whereas both transaxial images and two 3D-SSP maps (metabolic map and statistical map with z-scores) were provided in the 3D-SSP mode. Readers were blinded to the clinical information in order to validate the effects of 3D-SSP results for the diagnosis of dementia, compared with the results of visual interpretation alone. The readers were asked to make a diagnosis and to rate their confidence level in each analysis method. The readers were informed that all subjects had a clinically confirmed diagnosis of AD/MCI, DLB, or FTD, but they did not know the proportions of subjects with each diagnosis. To rate diagnostic confidence, a 5-point scale ranging from extremely uncertain (1) to extremely certain (5), was employed.
2.5. Statistical analysis
Continuous variables were expressed as the mean ± standard deviation (SD), and categoric variables were expressed as frequencies and percentages. Comparisons between methods, types of dementia and readers were performed using the chi-square test or Fisher exact test for categoric variables and analysis of variance for continuous variables. Paired comparisons between classifiers for sensitivity, specificity, positive predictive value (PPV), and negative predictive value (NPV) were performed by Fisher exact tests. The paired t test was used to compare the change in confidence rating. Statistical analysis was performed using SPSS software (version 21.0, NY).
3. Results
3.1. Study population
The clinical characteristics of the patients are listed in Table 1. A total of 120 included patients had a mean (±SD) age of 73.28 ± 9.19 year. Patients with AD/MCI and DLB were older than those with FTD (P = 0.002). Patients with AD/MCI were followed up for longer than those with DLB or FTD by a dementia expert (P = 0.054). Gender (P = 0.877), education (P = 0.133), and MMSE (P = 0.178) were not significantly different between AD/MCI, DLB, and FTD.
Table 1.
Clinical characteristics.

3.2. Visual versus 3D-SSP methods: diagnostic performance
True positive, true negative, false positive, and false negative cases between visual and 3D-SSP methods in each disease and each reader are presented in Table 2. Compared to the visual method, true positive cases in AD/MCI, true positive and true negative cases in DLB, and true negative cases in FTD were increased using the 3D-SSP method for total cases. However, true negative cases in AD/MCI and true positive cases in FTD were slightly decreased using 3D-SSP method.
Table 2.
Contingency table for diagnoses using the visual and 3D-SSP methods.

Comparison of diagnostic performance between the visual and 3D-SSP methods for each disease are shown in Table 3. Sensitivity, specificity, accuracy, PPV, and NPV using the 3D-SSP method were mostly increased using the 3D-SSP method compared with the visual method, but the specificity of AD/MCI and sensitivity of FTD were decreased, and the NPV of FTD was unchanged. In particular, both specificity (P = 0.013) and PPV (P = 0.058) of DLB using the 3D-SSP method were significantly higher than by the visual method.
Table 3.
Comparisons of diagnostic performance between the visual and 3D-SSP methods.

3.3. Correction of misdiagnosis after 3D-SSP method
There were 168 falsely diagnosed cases (54 cases in AD/MCI, 79 in DLB, and 35 in FTD) when using the visual method among 360 cases by each of the 13 readers. Upon using the 3D-SSP method (Fig. 1), 30/54 misdiagnosed cases in AD/MCI (56%), 10/79 misdiagnosed cases in DLB (13%), and 4/35 misdiagnosed cases in FTD (11%) were changed to a correct diagnosis. The 3D-SSP method was the most beneficial for correcting misdiagnosis of AD/MCI. Results of the analysis by each reader showed that 18/50 misdiagnosis by reader 1 (36%), 12/60 misdiagnosis in reader 2 (20%), and 14/58 misdiagnosis by reader 3 (24%) were changed to a correct diagnosis after using the 3D-SSP method. There were no significant difference in the rate of correction of misdiagnosis between the 3 readers (P = 0.174).
Figure 1.
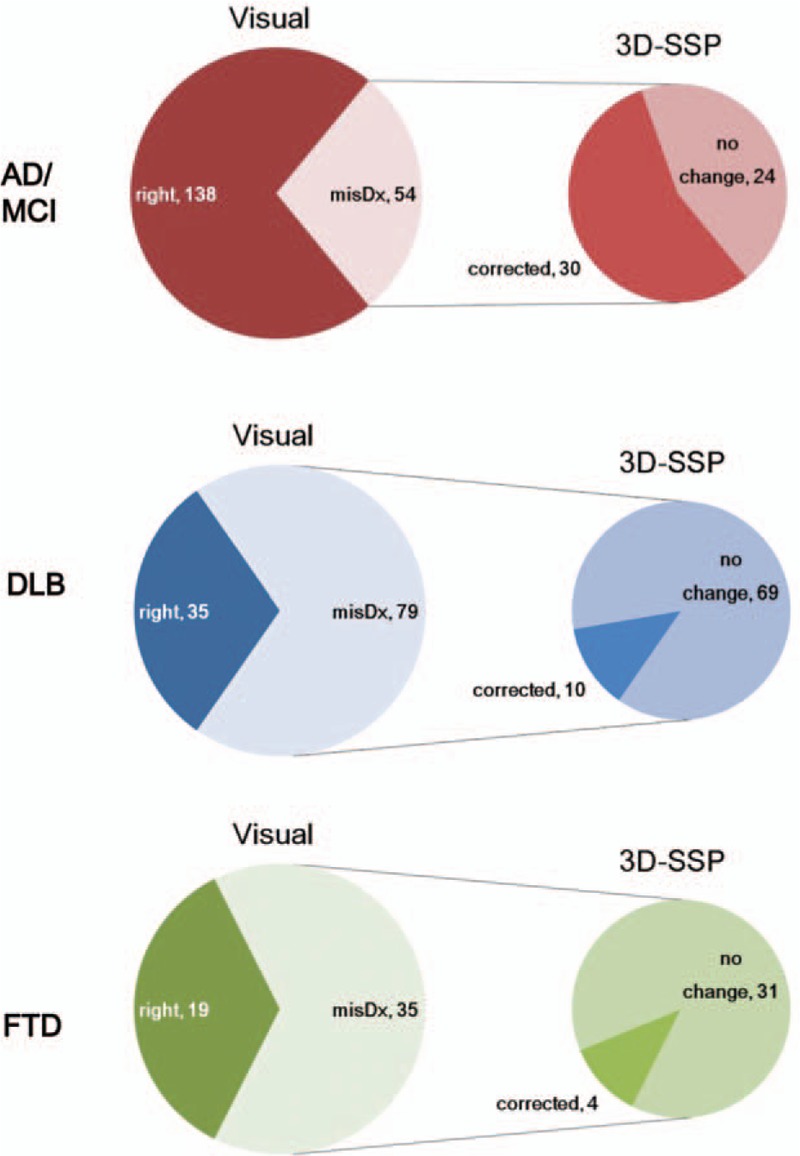
Diagnosis with the visual method and correction of misdiagnosis after using the 3D-SSP method. AD/MCI had 138 correctly diagnosed and 54 misdiagnosed cases using the visual method, but 30/54 misdiagnosed cases were corrected after using the 3D-SSP method (top row). DLB had 35 correctly diagnosed and 79 misdiagnosed cases using the visual method, but 10/79 misdiagnosed cases were corrected after using the 3D-SSP method (middle row). FTD had 19 correctly diagnosed and 35 misdiagnosed cases using the visual method, but 4/35 misdiagnosed cases were corrected after using the 3D-SSP method (bottom row). AD = Alzheimer disease, DLB = dementia with Lewy bodies, 3D-SSP = 3-dimensional stereotactic surface projection, FTD = frontotemporal dementia, MCI = mild cognitive impairment.
3.4. Visual versus 3D-SSP methods: diagnostic confidence
Compared to the visual method, 3D-SSP increased the diagnostic confidence for all types of dementia and all readers. Diagnostic confidence for DLB showed the greatest increase (visual: 3.2; 3D-SSP: 4.1, P < 0.001), followed by AD/MCI (visual: 3.1; 3D-SSP: 3.8, P = 0.002), and FTD (visual: 3.5; 3D-SSP: 4.2, P = 0.022) when using the 3D-SSP method. Confidence scores of all readers were higher with the 3D-SSP method than with the visual method. The increment of diagnostic confidence for each reader was the largest for reader 3 (1.367, P < 0.001), followed by reader 2 (0.542, P < 0.001), and reader 1 (0.425, P < 0.001) for all cases. The diagnostic confidence of each reader for each disease when using the visual and 3D-SSP methods are presented in detail in Fig. 2.
Figure 2.
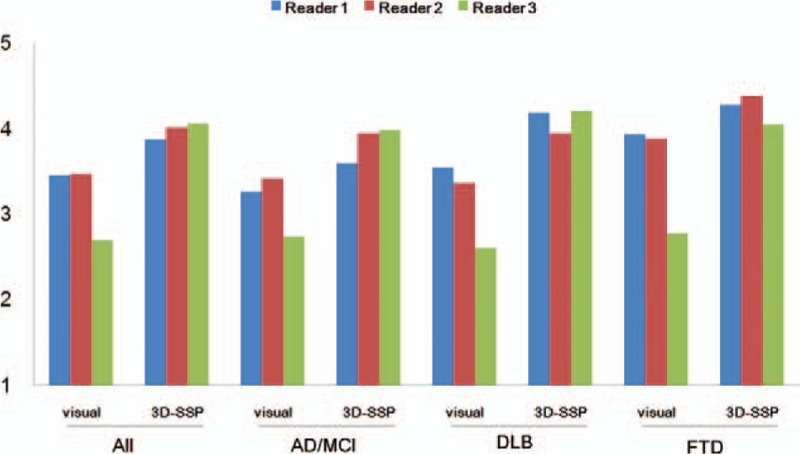
Comparison of diagnostic confidence with the visual and 3D-SSP methods. Compared to the visual method, all diagnostic confidence scores of the 3D-SSP method were significantly increased for all types of dementia and for all readers. The greatest increase in diagnostic confidence was in the DLB group and in reader 3 (green). DLB = dementia with Lewy bodies, 3D-SSP = 3-dimensional stereotactic surface projection.
3.5. Overall effect of 3D-SSP methods
Use of the 3D-SSP method allowed the readers to correct their misdiagnosis and be more confident in their correct diagnosis. Figure 3 shows the changes in the diagnosis and confidence ratings after the addition of 3D-SSP images among the 3 readers. Reader 1 changed his diagnosis appropriately in 18/50 misdiagnosed cases (36%, green color in Fig. 3), and had a higher confidence in the correct diagnosis of 37/70 cases (53%, yellow color in Fig. 3) after using the 3D-SSP method. In sum, 55/120 cases (46%) benefited from the 3D-SSP method for reader 1. Reader 2 changed his diagnosis appropriately in 12/60 misdiagnosed cases (20%), and had a higher confidence in 28/60 cases (47%) after using the 3D-SSP method. Forty out of 120 cases (33%) benefited from the 3D-SSP method for reader 2. Reader 3 changed his diagnosis appropriately in 14/58 misdiagnosed cases (24%), and had a higher confidence in 45/62 cases (73%) after using the 3D-SSP method. Fifty-nine (49%) out of 120 cases were benefited from the 3D-SSP method in reader 3. Overall, 154/360 cases (43%) had either a corrected their misdiagnosis or improved diagnostic confidence for the correct diagnosis.
Figure 3.
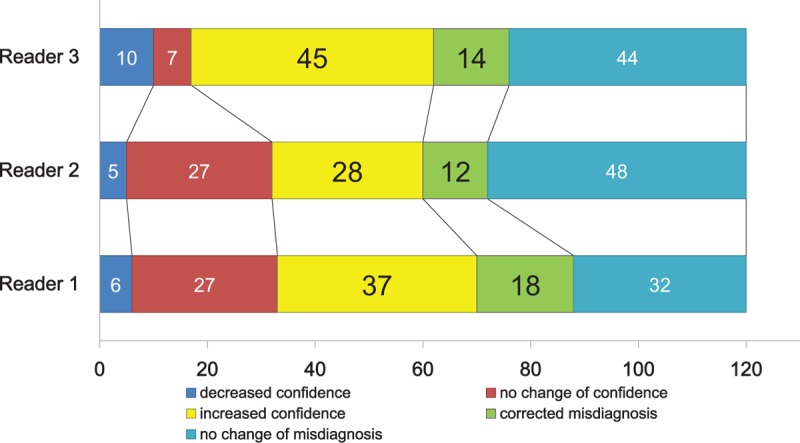
Changes in initial diagnosis and confidence after using the 3-dimensional stereotactic surface projection (3D-SSP) method. Reader 1 (bottom row) changed his diagnosis appropriately in 18 cases (36%, green), and had higher confidence in 37/70 correctly diagnosed cases (53%, yellow) by using the 3D-SSP method; therefore, 55/120 cases (46%) benefited from the 3D-SSP method. Reader 2 (middle row) changed his diagnosis appropriately in 12 cases (20%, green), and had higher confidence in 28/60 correctly diagnosed cases (47%, yellow) by using the 3D-SSP method; therefore, 40/120 cases (33%) benefited from the 3D-SSP method. Reader 3 (top row) changed his diagnosis appropriately in 14 cases (24%, green), and had higher confidence in 45/62 correctly diagnosed cases (73%) by using the 3D-SSP method, so 59 (49%) out of 120 cases were benefited from the 3D-SSP method. The greatest benefit from using 3D-SSP method was found for reader 3.
4. Discussion
This study demonstrates that the use of 3D-SSP is helpful for the diagnosis of dementia in the evaluation of FDG PET brain imaging. 3D-SSP showed a higher sensitivity, specificity, accuracy, PPV, and NPV when discriminating between different types of dementia compared with visual inspection alone for most of the cases. By using 3D-SSP images, misdiagnosed cases were likely being changed to the correct diagnosis and their diagnostic confidence was enhanced significantly.
The 3D-SSP method provided a better diagnostic accuracy and performance than the visual method for most cases, and 3D-SSP images were helpful for the correction of misdiagnosed cases. The superior performance of 3D-SSP is attributable to the easier-to-understand and more objective presentation of the abnormalities of decreased glucose metabolism sites. The 3D-SSP images with z-scores clearly showed a metabolic decrease which is difficult to discriminate by transaxial images. A previous study using brain perfusion single-photon emission computed tomography reported was easier to discriminate the presence of occipital flow reduction by z-score map on 3D-SSP than by standard transaxial display.[14] Our study had 32 false-positive cases of DLB using the visual method, but 18/32 false-positive cases (56%) were changed to a correct diagnosis after using the 3D-SSP method (Fig. 4). 3D-SSP images might be able to detect the absence of significant metabolic reduction in false-positive cases with DLB, contributing to the increased specificity from 87% to 94% (P = 0.013, Table 3) in DLB cases.
Figure 4.
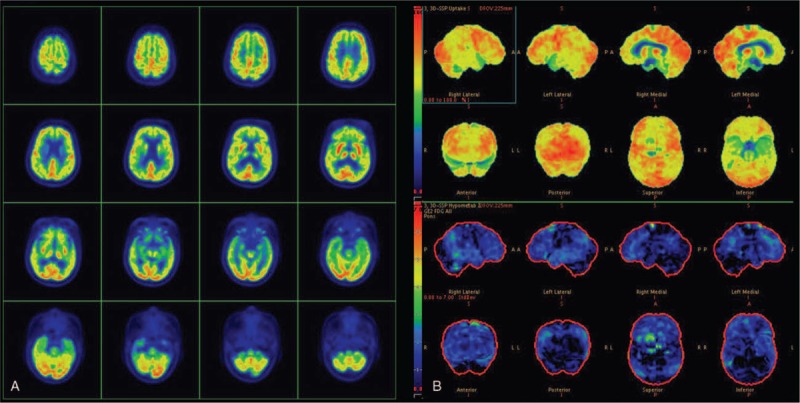
Transaxial images (A) and 3-dimensional stereotactic surface projection (3D-SSP) maps (B) of a 70-year-old woman finally diagnosed as Alzheimer disease after a 5-year clinical follow-up. All readers misdiagnosed with dementia with Lewy bodies on transaxial images, due to the relative sparing of the posterior cingulate cortex along with metabolic reduction in the surrounding cortex. However, 3D-SSP maps showed no hypometabolism in the occipital cortex, but indicated mild hypometabolism in both parietotemporal association cortices, consistent with the pattern observed in Alzheimer disease. All readers corrected their diagnoses to Alzheimer disease for this case.
Another finding of this study was that the correction of misdiagnosis after 3D-SSP images was the greatest in AD/MCI (56%, Fig. 1), followed by DLB and FTD. AD and MCI typically show a metabolic reduction in the parietotemporal cortex, precuneus and posterior cingulate gyrus.[15–18] In particular, posterior cingulate hypometabolism is among the most common findings in early AD.[19] The evaluation of posterior cingulate gyrus and precuneus by visual inspection of the transaxial images is very difficult.[14] However, glucose hypometabolism in the parietotemporal lobe as well as posterior cingulate gyrus and precuneus can be presented more easily using 3D-SSP images.[20–22] Our study had 16 MCI (25%) out of 64AD/MCI cases, and the MMSE score of the AD/MCI group was the highest among the 3 groups. During the earlier stages of AD/MCI, it is difficult to make a diagnosis using only transaxial images, but 3D-SSP images could detect the metabolic reduction with a greater sensitivity at the posterior cingulate gyrus and precuneus area. Therefore, the AD/MCI group benefited the most from the correction of misdiagnosis among the 3 groups after adding 3D-SSP images.
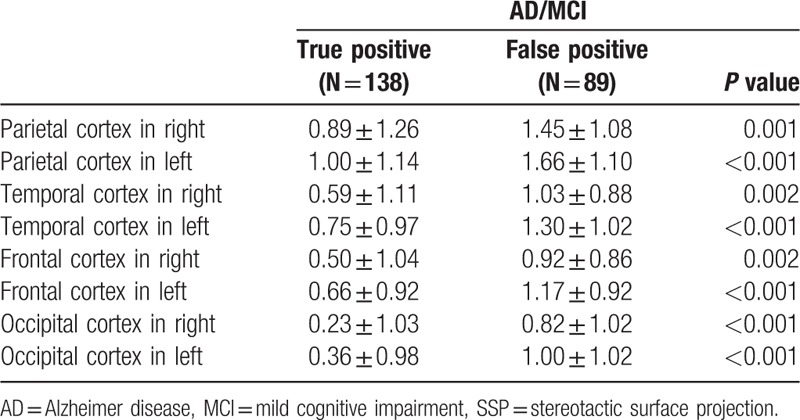
Despite the better diagnostic performance of 3D-SSP compared with the transaxial images for most cases, the specificity of AD/MCI and the sensitivity of FTD were not better. In the AD/MCI group, the specificity decreased from 47% to 43% after using the 3D-SSP method (Table 3). The decrease in specificity is attributable to the diffuse metabolic reduction over all brain cortices in the false positives in the AD/MCI group. Z-scores in the parietal, temporal, frontal, and occipital areas on the 3D-SSP map of a true positive with AD/MCI were significantly higher than for false positive cases (Table 4). The metabolic reduction in the brain of false positive cases was associated with the lower specificity of the 3D-SSP method. In the FTD group, sensitivity was not enhanced after using the 3D-SSP method. Because false negatives with FTD had a metabolic reduction pattern, this method might be more favorable for AD or DLB.[23,24] False negative cases, misdiagnosed as AD, showed higher z-scores than that of true positive cases with FTD in the parietal area (1.66 ± 1.21 vs 0.67 ± 1.06, P = 0.005), suggestive of AD. The other false negative cases, misdiagnosed as DLB, showed higher z-score than that of true positive cases with FTD in the occipital area (−0.18 ± 0.90 vs 0.68 ± 0.75, P = 0.048), suggestive of DLB. This deceptive metabolic reduction pattern of false negative cases with FTD was associated with the lower sensitivity of the 3D-SSP method. Our results suggest that the 3D-SSP images might lead to a false diagnosis for a small number of cases, although the majority benefited from the use of 3D-SSP.
Table 4.
Z-scores on SSP maps between true positive and false positive cases with AD/MCI.
We found that diagnostic confidence was increased for every dementia type and for every reader after using the 3D-SSP method. Diagnostic confidence has a significant impact on the treatment of disease. Physicians who are more confident in their diagnosis are more likely to institute and sustain therapy. Diagnostic confidence was increased for all types of dementia after using 3D-SSP images, but the highest increase in confidence was observed in the DLB group (0.9 ± 0.6 for DLB, 0.7 ± 0.6 for AD/MCI, and 0.7 ± 0.9 for FTD). The least experienced reader in our study had the highest increase in diagnostic confidence after adding 3D-SSP images (1.4 ± 1.6 for reader 3, 0.5 ± 0.8 for reader 2, and 0.4 ± 0.9 for reader 1). Our results suggest that the addition of 3D-SSP images may be helpful to improve the diagnostic confidence in all types of dementia but also to provide greatest confidence to a less experienced reader for the correct diagnosis by the visual analysis.
Our study indicated a poorer diagnostic performance for the visual analysis compared to previous studies.[7,10,13,25–27] Previous researchers compared the diagnostic performance based on clinical data and the addition of a PET examination. When they made a diagnosis for the PET scan, the clinical information was already available to the readers and this may lead to case recall in the second diagnostic step. However, this study was designed as a blinded study, so the readers had no access to clinical information. There are common situations wherein many patients open their medical records of neuropsychiatric symptoms for review by a few authorized physicians in many medical centers. Thus, radiologists may not be able to access clinical information of patients with dementia. Therefore, here we studies pure impact of 3D-SSP analysis without considering clinical information in PET-based diagnoses, even though this type of analysis has lower diagnostic performance, because the amount of clinical information provided to the radiologists may affect the results of the diagnosis. Another reason for the lower diagnostic performance in our study compared with previous studies is the clinical characteristics of the enrolled subjects. Enrolled subjects in our study had uncertain and indefinite diagnosis based on clinical data, and the patients who were diagnosed based on clinical findings did not undergo PET examination. Thus, the patients in our study were more likely to be at the early stages of dementia compared to the previous studies including histopathologically confirmed patients. The absence of histopathologic confirmation and retrospective analysis performed in 1 medical center in patients limited to those with AD/MCI, DLB, and FTD were limitations of this study.
5. Conclusion
The addition of 3D-SSP images to the visual analysis is helpful in discriminating between different types of dementia in the evaluation of FDG PET brain imaging. Furthermore, 3D-SSP images enhance the diagnostic confidence of both experienced and less experienced readers. The improvement of diagnostic accuracy and confidence by using 3D-SSP images might favorably help patients by determining the cause of dementia and providing accurate treatment.
Acknowledgments
The authors thank statistical advice for this manuscript from our statistician (Professor Myung Hwan Na, Department of statistics, Chonnam National University, Korea).
Footnotes
Abbreviations: AD = Alzheimer disease, CT = computed tomography, DLB = dementia with Lewy bodies, 3D-SSP = 3-dimensional stereotactic surface projection, FDG = [18F]fluorodeoxyglucose, FTD = frontotemporal dementia, MCI = mild cognitive impairment, MMSE = Mini-Mental State Examination, PET = positron emission tomography.
Funding/support: This work was supported by the Nuclear Safety Research Program through the Korea Radiation Safety Foundation (KORSAFe) and the Nuclear Safety and Security Commission (NSSC), Republic of Korea (Grant No. 1305033).
The funder had no role in the study design, data collection and analysis, decision to publish, or preparation of the manuscript.
The authors have no conflicts of interest to disclose.
References
- [1].Chetelat G, Desgranges B, de la Sayette V, et al. Mild cognitive impairment: can FDG-PET predict who is to rapidly convert to Alzheimer's disease? Neurology 2003;60:1374–7. [DOI] [PubMed] [Google Scholar]
- [2].Drzezga A, Lautenschlager N, Siebner H, et al. Cerebral metabolic changes accompanying conversion of mild cognitive impairment into Alzheimer's disease: a PET follow-up study. Eur J Nucl Med Mol Imaging 2003;30:1104–13. [DOI] [PubMed] [Google Scholar]
- [3].Landau SM, Harvey D, Madison CM, et al. Comparing predictors of conversion and decline in mild cognitive impairment. Neurology 2010;75:230–8. [DOI] [PMC free article] [PubMed] [Google Scholar]
- [4].Jack CR, Jr, Albert MS, Knopman DS, et al. Introduction to the recommendations from the National Institute on Aging-Alzheimer's Association workgroups on diagnostic guidelines for Alzheimer's disease. Alzheimers Dement 2011;7:257–62. [DOI] [PMC free article] [PubMed] [Google Scholar]
- [5].Grassetto G, Marzola MC, Musto A, et al. Non-Alzheimer types of neurodegenerative dementia: clinical and 18F-FDG-PET/CT pictures. Nucl Med Commun 2014;35:1085–92. [DOI] [PubMed] [Google Scholar]
- [6].Bohnen NI, Djang DS, Herholz K, et al. Effectiveness and safety of 18F-FDG PET in the evaluation of dementia: a review of the recent literature. J Nucl Med 2012;53:59–71. [DOI] [PubMed] [Google Scholar]
- [7].Foster NL, Heidebrink JL, Clark CM, et al. FDG-PET improves accuracy in distinguishing frontotemporal dementia and Alzheimer's disease. Brain 2007;130:2616–35. [DOI] [PubMed] [Google Scholar]
- [8].Ishii K, Kanda T, Uemura T, et al. Computer-assisted diagnostic system for neurodegenerative dementia using brain SPECT and 3D-SSP. Eur J Nucl Med Mol Imaging 2009;36:831–40. [DOI] [PubMed] [Google Scholar]
- [9].Ishii K, Kono AK, Sasaki H, et al. Fully automatic diagnostic system for early- and late-onset mild Alzheimer's disease using FDG PET and 3D-SSP. Eur J Nucl Med Mol Imaging 2006;33:575–83. [DOI] [PubMed] [Google Scholar]
- [10].Lehman VT, Carter RE, Claassen DO, et al. Visual assessment versus quantitative three-dimensional stereotactic surface projection fluorodeoxyglucose positron emission tomography for detection of mild cognitive impairment and Alzheimer disease. Clin Nucl Med 2012;37:721–6. [DOI] [PubMed] [Google Scholar]
- [11].Nihashi T, Yatsuya H, Hayasaka K, et al. Direct comparison study between FDG-PET and IMP-SPECT for diagnosing Alzheimer's disease using 3D-SSP analysis in the same patients. Radiat Med 2007;25:255–62. [DOI] [PubMed] [Google Scholar]
- [12].Uemura T, Ishii K, Miyamoto N, et al. Computer-assisted system for diagnosis of Alzheimer disease using data base- independent estimation and fluorodeoxyglucose- positron-emission tomography and 3D-stereotactic surface projection. AJNR Am J Neuroradiol 2011;32:556–9. [DOI] [PMC free article] [PubMed] [Google Scholar]
- [13].Frisoni GB, Bocchetta M, Chetelat G, et al. Imaging markers for Alzheimer disease: which vs how. Neurology 2013;81:487–500. [DOI] [PMC free article] [PubMed] [Google Scholar]
- [14].Uchida Y, Minoshima S, Okada S, et al. Diagnosis of dementia using perfusion SPECT imaging at the patient's initial visit to a cognitive disorder clinic. Clin Nucl Med 2006;31:764–73. [DOI] [PubMed] [Google Scholar]
- [15].Mosconi L. Brain glucose metabolism in the early and specific diagnosis of Alzheimer's disease. FDG-PET studies in MCI and AD. Eur J Nucl Med Mol Imaging 2005;32:486–510. [DOI] [PubMed] [Google Scholar]
- [16].Nobili F, Frisoni GB, Portet F, et al. Brain SPECT in subtypes of mild cognitive impairment. Findings from the DESCRIPA multicenter study. J Neurol 2008;255:1344–53. [DOI] [PubMed] [Google Scholar]
- [17].Nobili F, Salmaso D, Morbelli S, et al. Principal component analysis of FDG PET in amnestic MCI. Eur J Nucl Med Mol Imaging 2008;35:2191–202. [DOI] [PubMed] [Google Scholar]
- [18].Landau SM, Harvey D, Madison CM, et al. Associations between cognitive, functional, and FDG-PET measures of decline in AD and MCI. Neurobiol Aging 2011;32:1207–18. [DOI] [PMC free article] [PubMed] [Google Scholar]
- [19].Minoshima S, Giordani B, Berent S, et al. Metabolic reduction in the posterior cingulate cortex in very early Alzheimer's disease. Ann Neurol 1997;42:85–94. [DOI] [PubMed] [Google Scholar]
- [20].Burdette JH, Minoshima S, Vander Borght T, et al. Alzheimer disease: improved visual interpretation of PET images by using three-dimensional stereotaxic surface projections. Radiology 1996;198:837–43. [DOI] [PubMed] [Google Scholar]
- [21].Imabayashi E, Matsuda H, Asada T, et al. Superiority of 3-dimensional stereotactic surface projection analysis over visual inspection in discrimination of patients with very early Alzheimer's disease from controls using brain perfusion SPECT. J Nucl Med 2004;45:1450–7. [PubMed] [Google Scholar]
- [22].Minoshima S, Frey KA, Koeppe RA, et al. A diagnostic approach in Alzheimer's disease using three-dimensional stereotactic surface projections of fluorine-18-FDG PET. J Nucl Med 1995;36:1238–48. [PubMed] [Google Scholar]
- [23].Ishii K, Imamura T, Sasaki M, et al. Regional cerebral glucose metabolism in dementia with Lewy bodies and Alzheimer's disease. Neurology 1998;51:125–30. [DOI] [PubMed] [Google Scholar]
- [24].Ishii K, Soma T, Kono AK, et al. Comparison of regional brain volume and glucose metabolism between patients with mild dementia with Lewy bodies and those with mild Alzheimer's disease. J Nucl Med 2007;48:704–11. [DOI] [PubMed] [Google Scholar]
- [25].Jagust W, Reed B, Mungas D, et al. What does fluorodeoxyglucose PET imaging add to a clinical diagnosis of dementia? Neurology 2007;69:871–7. [DOI] [PubMed] [Google Scholar]
- [26].Panegyres PK, Rogers JM, McCarthy M, et al. Fluorodeoxyglucose-positron emission tomography in the differential diagnosis of early-onset dementia: a prospective, community-based study. BMC Neurol 2009;9:41. [DOI] [PMC free article] [PubMed] [Google Scholar]
- [27].Silverman DH, Small GW, Chang CY, et al. Positron emission tomography in evaluation of dementia: regional brain metabolism and long-term outcome. JAMA 2001;286:2120–7. [DOI] [PubMed] [Google Scholar]


