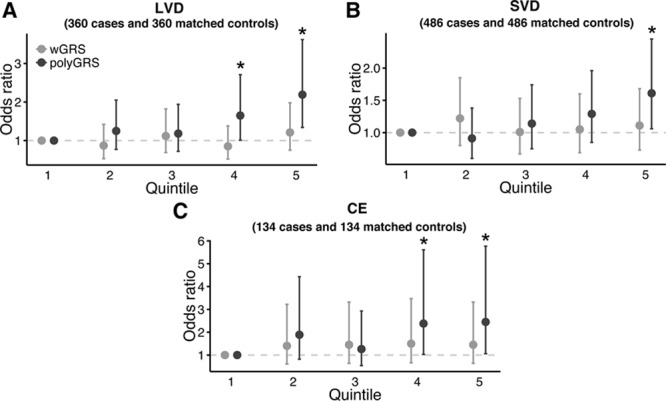
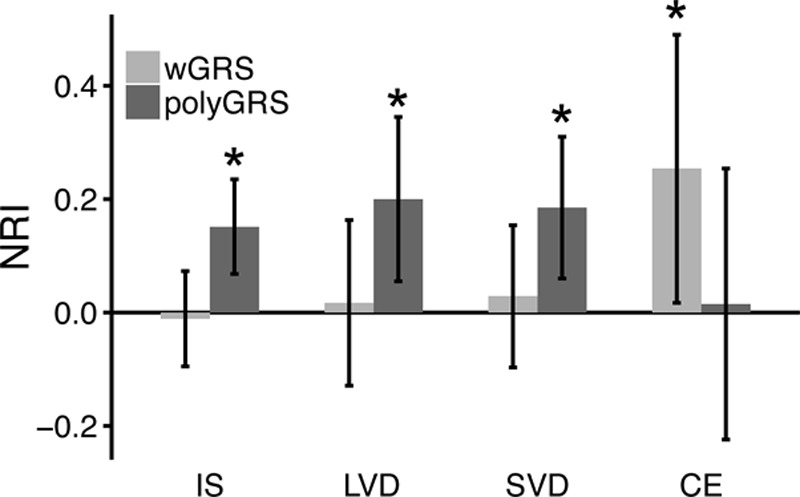
Tsuyoshi Hachiya
Tsuyoshi Hachiya, PhD
1From the Division of Biomedical Information Analysis (T.H., R.F., Y.S., H.O., K. Ono, M. Satoh, A.S.), Division of Biobank and Data Management (T.H., Y.S., M. Satoh), Division of Clinical Research and Epidemiology (K. Tanno, K. Sakata), Division of Innovation and Education (A.F.), Division of Community Medical Supports and Health Record Informatics (M. Satoh), and Division of Public Relations and Planning (R.E.), Iwate Tohoku Medical Megabank Organization (M. Sasaki, S.K., K. Ogasawara, M.N., J. Hitomi, K. Sobue), Iwate Medical University, Japan; Laboratory for Statistical Analysis (Y. Kamatani, A.T.), RIKEN Center for Integrative Medical Sciences, Kanagawa, Japan (M.K.); Laboratory for Omics Informatics, Omics Research Center, National Cerebral and Cardiovascular Center, Osaka, Japan (A.T.); Department of Environmental Medicine (J. Hata), Department of Medicine and Clinical Science (J. Hata, T.A., T.K.), and Center for Cohort Studies (J. Hata, T.N., T.K.), Graduate School of Medical Sciences, Kyushu University, Fukuoka, Japan; Epidemiology and Prevention Group, Center for Public Health Sciences, National Cancer Center, Tokyo, Japan (T.Y., N.S., M.I., S.T.); Department of Preventive Medicine, Faculty of Medicine, Saga University, Japan (M.H., K. Tanaka); Department of Public Health, Shiga University of Medical Science, Japan (N.T., Y. Kita); Laboratory of Molecular Medicine, Human Genome Center, Institute of Medical Science, The University of Tokyo, Japan (K.M.); Department of Preventive Medicine (K.W.) and Department of Epidemiology (H.T.), Nagoya University Graduate School of Medicine, Japan; Department of Public Health Medicine, Faculty of Medicine, University of Tsukuba, Ibaraki, Japan (K.Y.); Department of Preventive Medicine and Epidemiology (A.H.), Department of Biobank (N.M.), and Department of Integrative Genomics (M.Y.), Tohoku Medical Megabank Organization, Tohoku University, Sendai, Japan; Faculty of Nursing Science, Tsuruga Nursing University, Fukui, Japan (Y. Kita); Public Health, Department of Social Medicine, Osaka University Graduate School of Medicine, Japan (H.I.); Division of Epidemiology and Prevention, Aichi Cancer Center Research Institute, Nagoya, Japan (H.T.); and Hisayama Research Institute for Lifestyle Diseases, Fukuoka, Japan (Y. Kiyohara).
1,✉,
Yoichiro Kamatani
Yoichiro Kamatani, MD
1From the Division of Biomedical Information Analysis (T.H., R.F., Y.S., H.O., K. Ono, M. Satoh, A.S.), Division of Biobank and Data Management (T.H., Y.S., M. Satoh), Division of Clinical Research and Epidemiology (K. Tanno, K. Sakata), Division of Innovation and Education (A.F.), Division of Community Medical Supports and Health Record Informatics (M. Satoh), and Division of Public Relations and Planning (R.E.), Iwate Tohoku Medical Megabank Organization (M. Sasaki, S.K., K. Ogasawara, M.N., J. Hitomi, K. Sobue), Iwate Medical University, Japan; Laboratory for Statistical Analysis (Y. Kamatani, A.T.), RIKEN Center for Integrative Medical Sciences, Kanagawa, Japan (M.K.); Laboratory for Omics Informatics, Omics Research Center, National Cerebral and Cardiovascular Center, Osaka, Japan (A.T.); Department of Environmental Medicine (J. Hata), Department of Medicine and Clinical Science (J. Hata, T.A., T.K.), and Center for Cohort Studies (J. Hata, T.N., T.K.), Graduate School of Medical Sciences, Kyushu University, Fukuoka, Japan; Epidemiology and Prevention Group, Center for Public Health Sciences, National Cancer Center, Tokyo, Japan (T.Y., N.S., M.I., S.T.); Department of Preventive Medicine, Faculty of Medicine, Saga University, Japan (M.H., K. Tanaka); Department of Public Health, Shiga University of Medical Science, Japan (N.T., Y. Kita); Laboratory of Molecular Medicine, Human Genome Center, Institute of Medical Science, The University of Tokyo, Japan (K.M.); Department of Preventive Medicine (K.W.) and Department of Epidemiology (H.T.), Nagoya University Graduate School of Medicine, Japan; Department of Public Health Medicine, Faculty of Medicine, University of Tsukuba, Ibaraki, Japan (K.Y.); Department of Preventive Medicine and Epidemiology (A.H.), Department of Biobank (N.M.), and Department of Integrative Genomics (M.Y.), Tohoku Medical Megabank Organization, Tohoku University, Sendai, Japan; Faculty of Nursing Science, Tsuruga Nursing University, Fukui, Japan (Y. Kita); Public Health, Department of Social Medicine, Osaka University Graduate School of Medicine, Japan (H.I.); Division of Epidemiology and Prevention, Aichi Cancer Center Research Institute, Nagoya, Japan (H.T.); and Hisayama Research Institute for Lifestyle Diseases, Fukuoka, Japan (Y. Kiyohara).
1,
Atsushi Takahashi
Atsushi Takahashi, PhD
1From the Division of Biomedical Information Analysis (T.H., R.F., Y.S., H.O., K. Ono, M. Satoh, A.S.), Division of Biobank and Data Management (T.H., Y.S., M. Satoh), Division of Clinical Research and Epidemiology (K. Tanno, K. Sakata), Division of Innovation and Education (A.F.), Division of Community Medical Supports and Health Record Informatics (M. Satoh), and Division of Public Relations and Planning (R.E.), Iwate Tohoku Medical Megabank Organization (M. Sasaki, S.K., K. Ogasawara, M.N., J. Hitomi, K. Sobue), Iwate Medical University, Japan; Laboratory for Statistical Analysis (Y. Kamatani, A.T.), RIKEN Center for Integrative Medical Sciences, Kanagawa, Japan (M.K.); Laboratory for Omics Informatics, Omics Research Center, National Cerebral and Cardiovascular Center, Osaka, Japan (A.T.); Department of Environmental Medicine (J. Hata), Department of Medicine and Clinical Science (J. Hata, T.A., T.K.), and Center for Cohort Studies (J. Hata, T.N., T.K.), Graduate School of Medical Sciences, Kyushu University, Fukuoka, Japan; Epidemiology and Prevention Group, Center for Public Health Sciences, National Cancer Center, Tokyo, Japan (T.Y., N.S., M.I., S.T.); Department of Preventive Medicine, Faculty of Medicine, Saga University, Japan (M.H., K. Tanaka); Department of Public Health, Shiga University of Medical Science, Japan (N.T., Y. Kita); Laboratory of Molecular Medicine, Human Genome Center, Institute of Medical Science, The University of Tokyo, Japan (K.M.); Department of Preventive Medicine (K.W.) and Department of Epidemiology (H.T.), Nagoya University Graduate School of Medicine, Japan; Department of Public Health Medicine, Faculty of Medicine, University of Tsukuba, Ibaraki, Japan (K.Y.); Department of Preventive Medicine and Epidemiology (A.H.), Department of Biobank (N.M.), and Department of Integrative Genomics (M.Y.), Tohoku Medical Megabank Organization, Tohoku University, Sendai, Japan; Faculty of Nursing Science, Tsuruga Nursing University, Fukui, Japan (Y. Kita); Public Health, Department of Social Medicine, Osaka University Graduate School of Medicine, Japan (H.I.); Division of Epidemiology and Prevention, Aichi Cancer Center Research Institute, Nagoya, Japan (H.T.); and Hisayama Research Institute for Lifestyle Diseases, Fukuoka, Japan (Y. Kiyohara).
1,
Jun Hata
Jun Hata, MD
1From the Division of Biomedical Information Analysis (T.H., R.F., Y.S., H.O., K. Ono, M. Satoh, A.S.), Division of Biobank and Data Management (T.H., Y.S., M. Satoh), Division of Clinical Research and Epidemiology (K. Tanno, K. Sakata), Division of Innovation and Education (A.F.), Division of Community Medical Supports and Health Record Informatics (M. Satoh), and Division of Public Relations and Planning (R.E.), Iwate Tohoku Medical Megabank Organization (M. Sasaki, S.K., K. Ogasawara, M.N., J. Hitomi, K. Sobue), Iwate Medical University, Japan; Laboratory for Statistical Analysis (Y. Kamatani, A.T.), RIKEN Center for Integrative Medical Sciences, Kanagawa, Japan (M.K.); Laboratory for Omics Informatics, Omics Research Center, National Cerebral and Cardiovascular Center, Osaka, Japan (A.T.); Department of Environmental Medicine (J. Hata), Department of Medicine and Clinical Science (J. Hata, T.A., T.K.), and Center for Cohort Studies (J. Hata, T.N., T.K.), Graduate School of Medical Sciences, Kyushu University, Fukuoka, Japan; Epidemiology and Prevention Group, Center for Public Health Sciences, National Cancer Center, Tokyo, Japan (T.Y., N.S., M.I., S.T.); Department of Preventive Medicine, Faculty of Medicine, Saga University, Japan (M.H., K. Tanaka); Department of Public Health, Shiga University of Medical Science, Japan (N.T., Y. Kita); Laboratory of Molecular Medicine, Human Genome Center, Institute of Medical Science, The University of Tokyo, Japan (K.M.); Department of Preventive Medicine (K.W.) and Department of Epidemiology (H.T.), Nagoya University Graduate School of Medicine, Japan; Department of Public Health Medicine, Faculty of Medicine, University of Tsukuba, Ibaraki, Japan (K.Y.); Department of Preventive Medicine and Epidemiology (A.H.), Department of Biobank (N.M.), and Department of Integrative Genomics (M.Y.), Tohoku Medical Megabank Organization, Tohoku University, Sendai, Japan; Faculty of Nursing Science, Tsuruga Nursing University, Fukui, Japan (Y. Kita); Public Health, Department of Social Medicine, Osaka University Graduate School of Medicine, Japan (H.I.); Division of Epidemiology and Prevention, Aichi Cancer Center Research Institute, Nagoya, Japan (H.T.); and Hisayama Research Institute for Lifestyle Diseases, Fukuoka, Japan (Y. Kiyohara).
1,
Ryohei Furukawa
Ryohei Furukawa, PhD
1From the Division of Biomedical Information Analysis (T.H., R.F., Y.S., H.O., K. Ono, M. Satoh, A.S.), Division of Biobank and Data Management (T.H., Y.S., M. Satoh), Division of Clinical Research and Epidemiology (K. Tanno, K. Sakata), Division of Innovation and Education (A.F.), Division of Community Medical Supports and Health Record Informatics (M. Satoh), and Division of Public Relations and Planning (R.E.), Iwate Tohoku Medical Megabank Organization (M. Sasaki, S.K., K. Ogasawara, M.N., J. Hitomi, K. Sobue), Iwate Medical University, Japan; Laboratory for Statistical Analysis (Y. Kamatani, A.T.), RIKEN Center for Integrative Medical Sciences, Kanagawa, Japan (M.K.); Laboratory for Omics Informatics, Omics Research Center, National Cerebral and Cardiovascular Center, Osaka, Japan (A.T.); Department of Environmental Medicine (J. Hata), Department of Medicine and Clinical Science (J. Hata, T.A., T.K.), and Center for Cohort Studies (J. Hata, T.N., T.K.), Graduate School of Medical Sciences, Kyushu University, Fukuoka, Japan; Epidemiology and Prevention Group, Center for Public Health Sciences, National Cancer Center, Tokyo, Japan (T.Y., N.S., M.I., S.T.); Department of Preventive Medicine, Faculty of Medicine, Saga University, Japan (M.H., K. Tanaka); Department of Public Health, Shiga University of Medical Science, Japan (N.T., Y. Kita); Laboratory of Molecular Medicine, Human Genome Center, Institute of Medical Science, The University of Tokyo, Japan (K.M.); Department of Preventive Medicine (K.W.) and Department of Epidemiology (H.T.), Nagoya University Graduate School of Medicine, Japan; Department of Public Health Medicine, Faculty of Medicine, University of Tsukuba, Ibaraki, Japan (K.Y.); Department of Preventive Medicine and Epidemiology (A.H.), Department of Biobank (N.M.), and Department of Integrative Genomics (M.Y.), Tohoku Medical Megabank Organization, Tohoku University, Sendai, Japan; Faculty of Nursing Science, Tsuruga Nursing University, Fukui, Japan (Y. Kita); Public Health, Department of Social Medicine, Osaka University Graduate School of Medicine, Japan (H.I.); Division of Epidemiology and Prevention, Aichi Cancer Center Research Institute, Nagoya, Japan (H.T.); and Hisayama Research Institute for Lifestyle Diseases, Fukuoka, Japan (Y. Kiyohara).
1,
Yuh Shiwa
Yuh Shiwa, PhD
1From the Division of Biomedical Information Analysis (T.H., R.F., Y.S., H.O., K. Ono, M. Satoh, A.S.), Division of Biobank and Data Management (T.H., Y.S., M. Satoh), Division of Clinical Research and Epidemiology (K. Tanno, K. Sakata), Division of Innovation and Education (A.F.), Division of Community Medical Supports and Health Record Informatics (M. Satoh), and Division of Public Relations and Planning (R.E.), Iwate Tohoku Medical Megabank Organization (M. Sasaki, S.K., K. Ogasawara, M.N., J. Hitomi, K. Sobue), Iwate Medical University, Japan; Laboratory for Statistical Analysis (Y. Kamatani, A.T.), RIKEN Center for Integrative Medical Sciences, Kanagawa, Japan (M.K.); Laboratory for Omics Informatics, Omics Research Center, National Cerebral and Cardiovascular Center, Osaka, Japan (A.T.); Department of Environmental Medicine (J. Hata), Department of Medicine and Clinical Science (J. Hata, T.A., T.K.), and Center for Cohort Studies (J. Hata, T.N., T.K.), Graduate School of Medical Sciences, Kyushu University, Fukuoka, Japan; Epidemiology and Prevention Group, Center for Public Health Sciences, National Cancer Center, Tokyo, Japan (T.Y., N.S., M.I., S.T.); Department of Preventive Medicine, Faculty of Medicine, Saga University, Japan (M.H., K. Tanaka); Department of Public Health, Shiga University of Medical Science, Japan (N.T., Y. Kita); Laboratory of Molecular Medicine, Human Genome Center, Institute of Medical Science, The University of Tokyo, Japan (K.M.); Department of Preventive Medicine (K.W.) and Department of Epidemiology (H.T.), Nagoya University Graduate School of Medicine, Japan; Department of Public Health Medicine, Faculty of Medicine, University of Tsukuba, Ibaraki, Japan (K.Y.); Department of Preventive Medicine and Epidemiology (A.H.), Department of Biobank (N.M.), and Department of Integrative Genomics (M.Y.), Tohoku Medical Megabank Organization, Tohoku University, Sendai, Japan; Faculty of Nursing Science, Tsuruga Nursing University, Fukui, Japan (Y. Kita); Public Health, Department of Social Medicine, Osaka University Graduate School of Medicine, Japan (H.I.); Division of Epidemiology and Prevention, Aichi Cancer Center Research Institute, Nagoya, Japan (H.T.); and Hisayama Research Institute for Lifestyle Diseases, Fukuoka, Japan (Y. Kiyohara).
1,
Taiki Yamaji
Taiki Yamaji, MD
1From the Division of Biomedical Information Analysis (T.H., R.F., Y.S., H.O., K. Ono, M. Satoh, A.S.), Division of Biobank and Data Management (T.H., Y.S., M. Satoh), Division of Clinical Research and Epidemiology (K. Tanno, K. Sakata), Division of Innovation and Education (A.F.), Division of Community Medical Supports and Health Record Informatics (M. Satoh), and Division of Public Relations and Planning (R.E.), Iwate Tohoku Medical Megabank Organization (M. Sasaki, S.K., K. Ogasawara, M.N., J. Hitomi, K. Sobue), Iwate Medical University, Japan; Laboratory for Statistical Analysis (Y. Kamatani, A.T.), RIKEN Center for Integrative Medical Sciences, Kanagawa, Japan (M.K.); Laboratory for Omics Informatics, Omics Research Center, National Cerebral and Cardiovascular Center, Osaka, Japan (A.T.); Department of Environmental Medicine (J. Hata), Department of Medicine and Clinical Science (J. Hata, T.A., T.K.), and Center for Cohort Studies (J. Hata, T.N., T.K.), Graduate School of Medical Sciences, Kyushu University, Fukuoka, Japan; Epidemiology and Prevention Group, Center for Public Health Sciences, National Cancer Center, Tokyo, Japan (T.Y., N.S., M.I., S.T.); Department of Preventive Medicine, Faculty of Medicine, Saga University, Japan (M.H., K. Tanaka); Department of Public Health, Shiga University of Medical Science, Japan (N.T., Y. Kita); Laboratory of Molecular Medicine, Human Genome Center, Institute of Medical Science, The University of Tokyo, Japan (K.M.); Department of Preventive Medicine (K.W.) and Department of Epidemiology (H.T.), Nagoya University Graduate School of Medicine, Japan; Department of Public Health Medicine, Faculty of Medicine, University of Tsukuba, Ibaraki, Japan (K.Y.); Department of Preventive Medicine and Epidemiology (A.H.), Department of Biobank (N.M.), and Department of Integrative Genomics (M.Y.), Tohoku Medical Megabank Organization, Tohoku University, Sendai, Japan; Faculty of Nursing Science, Tsuruga Nursing University, Fukui, Japan (Y. Kita); Public Health, Department of Social Medicine, Osaka University Graduate School of Medicine, Japan (H.I.); Division of Epidemiology and Prevention, Aichi Cancer Center Research Institute, Nagoya, Japan (H.T.); and Hisayama Research Institute for Lifestyle Diseases, Fukuoka, Japan (Y. Kiyohara).
1,
Megumi Hara
Megumi Hara, MD
1From the Division of Biomedical Information Analysis (T.H., R.F., Y.S., H.O., K. Ono, M. Satoh, A.S.), Division of Biobank and Data Management (T.H., Y.S., M. Satoh), Division of Clinical Research and Epidemiology (K. Tanno, K. Sakata), Division of Innovation and Education (A.F.), Division of Community Medical Supports and Health Record Informatics (M. Satoh), and Division of Public Relations and Planning (R.E.), Iwate Tohoku Medical Megabank Organization (M. Sasaki, S.K., K. Ogasawara, M.N., J. Hitomi, K. Sobue), Iwate Medical University, Japan; Laboratory for Statistical Analysis (Y. Kamatani, A.T.), RIKEN Center for Integrative Medical Sciences, Kanagawa, Japan (M.K.); Laboratory for Omics Informatics, Omics Research Center, National Cerebral and Cardiovascular Center, Osaka, Japan (A.T.); Department of Environmental Medicine (J. Hata), Department of Medicine and Clinical Science (J. Hata, T.A., T.K.), and Center for Cohort Studies (J. Hata, T.N., T.K.), Graduate School of Medical Sciences, Kyushu University, Fukuoka, Japan; Epidemiology and Prevention Group, Center for Public Health Sciences, National Cancer Center, Tokyo, Japan (T.Y., N.S., M.I., S.T.); Department of Preventive Medicine, Faculty of Medicine, Saga University, Japan (M.H., K. Tanaka); Department of Public Health, Shiga University of Medical Science, Japan (N.T., Y. Kita); Laboratory of Molecular Medicine, Human Genome Center, Institute of Medical Science, The University of Tokyo, Japan (K.M.); Department of Preventive Medicine (K.W.) and Department of Epidemiology (H.T.), Nagoya University Graduate School of Medicine, Japan; Department of Public Health Medicine, Faculty of Medicine, University of Tsukuba, Ibaraki, Japan (K.Y.); Department of Preventive Medicine and Epidemiology (A.H.), Department of Biobank (N.M.), and Department of Integrative Genomics (M.Y.), Tohoku Medical Megabank Organization, Tohoku University, Sendai, Japan; Faculty of Nursing Science, Tsuruga Nursing University, Fukui, Japan (Y. Kita); Public Health, Department of Social Medicine, Osaka University Graduate School of Medicine, Japan (H.I.); Division of Epidemiology and Prevention, Aichi Cancer Center Research Institute, Nagoya, Japan (H.T.); and Hisayama Research Institute for Lifestyle Diseases, Fukuoka, Japan (Y. Kiyohara).
1,
Kozo Tanno
Kozo Tanno, MD
1From the Division of Biomedical Information Analysis (T.H., R.F., Y.S., H.O., K. Ono, M. Satoh, A.S.), Division of Biobank and Data Management (T.H., Y.S., M. Satoh), Division of Clinical Research and Epidemiology (K. Tanno, K. Sakata), Division of Innovation and Education (A.F.), Division of Community Medical Supports and Health Record Informatics (M. Satoh), and Division of Public Relations and Planning (R.E.), Iwate Tohoku Medical Megabank Organization (M. Sasaki, S.K., K. Ogasawara, M.N., J. Hitomi, K. Sobue), Iwate Medical University, Japan; Laboratory for Statistical Analysis (Y. Kamatani, A.T.), RIKEN Center for Integrative Medical Sciences, Kanagawa, Japan (M.K.); Laboratory for Omics Informatics, Omics Research Center, National Cerebral and Cardiovascular Center, Osaka, Japan (A.T.); Department of Environmental Medicine (J. Hata), Department of Medicine and Clinical Science (J. Hata, T.A., T.K.), and Center for Cohort Studies (J. Hata, T.N., T.K.), Graduate School of Medical Sciences, Kyushu University, Fukuoka, Japan; Epidemiology and Prevention Group, Center for Public Health Sciences, National Cancer Center, Tokyo, Japan (T.Y., N.S., M.I., S.T.); Department of Preventive Medicine, Faculty of Medicine, Saga University, Japan (M.H., K. Tanaka); Department of Public Health, Shiga University of Medical Science, Japan (N.T., Y. Kita); Laboratory of Molecular Medicine, Human Genome Center, Institute of Medical Science, The University of Tokyo, Japan (K.M.); Department of Preventive Medicine (K.W.) and Department of Epidemiology (H.T.), Nagoya University Graduate School of Medicine, Japan; Department of Public Health Medicine, Faculty of Medicine, University of Tsukuba, Ibaraki, Japan (K.Y.); Department of Preventive Medicine and Epidemiology (A.H.), Department of Biobank (N.M.), and Department of Integrative Genomics (M.Y.), Tohoku Medical Megabank Organization, Tohoku University, Sendai, Japan; Faculty of Nursing Science, Tsuruga Nursing University, Fukui, Japan (Y. Kita); Public Health, Department of Social Medicine, Osaka University Graduate School of Medicine, Japan (H.I.); Division of Epidemiology and Prevention, Aichi Cancer Center Research Institute, Nagoya, Japan (H.T.); and Hisayama Research Institute for Lifestyle Diseases, Fukuoka, Japan (Y. Kiyohara).
1,
Hideki Ohmomo
Hideki Ohmomo, PhD
1From the Division of Biomedical Information Analysis (T.H., R.F., Y.S., H.O., K. Ono, M. Satoh, A.S.), Division of Biobank and Data Management (T.H., Y.S., M. Satoh), Division of Clinical Research and Epidemiology (K. Tanno, K. Sakata), Division of Innovation and Education (A.F.), Division of Community Medical Supports and Health Record Informatics (M. Satoh), and Division of Public Relations and Planning (R.E.), Iwate Tohoku Medical Megabank Organization (M. Sasaki, S.K., K. Ogasawara, M.N., J. Hitomi, K. Sobue), Iwate Medical University, Japan; Laboratory for Statistical Analysis (Y. Kamatani, A.T.), RIKEN Center for Integrative Medical Sciences, Kanagawa, Japan (M.K.); Laboratory for Omics Informatics, Omics Research Center, National Cerebral and Cardiovascular Center, Osaka, Japan (A.T.); Department of Environmental Medicine (J. Hata), Department of Medicine and Clinical Science (J. Hata, T.A., T.K.), and Center for Cohort Studies (J. Hata, T.N., T.K.), Graduate School of Medical Sciences, Kyushu University, Fukuoka, Japan; Epidemiology and Prevention Group, Center for Public Health Sciences, National Cancer Center, Tokyo, Japan (T.Y., N.S., M.I., S.T.); Department of Preventive Medicine, Faculty of Medicine, Saga University, Japan (M.H., K. Tanaka); Department of Public Health, Shiga University of Medical Science, Japan (N.T., Y. Kita); Laboratory of Molecular Medicine, Human Genome Center, Institute of Medical Science, The University of Tokyo, Japan (K.M.); Department of Preventive Medicine (K.W.) and Department of Epidemiology (H.T.), Nagoya University Graduate School of Medicine, Japan; Department of Public Health Medicine, Faculty of Medicine, University of Tsukuba, Ibaraki, Japan (K.Y.); Department of Preventive Medicine and Epidemiology (A.H.), Department of Biobank (N.M.), and Department of Integrative Genomics (M.Y.), Tohoku Medical Megabank Organization, Tohoku University, Sendai, Japan; Faculty of Nursing Science, Tsuruga Nursing University, Fukui, Japan (Y. Kita); Public Health, Department of Social Medicine, Osaka University Graduate School of Medicine, Japan (H.I.); Division of Epidemiology and Prevention, Aichi Cancer Center Research Institute, Nagoya, Japan (H.T.); and Hisayama Research Institute for Lifestyle Diseases, Fukuoka, Japan (Y. Kiyohara).
1,
Kanako Ono
Kanako Ono, BSc
1From the Division of Biomedical Information Analysis (T.H., R.F., Y.S., H.O., K. Ono, M. Satoh, A.S.), Division of Biobank and Data Management (T.H., Y.S., M. Satoh), Division of Clinical Research and Epidemiology (K. Tanno, K. Sakata), Division of Innovation and Education (A.F.), Division of Community Medical Supports and Health Record Informatics (M. Satoh), and Division of Public Relations and Planning (R.E.), Iwate Tohoku Medical Megabank Organization (M. Sasaki, S.K., K. Ogasawara, M.N., J. Hitomi, K. Sobue), Iwate Medical University, Japan; Laboratory for Statistical Analysis (Y. Kamatani, A.T.), RIKEN Center for Integrative Medical Sciences, Kanagawa, Japan (M.K.); Laboratory for Omics Informatics, Omics Research Center, National Cerebral and Cardiovascular Center, Osaka, Japan (A.T.); Department of Environmental Medicine (J. Hata), Department of Medicine and Clinical Science (J. Hata, T.A., T.K.), and Center for Cohort Studies (J. Hata, T.N., T.K.), Graduate School of Medical Sciences, Kyushu University, Fukuoka, Japan; Epidemiology and Prevention Group, Center for Public Health Sciences, National Cancer Center, Tokyo, Japan (T.Y., N.S., M.I., S.T.); Department of Preventive Medicine, Faculty of Medicine, Saga University, Japan (M.H., K. Tanaka); Department of Public Health, Shiga University of Medical Science, Japan (N.T., Y. Kita); Laboratory of Molecular Medicine, Human Genome Center, Institute of Medical Science, The University of Tokyo, Japan (K.M.); Department of Preventive Medicine (K.W.) and Department of Epidemiology (H.T.), Nagoya University Graduate School of Medicine, Japan; Department of Public Health Medicine, Faculty of Medicine, University of Tsukuba, Ibaraki, Japan (K.Y.); Department of Preventive Medicine and Epidemiology (A.H.), Department of Biobank (N.M.), and Department of Integrative Genomics (M.Y.), Tohoku Medical Megabank Organization, Tohoku University, Sendai, Japan; Faculty of Nursing Science, Tsuruga Nursing University, Fukui, Japan (Y. Kita); Public Health, Department of Social Medicine, Osaka University Graduate School of Medicine, Japan (H.I.); Division of Epidemiology and Prevention, Aichi Cancer Center Research Institute, Nagoya, Japan (H.T.); and Hisayama Research Institute for Lifestyle Diseases, Fukuoka, Japan (Y. Kiyohara).
1,
Naoyuki Takashima
Naoyuki Takashima, MD
1From the Division of Biomedical Information Analysis (T.H., R.F., Y.S., H.O., K. Ono, M. Satoh, A.S.), Division of Biobank and Data Management (T.H., Y.S., M. Satoh), Division of Clinical Research and Epidemiology (K. Tanno, K. Sakata), Division of Innovation and Education (A.F.), Division of Community Medical Supports and Health Record Informatics (M. Satoh), and Division of Public Relations and Planning (R.E.), Iwate Tohoku Medical Megabank Organization (M. Sasaki, S.K., K. Ogasawara, M.N., J. Hitomi, K. Sobue), Iwate Medical University, Japan; Laboratory for Statistical Analysis (Y. Kamatani, A.T.), RIKEN Center for Integrative Medical Sciences, Kanagawa, Japan (M.K.); Laboratory for Omics Informatics, Omics Research Center, National Cerebral and Cardiovascular Center, Osaka, Japan (A.T.); Department of Environmental Medicine (J. Hata), Department of Medicine and Clinical Science (J. Hata, T.A., T.K.), and Center for Cohort Studies (J. Hata, T.N., T.K.), Graduate School of Medical Sciences, Kyushu University, Fukuoka, Japan; Epidemiology and Prevention Group, Center for Public Health Sciences, National Cancer Center, Tokyo, Japan (T.Y., N.S., M.I., S.T.); Department of Preventive Medicine, Faculty of Medicine, Saga University, Japan (M.H., K. Tanaka); Department of Public Health, Shiga University of Medical Science, Japan (N.T., Y. Kita); Laboratory of Molecular Medicine, Human Genome Center, Institute of Medical Science, The University of Tokyo, Japan (K.M.); Department of Preventive Medicine (K.W.) and Department of Epidemiology (H.T.), Nagoya University Graduate School of Medicine, Japan; Department of Public Health Medicine, Faculty of Medicine, University of Tsukuba, Ibaraki, Japan (K.Y.); Department of Preventive Medicine and Epidemiology (A.H.), Department of Biobank (N.M.), and Department of Integrative Genomics (M.Y.), Tohoku Medical Megabank Organization, Tohoku University, Sendai, Japan; Faculty of Nursing Science, Tsuruga Nursing University, Fukui, Japan (Y. Kita); Public Health, Department of Social Medicine, Osaka University Graduate School of Medicine, Japan (H.I.); Division of Epidemiology and Prevention, Aichi Cancer Center Research Institute, Nagoya, Japan (H.T.); and Hisayama Research Institute for Lifestyle Diseases, Fukuoka, Japan (Y. Kiyohara).
1,
Koichi Matsuda
Koichi Matsuda, MD
1From the Division of Biomedical Information Analysis (T.H., R.F., Y.S., H.O., K. Ono, M. Satoh, A.S.), Division of Biobank and Data Management (T.H., Y.S., M. Satoh), Division of Clinical Research and Epidemiology (K. Tanno, K. Sakata), Division of Innovation and Education (A.F.), Division of Community Medical Supports and Health Record Informatics (M. Satoh), and Division of Public Relations and Planning (R.E.), Iwate Tohoku Medical Megabank Organization (M. Sasaki, S.K., K. Ogasawara, M.N., J. Hitomi, K. Sobue), Iwate Medical University, Japan; Laboratory for Statistical Analysis (Y. Kamatani, A.T.), RIKEN Center for Integrative Medical Sciences, Kanagawa, Japan (M.K.); Laboratory for Omics Informatics, Omics Research Center, National Cerebral and Cardiovascular Center, Osaka, Japan (A.T.); Department of Environmental Medicine (J. Hata), Department of Medicine and Clinical Science (J. Hata, T.A., T.K.), and Center for Cohort Studies (J. Hata, T.N., T.K.), Graduate School of Medical Sciences, Kyushu University, Fukuoka, Japan; Epidemiology and Prevention Group, Center for Public Health Sciences, National Cancer Center, Tokyo, Japan (T.Y., N.S., M.I., S.T.); Department of Preventive Medicine, Faculty of Medicine, Saga University, Japan (M.H., K. Tanaka); Department of Public Health, Shiga University of Medical Science, Japan (N.T., Y. Kita); Laboratory of Molecular Medicine, Human Genome Center, Institute of Medical Science, The University of Tokyo, Japan (K.M.); Department of Preventive Medicine (K.W.) and Department of Epidemiology (H.T.), Nagoya University Graduate School of Medicine, Japan; Department of Public Health Medicine, Faculty of Medicine, University of Tsukuba, Ibaraki, Japan (K.Y.); Department of Preventive Medicine and Epidemiology (A.H.), Department of Biobank (N.M.), and Department of Integrative Genomics (M.Y.), Tohoku Medical Megabank Organization, Tohoku University, Sendai, Japan; Faculty of Nursing Science, Tsuruga Nursing University, Fukui, Japan (Y. Kita); Public Health, Department of Social Medicine, Osaka University Graduate School of Medicine, Japan (H.I.); Division of Epidemiology and Prevention, Aichi Cancer Center Research Institute, Nagoya, Japan (H.T.); and Hisayama Research Institute for Lifestyle Diseases, Fukuoka, Japan (Y. Kiyohara).
1,
Kenji Wakai
Kenji Wakai, MD
1From the Division of Biomedical Information Analysis (T.H., R.F., Y.S., H.O., K. Ono, M. Satoh, A.S.), Division of Biobank and Data Management (T.H., Y.S., M. Satoh), Division of Clinical Research and Epidemiology (K. Tanno, K. Sakata), Division of Innovation and Education (A.F.), Division of Community Medical Supports and Health Record Informatics (M. Satoh), and Division of Public Relations and Planning (R.E.), Iwate Tohoku Medical Megabank Organization (M. Sasaki, S.K., K. Ogasawara, M.N., J. Hitomi, K. Sobue), Iwate Medical University, Japan; Laboratory for Statistical Analysis (Y. Kamatani, A.T.), RIKEN Center for Integrative Medical Sciences, Kanagawa, Japan (M.K.); Laboratory for Omics Informatics, Omics Research Center, National Cerebral and Cardiovascular Center, Osaka, Japan (A.T.); Department of Environmental Medicine (J. Hata), Department of Medicine and Clinical Science (J. Hata, T.A., T.K.), and Center for Cohort Studies (J. Hata, T.N., T.K.), Graduate School of Medical Sciences, Kyushu University, Fukuoka, Japan; Epidemiology and Prevention Group, Center for Public Health Sciences, National Cancer Center, Tokyo, Japan (T.Y., N.S., M.I., S.T.); Department of Preventive Medicine, Faculty of Medicine, Saga University, Japan (M.H., K. Tanaka); Department of Public Health, Shiga University of Medical Science, Japan (N.T., Y. Kita); Laboratory of Molecular Medicine, Human Genome Center, Institute of Medical Science, The University of Tokyo, Japan (K.M.); Department of Preventive Medicine (K.W.) and Department of Epidemiology (H.T.), Nagoya University Graduate School of Medicine, Japan; Department of Public Health Medicine, Faculty of Medicine, University of Tsukuba, Ibaraki, Japan (K.Y.); Department of Preventive Medicine and Epidemiology (A.H.), Department of Biobank (N.M.), and Department of Integrative Genomics (M.Y.), Tohoku Medical Megabank Organization, Tohoku University, Sendai, Japan; Faculty of Nursing Science, Tsuruga Nursing University, Fukui, Japan (Y. Kita); Public Health, Department of Social Medicine, Osaka University Graduate School of Medicine, Japan (H.I.); Division of Epidemiology and Prevention, Aichi Cancer Center Research Institute, Nagoya, Japan (H.T.); and Hisayama Research Institute for Lifestyle Diseases, Fukuoka, Japan (Y. Kiyohara).
1,
Norie Sawada
Norie Sawada, MD
1From the Division of Biomedical Information Analysis (T.H., R.F., Y.S., H.O., K. Ono, M. Satoh, A.S.), Division of Biobank and Data Management (T.H., Y.S., M. Satoh), Division of Clinical Research and Epidemiology (K. Tanno, K. Sakata), Division of Innovation and Education (A.F.), Division of Community Medical Supports and Health Record Informatics (M. Satoh), and Division of Public Relations and Planning (R.E.), Iwate Tohoku Medical Megabank Organization (M. Sasaki, S.K., K. Ogasawara, M.N., J. Hitomi, K. Sobue), Iwate Medical University, Japan; Laboratory for Statistical Analysis (Y. Kamatani, A.T.), RIKEN Center for Integrative Medical Sciences, Kanagawa, Japan (M.K.); Laboratory for Omics Informatics, Omics Research Center, National Cerebral and Cardiovascular Center, Osaka, Japan (A.T.); Department of Environmental Medicine (J. Hata), Department of Medicine and Clinical Science (J. Hata, T.A., T.K.), and Center for Cohort Studies (J. Hata, T.N., T.K.), Graduate School of Medical Sciences, Kyushu University, Fukuoka, Japan; Epidemiology and Prevention Group, Center for Public Health Sciences, National Cancer Center, Tokyo, Japan (T.Y., N.S., M.I., S.T.); Department of Preventive Medicine, Faculty of Medicine, Saga University, Japan (M.H., K. Tanaka); Department of Public Health, Shiga University of Medical Science, Japan (N.T., Y. Kita); Laboratory of Molecular Medicine, Human Genome Center, Institute of Medical Science, The University of Tokyo, Japan (K.M.); Department of Preventive Medicine (K.W.) and Department of Epidemiology (H.T.), Nagoya University Graduate School of Medicine, Japan; Department of Public Health Medicine, Faculty of Medicine, University of Tsukuba, Ibaraki, Japan (K.Y.); Department of Preventive Medicine and Epidemiology (A.H.), Department of Biobank (N.M.), and Department of Integrative Genomics (M.Y.), Tohoku Medical Megabank Organization, Tohoku University, Sendai, Japan; Faculty of Nursing Science, Tsuruga Nursing University, Fukui, Japan (Y. Kita); Public Health, Department of Social Medicine, Osaka University Graduate School of Medicine, Japan (H.I.); Division of Epidemiology and Prevention, Aichi Cancer Center Research Institute, Nagoya, Japan (H.T.); and Hisayama Research Institute for Lifestyle Diseases, Fukuoka, Japan (Y. Kiyohara).
1,
Motoki Iwasaki
Motoki Iwasaki, MD
1From the Division of Biomedical Information Analysis (T.H., R.F., Y.S., H.O., K. Ono, M. Satoh, A.S.), Division of Biobank and Data Management (T.H., Y.S., M. Satoh), Division of Clinical Research and Epidemiology (K. Tanno, K. Sakata), Division of Innovation and Education (A.F.), Division of Community Medical Supports and Health Record Informatics (M. Satoh), and Division of Public Relations and Planning (R.E.), Iwate Tohoku Medical Megabank Organization (M. Sasaki, S.K., K. Ogasawara, M.N., J. Hitomi, K. Sobue), Iwate Medical University, Japan; Laboratory for Statistical Analysis (Y. Kamatani, A.T.), RIKEN Center for Integrative Medical Sciences, Kanagawa, Japan (M.K.); Laboratory for Omics Informatics, Omics Research Center, National Cerebral and Cardiovascular Center, Osaka, Japan (A.T.); Department of Environmental Medicine (J. Hata), Department of Medicine and Clinical Science (J. Hata, T.A., T.K.), and Center for Cohort Studies (J. Hata, T.N., T.K.), Graduate School of Medical Sciences, Kyushu University, Fukuoka, Japan; Epidemiology and Prevention Group, Center for Public Health Sciences, National Cancer Center, Tokyo, Japan (T.Y., N.S., M.I., S.T.); Department of Preventive Medicine, Faculty of Medicine, Saga University, Japan (M.H., K. Tanaka); Department of Public Health, Shiga University of Medical Science, Japan (N.T., Y. Kita); Laboratory of Molecular Medicine, Human Genome Center, Institute of Medical Science, The University of Tokyo, Japan (K.M.); Department of Preventive Medicine (K.W.) and Department of Epidemiology (H.T.), Nagoya University Graduate School of Medicine, Japan; Department of Public Health Medicine, Faculty of Medicine, University of Tsukuba, Ibaraki, Japan (K.Y.); Department of Preventive Medicine and Epidemiology (A.H.), Department of Biobank (N.M.), and Department of Integrative Genomics (M.Y.), Tohoku Medical Megabank Organization, Tohoku University, Sendai, Japan; Faculty of Nursing Science, Tsuruga Nursing University, Fukui, Japan (Y. Kita); Public Health, Department of Social Medicine, Osaka University Graduate School of Medicine, Japan (H.I.); Division of Epidemiology and Prevention, Aichi Cancer Center Research Institute, Nagoya, Japan (H.T.); and Hisayama Research Institute for Lifestyle Diseases, Fukuoka, Japan (Y. Kiyohara).
1,
Kazumasa Yamagishi
Kazumasa Yamagishi, MD
1From the Division of Biomedical Information Analysis (T.H., R.F., Y.S., H.O., K. Ono, M. Satoh, A.S.), Division of Biobank and Data Management (T.H., Y.S., M. Satoh), Division of Clinical Research and Epidemiology (K. Tanno, K. Sakata), Division of Innovation and Education (A.F.), Division of Community Medical Supports and Health Record Informatics (M. Satoh), and Division of Public Relations and Planning (R.E.), Iwate Tohoku Medical Megabank Organization (M. Sasaki, S.K., K. Ogasawara, M.N., J. Hitomi, K. Sobue), Iwate Medical University, Japan; Laboratory for Statistical Analysis (Y. Kamatani, A.T.), RIKEN Center for Integrative Medical Sciences, Kanagawa, Japan (M.K.); Laboratory for Omics Informatics, Omics Research Center, National Cerebral and Cardiovascular Center, Osaka, Japan (A.T.); Department of Environmental Medicine (J. Hata), Department of Medicine and Clinical Science (J. Hata, T.A., T.K.), and Center for Cohort Studies (J. Hata, T.N., T.K.), Graduate School of Medical Sciences, Kyushu University, Fukuoka, Japan; Epidemiology and Prevention Group, Center for Public Health Sciences, National Cancer Center, Tokyo, Japan (T.Y., N.S., M.I., S.T.); Department of Preventive Medicine, Faculty of Medicine, Saga University, Japan (M.H., K. Tanaka); Department of Public Health, Shiga University of Medical Science, Japan (N.T., Y. Kita); Laboratory of Molecular Medicine, Human Genome Center, Institute of Medical Science, The University of Tokyo, Japan (K.M.); Department of Preventive Medicine (K.W.) and Department of Epidemiology (H.T.), Nagoya University Graduate School of Medicine, Japan; Department of Public Health Medicine, Faculty of Medicine, University of Tsukuba, Ibaraki, Japan (K.Y.); Department of Preventive Medicine and Epidemiology (A.H.), Department of Biobank (N.M.), and Department of Integrative Genomics (M.Y.), Tohoku Medical Megabank Organization, Tohoku University, Sendai, Japan; Faculty of Nursing Science, Tsuruga Nursing University, Fukui, Japan (Y. Kita); Public Health, Department of Social Medicine, Osaka University Graduate School of Medicine, Japan (H.I.); Division of Epidemiology and Prevention, Aichi Cancer Center Research Institute, Nagoya, Japan (H.T.); and Hisayama Research Institute for Lifestyle Diseases, Fukuoka, Japan (Y. Kiyohara).
1,
Tetsuro Ago
Tetsuro Ago, MD
1From the Division of Biomedical Information Analysis (T.H., R.F., Y.S., H.O., K. Ono, M. Satoh, A.S.), Division of Biobank and Data Management (T.H., Y.S., M. Satoh), Division of Clinical Research and Epidemiology (K. Tanno, K. Sakata), Division of Innovation and Education (A.F.), Division of Community Medical Supports and Health Record Informatics (M. Satoh), and Division of Public Relations and Planning (R.E.), Iwate Tohoku Medical Megabank Organization (M. Sasaki, S.K., K. Ogasawara, M.N., J. Hitomi, K. Sobue), Iwate Medical University, Japan; Laboratory for Statistical Analysis (Y. Kamatani, A.T.), RIKEN Center for Integrative Medical Sciences, Kanagawa, Japan (M.K.); Laboratory for Omics Informatics, Omics Research Center, National Cerebral and Cardiovascular Center, Osaka, Japan (A.T.); Department of Environmental Medicine (J. Hata), Department of Medicine and Clinical Science (J. Hata, T.A., T.K.), and Center for Cohort Studies (J. Hata, T.N., T.K.), Graduate School of Medical Sciences, Kyushu University, Fukuoka, Japan; Epidemiology and Prevention Group, Center for Public Health Sciences, National Cancer Center, Tokyo, Japan (T.Y., N.S., M.I., S.T.); Department of Preventive Medicine, Faculty of Medicine, Saga University, Japan (M.H., K. Tanaka); Department of Public Health, Shiga University of Medical Science, Japan (N.T., Y. Kita); Laboratory of Molecular Medicine, Human Genome Center, Institute of Medical Science, The University of Tokyo, Japan (K.M.); Department of Preventive Medicine (K.W.) and Department of Epidemiology (H.T.), Nagoya University Graduate School of Medicine, Japan; Department of Public Health Medicine, Faculty of Medicine, University of Tsukuba, Ibaraki, Japan (K.Y.); Department of Preventive Medicine and Epidemiology (A.H.), Department of Biobank (N.M.), and Department of Integrative Genomics (M.Y.), Tohoku Medical Megabank Organization, Tohoku University, Sendai, Japan; Faculty of Nursing Science, Tsuruga Nursing University, Fukui, Japan (Y. Kita); Public Health, Department of Social Medicine, Osaka University Graduate School of Medicine, Japan (H.I.); Division of Epidemiology and Prevention, Aichi Cancer Center Research Institute, Nagoya, Japan (H.T.); and Hisayama Research Institute for Lifestyle Diseases, Fukuoka, Japan (Y. Kiyohara).
1,
Toshiharu Ninomiya
Toshiharu Ninomiya, MD
1From the Division of Biomedical Information Analysis (T.H., R.F., Y.S., H.O., K. Ono, M. Satoh, A.S.), Division of Biobank and Data Management (T.H., Y.S., M. Satoh), Division of Clinical Research and Epidemiology (K. Tanno, K. Sakata), Division of Innovation and Education (A.F.), Division of Community Medical Supports and Health Record Informatics (M. Satoh), and Division of Public Relations and Planning (R.E.), Iwate Tohoku Medical Megabank Organization (M. Sasaki, S.K., K. Ogasawara, M.N., J. Hitomi, K. Sobue), Iwate Medical University, Japan; Laboratory for Statistical Analysis (Y. Kamatani, A.T.), RIKEN Center for Integrative Medical Sciences, Kanagawa, Japan (M.K.); Laboratory for Omics Informatics, Omics Research Center, National Cerebral and Cardiovascular Center, Osaka, Japan (A.T.); Department of Environmental Medicine (J. Hata), Department of Medicine and Clinical Science (J. Hata, T.A., T.K.), and Center for Cohort Studies (J. Hata, T.N., T.K.), Graduate School of Medical Sciences, Kyushu University, Fukuoka, Japan; Epidemiology and Prevention Group, Center for Public Health Sciences, National Cancer Center, Tokyo, Japan (T.Y., N.S., M.I., S.T.); Department of Preventive Medicine, Faculty of Medicine, Saga University, Japan (M.H., K. Tanaka); Department of Public Health, Shiga University of Medical Science, Japan (N.T., Y. Kita); Laboratory of Molecular Medicine, Human Genome Center, Institute of Medical Science, The University of Tokyo, Japan (K.M.); Department of Preventive Medicine (K.W.) and Department of Epidemiology (H.T.), Nagoya University Graduate School of Medicine, Japan; Department of Public Health Medicine, Faculty of Medicine, University of Tsukuba, Ibaraki, Japan (K.Y.); Department of Preventive Medicine and Epidemiology (A.H.), Department of Biobank (N.M.), and Department of Integrative Genomics (M.Y.), Tohoku Medical Megabank Organization, Tohoku University, Sendai, Japan; Faculty of Nursing Science, Tsuruga Nursing University, Fukui, Japan (Y. Kita); Public Health, Department of Social Medicine, Osaka University Graduate School of Medicine, Japan (H.I.); Division of Epidemiology and Prevention, Aichi Cancer Center Research Institute, Nagoya, Japan (H.T.); and Hisayama Research Institute for Lifestyle Diseases, Fukuoka, Japan (Y. Kiyohara).
1,
Akimune Fukushima
Akimune Fukushima, MD
1From the Division of Biomedical Information Analysis (T.H., R.F., Y.S., H.O., K. Ono, M. Satoh, A.S.), Division of Biobank and Data Management (T.H., Y.S., M. Satoh), Division of Clinical Research and Epidemiology (K. Tanno, K. Sakata), Division of Innovation and Education (A.F.), Division of Community Medical Supports and Health Record Informatics (M. Satoh), and Division of Public Relations and Planning (R.E.), Iwate Tohoku Medical Megabank Organization (M. Sasaki, S.K., K. Ogasawara, M.N., J. Hitomi, K. Sobue), Iwate Medical University, Japan; Laboratory for Statistical Analysis (Y. Kamatani, A.T.), RIKEN Center for Integrative Medical Sciences, Kanagawa, Japan (M.K.); Laboratory for Omics Informatics, Omics Research Center, National Cerebral and Cardiovascular Center, Osaka, Japan (A.T.); Department of Environmental Medicine (J. Hata), Department of Medicine and Clinical Science (J. Hata, T.A., T.K.), and Center for Cohort Studies (J. Hata, T.N., T.K.), Graduate School of Medical Sciences, Kyushu University, Fukuoka, Japan; Epidemiology and Prevention Group, Center for Public Health Sciences, National Cancer Center, Tokyo, Japan (T.Y., N.S., M.I., S.T.); Department of Preventive Medicine, Faculty of Medicine, Saga University, Japan (M.H., K. Tanaka); Department of Public Health, Shiga University of Medical Science, Japan (N.T., Y. Kita); Laboratory of Molecular Medicine, Human Genome Center, Institute of Medical Science, The University of Tokyo, Japan (K.M.); Department of Preventive Medicine (K.W.) and Department of Epidemiology (H.T.), Nagoya University Graduate School of Medicine, Japan; Department of Public Health Medicine, Faculty of Medicine, University of Tsukuba, Ibaraki, Japan (K.Y.); Department of Preventive Medicine and Epidemiology (A.H.), Department of Biobank (N.M.), and Department of Integrative Genomics (M.Y.), Tohoku Medical Megabank Organization, Tohoku University, Sendai, Japan; Faculty of Nursing Science, Tsuruga Nursing University, Fukui, Japan (Y. Kita); Public Health, Department of Social Medicine, Osaka University Graduate School of Medicine, Japan (H.I.); Division of Epidemiology and Prevention, Aichi Cancer Center Research Institute, Nagoya, Japan (H.T.); and Hisayama Research Institute for Lifestyle Diseases, Fukuoka, Japan (Y. Kiyohara).
1,
Atsushi Hozawa
Atsushi Hozawa, MD
1From the Division of Biomedical Information Analysis (T.H., R.F., Y.S., H.O., K. Ono, M. Satoh, A.S.), Division of Biobank and Data Management (T.H., Y.S., M. Satoh), Division of Clinical Research and Epidemiology (K. Tanno, K. Sakata), Division of Innovation and Education (A.F.), Division of Community Medical Supports and Health Record Informatics (M. Satoh), and Division of Public Relations and Planning (R.E.), Iwate Tohoku Medical Megabank Organization (M. Sasaki, S.K., K. Ogasawara, M.N., J. Hitomi, K. Sobue), Iwate Medical University, Japan; Laboratory for Statistical Analysis (Y. Kamatani, A.T.), RIKEN Center for Integrative Medical Sciences, Kanagawa, Japan (M.K.); Laboratory for Omics Informatics, Omics Research Center, National Cerebral and Cardiovascular Center, Osaka, Japan (A.T.); Department of Environmental Medicine (J. Hata), Department of Medicine and Clinical Science (J. Hata, T.A., T.K.), and Center for Cohort Studies (J. Hata, T.N., T.K.), Graduate School of Medical Sciences, Kyushu University, Fukuoka, Japan; Epidemiology and Prevention Group, Center for Public Health Sciences, National Cancer Center, Tokyo, Japan (T.Y., N.S., M.I., S.T.); Department of Preventive Medicine, Faculty of Medicine, Saga University, Japan (M.H., K. Tanaka); Department of Public Health, Shiga University of Medical Science, Japan (N.T., Y. Kita); Laboratory of Molecular Medicine, Human Genome Center, Institute of Medical Science, The University of Tokyo, Japan (K.M.); Department of Preventive Medicine (K.W.) and Department of Epidemiology (H.T.), Nagoya University Graduate School of Medicine, Japan; Department of Public Health Medicine, Faculty of Medicine, University of Tsukuba, Ibaraki, Japan (K.Y.); Department of Preventive Medicine and Epidemiology (A.H.), Department of Biobank (N.M.), and Department of Integrative Genomics (M.Y.), Tohoku Medical Megabank Organization, Tohoku University, Sendai, Japan; Faculty of Nursing Science, Tsuruga Nursing University, Fukui, Japan (Y. Kita); Public Health, Department of Social Medicine, Osaka University Graduate School of Medicine, Japan (H.I.); Division of Epidemiology and Prevention, Aichi Cancer Center Research Institute, Nagoya, Japan (H.T.); and Hisayama Research Institute for Lifestyle Diseases, Fukuoka, Japan (Y. Kiyohara).
1,
Naoko Minegishi
Naoko Minegishi, MD
1From the Division of Biomedical Information Analysis (T.H., R.F., Y.S., H.O., K. Ono, M. Satoh, A.S.), Division of Biobank and Data Management (T.H., Y.S., M. Satoh), Division of Clinical Research and Epidemiology (K. Tanno, K. Sakata), Division of Innovation and Education (A.F.), Division of Community Medical Supports and Health Record Informatics (M. Satoh), and Division of Public Relations and Planning (R.E.), Iwate Tohoku Medical Megabank Organization (M. Sasaki, S.K., K. Ogasawara, M.N., J. Hitomi, K. Sobue), Iwate Medical University, Japan; Laboratory for Statistical Analysis (Y. Kamatani, A.T.), RIKEN Center for Integrative Medical Sciences, Kanagawa, Japan (M.K.); Laboratory for Omics Informatics, Omics Research Center, National Cerebral and Cardiovascular Center, Osaka, Japan (A.T.); Department of Environmental Medicine (J. Hata), Department of Medicine and Clinical Science (J. Hata, T.A., T.K.), and Center for Cohort Studies (J. Hata, T.N., T.K.), Graduate School of Medical Sciences, Kyushu University, Fukuoka, Japan; Epidemiology and Prevention Group, Center for Public Health Sciences, National Cancer Center, Tokyo, Japan (T.Y., N.S., M.I., S.T.); Department of Preventive Medicine, Faculty of Medicine, Saga University, Japan (M.H., K. Tanaka); Department of Public Health, Shiga University of Medical Science, Japan (N.T., Y. Kita); Laboratory of Molecular Medicine, Human Genome Center, Institute of Medical Science, The University of Tokyo, Japan (K.M.); Department of Preventive Medicine (K.W.) and Department of Epidemiology (H.T.), Nagoya University Graduate School of Medicine, Japan; Department of Public Health Medicine, Faculty of Medicine, University of Tsukuba, Ibaraki, Japan (K.Y.); Department of Preventive Medicine and Epidemiology (A.H.), Department of Biobank (N.M.), and Department of Integrative Genomics (M.Y.), Tohoku Medical Megabank Organization, Tohoku University, Sendai, Japan; Faculty of Nursing Science, Tsuruga Nursing University, Fukui, Japan (Y. Kita); Public Health, Department of Social Medicine, Osaka University Graduate School of Medicine, Japan (H.I.); Division of Epidemiology and Prevention, Aichi Cancer Center Research Institute, Nagoya, Japan (H.T.); and Hisayama Research Institute for Lifestyle Diseases, Fukuoka, Japan (Y. Kiyohara).
1,
Mamoru Satoh
Mamoru Satoh, MD
1From the Division of Biomedical Information Analysis (T.H., R.F., Y.S., H.O., K. Ono, M. Satoh, A.S.), Division of Biobank and Data Management (T.H., Y.S., M. Satoh), Division of Clinical Research and Epidemiology (K. Tanno, K. Sakata), Division of Innovation and Education (A.F.), Division of Community Medical Supports and Health Record Informatics (M. Satoh), and Division of Public Relations and Planning (R.E.), Iwate Tohoku Medical Megabank Organization (M. Sasaki, S.K., K. Ogasawara, M.N., J. Hitomi, K. Sobue), Iwate Medical University, Japan; Laboratory for Statistical Analysis (Y. Kamatani, A.T.), RIKEN Center for Integrative Medical Sciences, Kanagawa, Japan (M.K.); Laboratory for Omics Informatics, Omics Research Center, National Cerebral and Cardiovascular Center, Osaka, Japan (A.T.); Department of Environmental Medicine (J. Hata), Department of Medicine and Clinical Science (J. Hata, T.A., T.K.), and Center for Cohort Studies (J. Hata, T.N., T.K.), Graduate School of Medical Sciences, Kyushu University, Fukuoka, Japan; Epidemiology and Prevention Group, Center for Public Health Sciences, National Cancer Center, Tokyo, Japan (T.Y., N.S., M.I., S.T.); Department of Preventive Medicine, Faculty of Medicine, Saga University, Japan (M.H., K. Tanaka); Department of Public Health, Shiga University of Medical Science, Japan (N.T., Y. Kita); Laboratory of Molecular Medicine, Human Genome Center, Institute of Medical Science, The University of Tokyo, Japan (K.M.); Department of Preventive Medicine (K.W.) and Department of Epidemiology (H.T.), Nagoya University Graduate School of Medicine, Japan; Department of Public Health Medicine, Faculty of Medicine, University of Tsukuba, Ibaraki, Japan (K.Y.); Department of Preventive Medicine and Epidemiology (A.H.), Department of Biobank (N.M.), and Department of Integrative Genomics (M.Y.), Tohoku Medical Megabank Organization, Tohoku University, Sendai, Japan; Faculty of Nursing Science, Tsuruga Nursing University, Fukui, Japan (Y. Kita); Public Health, Department of Social Medicine, Osaka University Graduate School of Medicine, Japan (H.I.); Division of Epidemiology and Prevention, Aichi Cancer Center Research Institute, Nagoya, Japan (H.T.); and Hisayama Research Institute for Lifestyle Diseases, Fukuoka, Japan (Y. Kiyohara).
1,
Ryujin Endo
Ryujin Endo, MD
1From the Division of Biomedical Information Analysis (T.H., R.F., Y.S., H.O., K. Ono, M. Satoh, A.S.), Division of Biobank and Data Management (T.H., Y.S., M. Satoh), Division of Clinical Research and Epidemiology (K. Tanno, K. Sakata), Division of Innovation and Education (A.F.), Division of Community Medical Supports and Health Record Informatics (M. Satoh), and Division of Public Relations and Planning (R.E.), Iwate Tohoku Medical Megabank Organization (M. Sasaki, S.K., K. Ogasawara, M.N., J. Hitomi, K. Sobue), Iwate Medical University, Japan; Laboratory for Statistical Analysis (Y. Kamatani, A.T.), RIKEN Center for Integrative Medical Sciences, Kanagawa, Japan (M.K.); Laboratory for Omics Informatics, Omics Research Center, National Cerebral and Cardiovascular Center, Osaka, Japan (A.T.); Department of Environmental Medicine (J. Hata), Department of Medicine and Clinical Science (J. Hata, T.A., T.K.), and Center for Cohort Studies (J. Hata, T.N., T.K.), Graduate School of Medical Sciences, Kyushu University, Fukuoka, Japan; Epidemiology and Prevention Group, Center for Public Health Sciences, National Cancer Center, Tokyo, Japan (T.Y., N.S., M.I., S.T.); Department of Preventive Medicine, Faculty of Medicine, Saga University, Japan (M.H., K. Tanaka); Department of Public Health, Shiga University of Medical Science, Japan (N.T., Y. Kita); Laboratory of Molecular Medicine, Human Genome Center, Institute of Medical Science, The University of Tokyo, Japan (K.M.); Department of Preventive Medicine (K.W.) and Department of Epidemiology (H.T.), Nagoya University Graduate School of Medicine, Japan; Department of Public Health Medicine, Faculty of Medicine, University of Tsukuba, Ibaraki, Japan (K.Y.); Department of Preventive Medicine and Epidemiology (A.H.), Department of Biobank (N.M.), and Department of Integrative Genomics (M.Y.), Tohoku Medical Megabank Organization, Tohoku University, Sendai, Japan; Faculty of Nursing Science, Tsuruga Nursing University, Fukui, Japan (Y. Kita); Public Health, Department of Social Medicine, Osaka University Graduate School of Medicine, Japan (H.I.); Division of Epidemiology and Prevention, Aichi Cancer Center Research Institute, Nagoya, Japan (H.T.); and Hisayama Research Institute for Lifestyle Diseases, Fukuoka, Japan (Y. Kiyohara).
1,
Makoto Sasaki
Makoto Sasaki, MD
1From the Division of Biomedical Information Analysis (T.H., R.F., Y.S., H.O., K. Ono, M. Satoh, A.S.), Division of Biobank and Data Management (T.H., Y.S., M. Satoh), Division of Clinical Research and Epidemiology (K. Tanno, K. Sakata), Division of Innovation and Education (A.F.), Division of Community Medical Supports and Health Record Informatics (M. Satoh), and Division of Public Relations and Planning (R.E.), Iwate Tohoku Medical Megabank Organization (M. Sasaki, S.K., K. Ogasawara, M.N., J. Hitomi, K. Sobue), Iwate Medical University, Japan; Laboratory for Statistical Analysis (Y. Kamatani, A.T.), RIKEN Center for Integrative Medical Sciences, Kanagawa, Japan (M.K.); Laboratory for Omics Informatics, Omics Research Center, National Cerebral and Cardiovascular Center, Osaka, Japan (A.T.); Department of Environmental Medicine (J. Hata), Department of Medicine and Clinical Science (J. Hata, T.A., T.K.), and Center for Cohort Studies (J. Hata, T.N., T.K.), Graduate School of Medical Sciences, Kyushu University, Fukuoka, Japan; Epidemiology and Prevention Group, Center for Public Health Sciences, National Cancer Center, Tokyo, Japan (T.Y., N.S., M.I., S.T.); Department of Preventive Medicine, Faculty of Medicine, Saga University, Japan (M.H., K. Tanaka); Department of Public Health, Shiga University of Medical Science, Japan (N.T., Y. Kita); Laboratory of Molecular Medicine, Human Genome Center, Institute of Medical Science, The University of Tokyo, Japan (K.M.); Department of Preventive Medicine (K.W.) and Department of Epidemiology (H.T.), Nagoya University Graduate School of Medicine, Japan; Department of Public Health Medicine, Faculty of Medicine, University of Tsukuba, Ibaraki, Japan (K.Y.); Department of Preventive Medicine and Epidemiology (A.H.), Department of Biobank (N.M.), and Department of Integrative Genomics (M.Y.), Tohoku Medical Megabank Organization, Tohoku University, Sendai, Japan; Faculty of Nursing Science, Tsuruga Nursing University, Fukui, Japan (Y. Kita); Public Health, Department of Social Medicine, Osaka University Graduate School of Medicine, Japan (H.I.); Division of Epidemiology and Prevention, Aichi Cancer Center Research Institute, Nagoya, Japan (H.T.); and Hisayama Research Institute for Lifestyle Diseases, Fukuoka, Japan (Y. Kiyohara).
1,
Kiyomi Sakata
Kiyomi Sakata, MD
1From the Division of Biomedical Information Analysis (T.H., R.F., Y.S., H.O., K. Ono, M. Satoh, A.S.), Division of Biobank and Data Management (T.H., Y.S., M. Satoh), Division of Clinical Research and Epidemiology (K. Tanno, K. Sakata), Division of Innovation and Education (A.F.), Division of Community Medical Supports and Health Record Informatics (M. Satoh), and Division of Public Relations and Planning (R.E.), Iwate Tohoku Medical Megabank Organization (M. Sasaki, S.K., K. Ogasawara, M.N., J. Hitomi, K. Sobue), Iwate Medical University, Japan; Laboratory for Statistical Analysis (Y. Kamatani, A.T.), RIKEN Center for Integrative Medical Sciences, Kanagawa, Japan (M.K.); Laboratory for Omics Informatics, Omics Research Center, National Cerebral and Cardiovascular Center, Osaka, Japan (A.T.); Department of Environmental Medicine (J. Hata), Department of Medicine and Clinical Science (J. Hata, T.A., T.K.), and Center for Cohort Studies (J. Hata, T.N., T.K.), Graduate School of Medical Sciences, Kyushu University, Fukuoka, Japan; Epidemiology and Prevention Group, Center for Public Health Sciences, National Cancer Center, Tokyo, Japan (T.Y., N.S., M.I., S.T.); Department of Preventive Medicine, Faculty of Medicine, Saga University, Japan (M.H., K. Tanaka); Department of Public Health, Shiga University of Medical Science, Japan (N.T., Y. Kita); Laboratory of Molecular Medicine, Human Genome Center, Institute of Medical Science, The University of Tokyo, Japan (K.M.); Department of Preventive Medicine (K.W.) and Department of Epidemiology (H.T.), Nagoya University Graduate School of Medicine, Japan; Department of Public Health Medicine, Faculty of Medicine, University of Tsukuba, Ibaraki, Japan (K.Y.); Department of Preventive Medicine and Epidemiology (A.H.), Department of Biobank (N.M.), and Department of Integrative Genomics (M.Y.), Tohoku Medical Megabank Organization, Tohoku University, Sendai, Japan; Faculty of Nursing Science, Tsuruga Nursing University, Fukui, Japan (Y. Kita); Public Health, Department of Social Medicine, Osaka University Graduate School of Medicine, Japan (H.I.); Division of Epidemiology and Prevention, Aichi Cancer Center Research Institute, Nagoya, Japan (H.T.); and Hisayama Research Institute for Lifestyle Diseases, Fukuoka, Japan (Y. Kiyohara).
1,
Seiichiro Kobayashi
Seiichiro Kobayashi, MD
1From the Division of Biomedical Information Analysis (T.H., R.F., Y.S., H.O., K. Ono, M. Satoh, A.S.), Division of Biobank and Data Management (T.H., Y.S., M. Satoh), Division of Clinical Research and Epidemiology (K. Tanno, K. Sakata), Division of Innovation and Education (A.F.), Division of Community Medical Supports and Health Record Informatics (M. Satoh), and Division of Public Relations and Planning (R.E.), Iwate Tohoku Medical Megabank Organization (M. Sasaki, S.K., K. Ogasawara, M.N., J. Hitomi, K. Sobue), Iwate Medical University, Japan; Laboratory for Statistical Analysis (Y. Kamatani, A.T.), RIKEN Center for Integrative Medical Sciences, Kanagawa, Japan (M.K.); Laboratory for Omics Informatics, Omics Research Center, National Cerebral and Cardiovascular Center, Osaka, Japan (A.T.); Department of Environmental Medicine (J. Hata), Department of Medicine and Clinical Science (J. Hata, T.A., T.K.), and Center for Cohort Studies (J. Hata, T.N., T.K.), Graduate School of Medical Sciences, Kyushu University, Fukuoka, Japan; Epidemiology and Prevention Group, Center for Public Health Sciences, National Cancer Center, Tokyo, Japan (T.Y., N.S., M.I., S.T.); Department of Preventive Medicine, Faculty of Medicine, Saga University, Japan (M.H., K. Tanaka); Department of Public Health, Shiga University of Medical Science, Japan (N.T., Y. Kita); Laboratory of Molecular Medicine, Human Genome Center, Institute of Medical Science, The University of Tokyo, Japan (K.M.); Department of Preventive Medicine (K.W.) and Department of Epidemiology (H.T.), Nagoya University Graduate School of Medicine, Japan; Department of Public Health Medicine, Faculty of Medicine, University of Tsukuba, Ibaraki, Japan (K.Y.); Department of Preventive Medicine and Epidemiology (A.H.), Department of Biobank (N.M.), and Department of Integrative Genomics (M.Y.), Tohoku Medical Megabank Organization, Tohoku University, Sendai, Japan; Faculty of Nursing Science, Tsuruga Nursing University, Fukui, Japan (Y. Kita); Public Health, Department of Social Medicine, Osaka University Graduate School of Medicine, Japan (H.I.); Division of Epidemiology and Prevention, Aichi Cancer Center Research Institute, Nagoya, Japan (H.T.); and Hisayama Research Institute for Lifestyle Diseases, Fukuoka, Japan (Y. Kiyohara).
1,
Kuniaki Ogasawara
Kuniaki Ogasawara, MD
1From the Division of Biomedical Information Analysis (T.H., R.F., Y.S., H.O., K. Ono, M. Satoh, A.S.), Division of Biobank and Data Management (T.H., Y.S., M. Satoh), Division of Clinical Research and Epidemiology (K. Tanno, K. Sakata), Division of Innovation and Education (A.F.), Division of Community Medical Supports and Health Record Informatics (M. Satoh), and Division of Public Relations and Planning (R.E.), Iwate Tohoku Medical Megabank Organization (M. Sasaki, S.K., K. Ogasawara, M.N., J. Hitomi, K. Sobue), Iwate Medical University, Japan; Laboratory for Statistical Analysis (Y. Kamatani, A.T.), RIKEN Center for Integrative Medical Sciences, Kanagawa, Japan (M.K.); Laboratory for Omics Informatics, Omics Research Center, National Cerebral and Cardiovascular Center, Osaka, Japan (A.T.); Department of Environmental Medicine (J. Hata), Department of Medicine and Clinical Science (J. Hata, T.A., T.K.), and Center for Cohort Studies (J. Hata, T.N., T.K.), Graduate School of Medical Sciences, Kyushu University, Fukuoka, Japan; Epidemiology and Prevention Group, Center for Public Health Sciences, National Cancer Center, Tokyo, Japan (T.Y., N.S., M.I., S.T.); Department of Preventive Medicine, Faculty of Medicine, Saga University, Japan (M.H., K. Tanaka); Department of Public Health, Shiga University of Medical Science, Japan (N.T., Y. Kita); Laboratory of Molecular Medicine, Human Genome Center, Institute of Medical Science, The University of Tokyo, Japan (K.M.); Department of Preventive Medicine (K.W.) and Department of Epidemiology (H.T.), Nagoya University Graduate School of Medicine, Japan; Department of Public Health Medicine, Faculty of Medicine, University of Tsukuba, Ibaraki, Japan (K.Y.); Department of Preventive Medicine and Epidemiology (A.H.), Department of Biobank (N.M.), and Department of Integrative Genomics (M.Y.), Tohoku Medical Megabank Organization, Tohoku University, Sendai, Japan; Faculty of Nursing Science, Tsuruga Nursing University, Fukui, Japan (Y. Kita); Public Health, Department of Social Medicine, Osaka University Graduate School of Medicine, Japan (H.I.); Division of Epidemiology and Prevention, Aichi Cancer Center Research Institute, Nagoya, Japan (H.T.); and Hisayama Research Institute for Lifestyle Diseases, Fukuoka, Japan (Y. Kiyohara).
1,
Motoyuki Nakamura
Motoyuki Nakamura, MD
1From the Division of Biomedical Information Analysis (T.H., R.F., Y.S., H.O., K. Ono, M. Satoh, A.S.), Division of Biobank and Data Management (T.H., Y.S., M. Satoh), Division of Clinical Research and Epidemiology (K. Tanno, K. Sakata), Division of Innovation and Education (A.F.), Division of Community Medical Supports and Health Record Informatics (M. Satoh), and Division of Public Relations and Planning (R.E.), Iwate Tohoku Medical Megabank Organization (M. Sasaki, S.K., K. Ogasawara, M.N., J. Hitomi, K. Sobue), Iwate Medical University, Japan; Laboratory for Statistical Analysis (Y. Kamatani, A.T.), RIKEN Center for Integrative Medical Sciences, Kanagawa, Japan (M.K.); Laboratory for Omics Informatics, Omics Research Center, National Cerebral and Cardiovascular Center, Osaka, Japan (A.T.); Department of Environmental Medicine (J. Hata), Department of Medicine and Clinical Science (J. Hata, T.A., T.K.), and Center for Cohort Studies (J. Hata, T.N., T.K.), Graduate School of Medical Sciences, Kyushu University, Fukuoka, Japan; Epidemiology and Prevention Group, Center for Public Health Sciences, National Cancer Center, Tokyo, Japan (T.Y., N.S., M.I., S.T.); Department of Preventive Medicine, Faculty of Medicine, Saga University, Japan (M.H., K. Tanaka); Department of Public Health, Shiga University of Medical Science, Japan (N.T., Y. Kita); Laboratory of Molecular Medicine, Human Genome Center, Institute of Medical Science, The University of Tokyo, Japan (K.M.); Department of Preventive Medicine (K.W.) and Department of Epidemiology (H.T.), Nagoya University Graduate School of Medicine, Japan; Department of Public Health Medicine, Faculty of Medicine, University of Tsukuba, Ibaraki, Japan (K.Y.); Department of Preventive Medicine and Epidemiology (A.H.), Department of Biobank (N.M.), and Department of Integrative Genomics (M.Y.), Tohoku Medical Megabank Organization, Tohoku University, Sendai, Japan; Faculty of Nursing Science, Tsuruga Nursing University, Fukui, Japan (Y. Kita); Public Health, Department of Social Medicine, Osaka University Graduate School of Medicine, Japan (H.I.); Division of Epidemiology and Prevention, Aichi Cancer Center Research Institute, Nagoya, Japan (H.T.); and Hisayama Research Institute for Lifestyle Diseases, Fukuoka, Japan (Y. Kiyohara).
1,
Jiro Hitomi
Jiro Hitomi, MD
1From the Division of Biomedical Information Analysis (T.H., R.F., Y.S., H.O., K. Ono, M. Satoh, A.S.), Division of Biobank and Data Management (T.H., Y.S., M. Satoh), Division of Clinical Research and Epidemiology (K. Tanno, K. Sakata), Division of Innovation and Education (A.F.), Division of Community Medical Supports and Health Record Informatics (M. Satoh), and Division of Public Relations and Planning (R.E.), Iwate Tohoku Medical Megabank Organization (M. Sasaki, S.K., K. Ogasawara, M.N., J. Hitomi, K. Sobue), Iwate Medical University, Japan; Laboratory for Statistical Analysis (Y. Kamatani, A.T.), RIKEN Center for Integrative Medical Sciences, Kanagawa, Japan (M.K.); Laboratory for Omics Informatics, Omics Research Center, National Cerebral and Cardiovascular Center, Osaka, Japan (A.T.); Department of Environmental Medicine (J. Hata), Department of Medicine and Clinical Science (J. Hata, T.A., T.K.), and Center for Cohort Studies (J. Hata, T.N., T.K.), Graduate School of Medical Sciences, Kyushu University, Fukuoka, Japan; Epidemiology and Prevention Group, Center for Public Health Sciences, National Cancer Center, Tokyo, Japan (T.Y., N.S., M.I., S.T.); Department of Preventive Medicine, Faculty of Medicine, Saga University, Japan (M.H., K. Tanaka); Department of Public Health, Shiga University of Medical Science, Japan (N.T., Y. Kita); Laboratory of Molecular Medicine, Human Genome Center, Institute of Medical Science, The University of Tokyo, Japan (K.M.); Department of Preventive Medicine (K.W.) and Department of Epidemiology (H.T.), Nagoya University Graduate School of Medicine, Japan; Department of Public Health Medicine, Faculty of Medicine, University of Tsukuba, Ibaraki, Japan (K.Y.); Department of Preventive Medicine and Epidemiology (A.H.), Department of Biobank (N.M.), and Department of Integrative Genomics (M.Y.), Tohoku Medical Megabank Organization, Tohoku University, Sendai, Japan; Faculty of Nursing Science, Tsuruga Nursing University, Fukui, Japan (Y. Kita); Public Health, Department of Social Medicine, Osaka University Graduate School of Medicine, Japan (H.I.); Division of Epidemiology and Prevention, Aichi Cancer Center Research Institute, Nagoya, Japan (H.T.); and Hisayama Research Institute for Lifestyle Diseases, Fukuoka, Japan (Y. Kiyohara).
1,
Yoshikuni Kita
Yoshikuni Kita, PhD
1From the Division of Biomedical Information Analysis (T.H., R.F., Y.S., H.O., K. Ono, M. Satoh, A.S.), Division of Biobank and Data Management (T.H., Y.S., M. Satoh), Division of Clinical Research and Epidemiology (K. Tanno, K. Sakata), Division of Innovation and Education (A.F.), Division of Community Medical Supports and Health Record Informatics (M. Satoh), and Division of Public Relations and Planning (R.E.), Iwate Tohoku Medical Megabank Organization (M. Sasaki, S.K., K. Ogasawara, M.N., J. Hitomi, K. Sobue), Iwate Medical University, Japan; Laboratory for Statistical Analysis (Y. Kamatani, A.T.), RIKEN Center for Integrative Medical Sciences, Kanagawa, Japan (M.K.); Laboratory for Omics Informatics, Omics Research Center, National Cerebral and Cardiovascular Center, Osaka, Japan (A.T.); Department of Environmental Medicine (J. Hata), Department of Medicine and Clinical Science (J. Hata, T.A., T.K.), and Center for Cohort Studies (J. Hata, T.N., T.K.), Graduate School of Medical Sciences, Kyushu University, Fukuoka, Japan; Epidemiology and Prevention Group, Center for Public Health Sciences, National Cancer Center, Tokyo, Japan (T.Y., N.S., M.I., S.T.); Department of Preventive Medicine, Faculty of Medicine, Saga University, Japan (M.H., K. Tanaka); Department of Public Health, Shiga University of Medical Science, Japan (N.T., Y. Kita); Laboratory of Molecular Medicine, Human Genome Center, Institute of Medical Science, The University of Tokyo, Japan (K.M.); Department of Preventive Medicine (K.W.) and Department of Epidemiology (H.T.), Nagoya University Graduate School of Medicine, Japan; Department of Public Health Medicine, Faculty of Medicine, University of Tsukuba, Ibaraki, Japan (K.Y.); Department of Preventive Medicine and Epidemiology (A.H.), Department of Biobank (N.M.), and Department of Integrative Genomics (M.Y.), Tohoku Medical Megabank Organization, Tohoku University, Sendai, Japan; Faculty of Nursing Science, Tsuruga Nursing University, Fukui, Japan (Y. Kita); Public Health, Department of Social Medicine, Osaka University Graduate School of Medicine, Japan (H.I.); Division of Epidemiology and Prevention, Aichi Cancer Center Research Institute, Nagoya, Japan (H.T.); and Hisayama Research Institute for Lifestyle Diseases, Fukuoka, Japan (Y. Kiyohara).
1,
Keitaro Tanaka
Keitaro Tanaka, MD
1From the Division of Biomedical Information Analysis (T.H., R.F., Y.S., H.O., K. Ono, M. Satoh, A.S.), Division of Biobank and Data Management (T.H., Y.S., M. Satoh), Division of Clinical Research and Epidemiology (K. Tanno, K. Sakata), Division of Innovation and Education (A.F.), Division of Community Medical Supports and Health Record Informatics (M. Satoh), and Division of Public Relations and Planning (R.E.), Iwate Tohoku Medical Megabank Organization (M. Sasaki, S.K., K. Ogasawara, M.N., J. Hitomi, K. Sobue), Iwate Medical University, Japan; Laboratory for Statistical Analysis (Y. Kamatani, A.T.), RIKEN Center for Integrative Medical Sciences, Kanagawa, Japan (M.K.); Laboratory for Omics Informatics, Omics Research Center, National Cerebral and Cardiovascular Center, Osaka, Japan (A.T.); Department of Environmental Medicine (J. Hata), Department of Medicine and Clinical Science (J. Hata, T.A., T.K.), and Center for Cohort Studies (J. Hata, T.N., T.K.), Graduate School of Medical Sciences, Kyushu University, Fukuoka, Japan; Epidemiology and Prevention Group, Center for Public Health Sciences, National Cancer Center, Tokyo, Japan (T.Y., N.S., M.I., S.T.); Department of Preventive Medicine, Faculty of Medicine, Saga University, Japan (M.H., K. Tanaka); Department of Public Health, Shiga University of Medical Science, Japan (N.T., Y. Kita); Laboratory of Molecular Medicine, Human Genome Center, Institute of Medical Science, The University of Tokyo, Japan (K.M.); Department of Preventive Medicine (K.W.) and Department of Epidemiology (H.T.), Nagoya University Graduate School of Medicine, Japan; Department of Public Health Medicine, Faculty of Medicine, University of Tsukuba, Ibaraki, Japan (K.Y.); Department of Preventive Medicine and Epidemiology (A.H.), Department of Biobank (N.M.), and Department of Integrative Genomics (M.Y.), Tohoku Medical Megabank Organization, Tohoku University, Sendai, Japan; Faculty of Nursing Science, Tsuruga Nursing University, Fukui, Japan (Y. Kita); Public Health, Department of Social Medicine, Osaka University Graduate School of Medicine, Japan (H.I.); Division of Epidemiology and Prevention, Aichi Cancer Center Research Institute, Nagoya, Japan (H.T.); and Hisayama Research Institute for Lifestyle Diseases, Fukuoka, Japan (Y. Kiyohara).
1,
Hiroyasu Iso
Hiroyasu Iso, MD
1From the Division of Biomedical Information Analysis (T.H., R.F., Y.S., H.O., K. Ono, M. Satoh, A.S.), Division of Biobank and Data Management (T.H., Y.S., M. Satoh), Division of Clinical Research and Epidemiology (K. Tanno, K. Sakata), Division of Innovation and Education (A.F.), Division of Community Medical Supports and Health Record Informatics (M. Satoh), and Division of Public Relations and Planning (R.E.), Iwate Tohoku Medical Megabank Organization (M. Sasaki, S.K., K. Ogasawara, M.N., J. Hitomi, K. Sobue), Iwate Medical University, Japan; Laboratory for Statistical Analysis (Y. Kamatani, A.T.), RIKEN Center for Integrative Medical Sciences, Kanagawa, Japan (M.K.); Laboratory for Omics Informatics, Omics Research Center, National Cerebral and Cardiovascular Center, Osaka, Japan (A.T.); Department of Environmental Medicine (J. Hata), Department of Medicine and Clinical Science (J. Hata, T.A., T.K.), and Center for Cohort Studies (J. Hata, T.N., T.K.), Graduate School of Medical Sciences, Kyushu University, Fukuoka, Japan; Epidemiology and Prevention Group, Center for Public Health Sciences, National Cancer Center, Tokyo, Japan (T.Y., N.S., M.I., S.T.); Department of Preventive Medicine, Faculty of Medicine, Saga University, Japan (M.H., K. Tanaka); Department of Public Health, Shiga University of Medical Science, Japan (N.T., Y. Kita); Laboratory of Molecular Medicine, Human Genome Center, Institute of Medical Science, The University of Tokyo, Japan (K.M.); Department of Preventive Medicine (K.W.) and Department of Epidemiology (H.T.), Nagoya University Graduate School of Medicine, Japan; Department of Public Health Medicine, Faculty of Medicine, University of Tsukuba, Ibaraki, Japan (K.Y.); Department of Preventive Medicine and Epidemiology (A.H.), Department of Biobank (N.M.), and Department of Integrative Genomics (M.Y.), Tohoku Medical Megabank Organization, Tohoku University, Sendai, Japan; Faculty of Nursing Science, Tsuruga Nursing University, Fukui, Japan (Y. Kita); Public Health, Department of Social Medicine, Osaka University Graduate School of Medicine, Japan (H.I.); Division of Epidemiology and Prevention, Aichi Cancer Center Research Institute, Nagoya, Japan (H.T.); and Hisayama Research Institute for Lifestyle Diseases, Fukuoka, Japan (Y. Kiyohara).
1,
Takanari Kitazono
Takanari Kitazono, MD
1From the Division of Biomedical Information Analysis (T.H., R.F., Y.S., H.O., K. Ono, M. Satoh, A.S.), Division of Biobank and Data Management (T.H., Y.S., M. Satoh), Division of Clinical Research and Epidemiology (K. Tanno, K. Sakata), Division of Innovation and Education (A.F.), Division of Community Medical Supports and Health Record Informatics (M. Satoh), and Division of Public Relations and Planning (R.E.), Iwate Tohoku Medical Megabank Organization (M. Sasaki, S.K., K. Ogasawara, M.N., J. Hitomi, K. Sobue), Iwate Medical University, Japan; Laboratory for Statistical Analysis (Y. Kamatani, A.T.), RIKEN Center for Integrative Medical Sciences, Kanagawa, Japan (M.K.); Laboratory for Omics Informatics, Omics Research Center, National Cerebral and Cardiovascular Center, Osaka, Japan (A.T.); Department of Environmental Medicine (J. Hata), Department of Medicine and Clinical Science (J. Hata, T.A., T.K.), and Center for Cohort Studies (J. Hata, T.N., T.K.), Graduate School of Medical Sciences, Kyushu University, Fukuoka, Japan; Epidemiology and Prevention Group, Center for Public Health Sciences, National Cancer Center, Tokyo, Japan (T.Y., N.S., M.I., S.T.); Department of Preventive Medicine, Faculty of Medicine, Saga University, Japan (M.H., K. Tanaka); Department of Public Health, Shiga University of Medical Science, Japan (N.T., Y. Kita); Laboratory of Molecular Medicine, Human Genome Center, Institute of Medical Science, The University of Tokyo, Japan (K.M.); Department of Preventive Medicine (K.W.) and Department of Epidemiology (H.T.), Nagoya University Graduate School of Medicine, Japan; Department of Public Health Medicine, Faculty of Medicine, University of Tsukuba, Ibaraki, Japan (K.Y.); Department of Preventive Medicine and Epidemiology (A.H.), Department of Biobank (N.M.), and Department of Integrative Genomics (M.Y.), Tohoku Medical Megabank Organization, Tohoku University, Sendai, Japan; Faculty of Nursing Science, Tsuruga Nursing University, Fukui, Japan (Y. Kita); Public Health, Department of Social Medicine, Osaka University Graduate School of Medicine, Japan (H.I.); Division of Epidemiology and Prevention, Aichi Cancer Center Research Institute, Nagoya, Japan (H.T.); and Hisayama Research Institute for Lifestyle Diseases, Fukuoka, Japan (Y. Kiyohara).
1,
Michiaki Kubo
Michiaki Kubo, MD
1From the Division of Biomedical Information Analysis (T.H., R.F., Y.S., H.O., K. Ono, M. Satoh, A.S.), Division of Biobank and Data Management (T.H., Y.S., M. Satoh), Division of Clinical Research and Epidemiology (K. Tanno, K. Sakata), Division of Innovation and Education (A.F.), Division of Community Medical Supports and Health Record Informatics (M. Satoh), and Division of Public Relations and Planning (R.E.), Iwate Tohoku Medical Megabank Organization (M. Sasaki, S.K., K. Ogasawara, M.N., J. Hitomi, K. Sobue), Iwate Medical University, Japan; Laboratory for Statistical Analysis (Y. Kamatani, A.T.), RIKEN Center for Integrative Medical Sciences, Kanagawa, Japan (M.K.); Laboratory for Omics Informatics, Omics Research Center, National Cerebral and Cardiovascular Center, Osaka, Japan (A.T.); Department of Environmental Medicine (J. Hata), Department of Medicine and Clinical Science (J. Hata, T.A., T.K.), and Center for Cohort Studies (J. Hata, T.N., T.K.), Graduate School of Medical Sciences, Kyushu University, Fukuoka, Japan; Epidemiology and Prevention Group, Center for Public Health Sciences, National Cancer Center, Tokyo, Japan (T.Y., N.S., M.I., S.T.); Department of Preventive Medicine, Faculty of Medicine, Saga University, Japan (M.H., K. Tanaka); Department of Public Health, Shiga University of Medical Science, Japan (N.T., Y. Kita); Laboratory of Molecular Medicine, Human Genome Center, Institute of Medical Science, The University of Tokyo, Japan (K.M.); Department of Preventive Medicine (K.W.) and Department of Epidemiology (H.T.), Nagoya University Graduate School of Medicine, Japan; Department of Public Health Medicine, Faculty of Medicine, University of Tsukuba, Ibaraki, Japan (K.Y.); Department of Preventive Medicine and Epidemiology (A.H.), Department of Biobank (N.M.), and Department of Integrative Genomics (M.Y.), Tohoku Medical Megabank Organization, Tohoku University, Sendai, Japan; Faculty of Nursing Science, Tsuruga Nursing University, Fukui, Japan (Y. Kita); Public Health, Department of Social Medicine, Osaka University Graduate School of Medicine, Japan (H.I.); Division of Epidemiology and Prevention, Aichi Cancer Center Research Institute, Nagoya, Japan (H.T.); and Hisayama Research Institute for Lifestyle Diseases, Fukuoka, Japan (Y. Kiyohara).
1,
Hideo Tanaka
Hideo Tanaka, MD
1From the Division of Biomedical Information Analysis (T.H., R.F., Y.S., H.O., K. Ono, M. Satoh, A.S.), Division of Biobank and Data Management (T.H., Y.S., M. Satoh), Division of Clinical Research and Epidemiology (K. Tanno, K. Sakata), Division of Innovation and Education (A.F.), Division of Community Medical Supports and Health Record Informatics (M. Satoh), and Division of Public Relations and Planning (R.E.), Iwate Tohoku Medical Megabank Organization (M. Sasaki, S.K., K. Ogasawara, M.N., J. Hitomi, K. Sobue), Iwate Medical University, Japan; Laboratory for Statistical Analysis (Y. Kamatani, A.T.), RIKEN Center for Integrative Medical Sciences, Kanagawa, Japan (M.K.); Laboratory for Omics Informatics, Omics Research Center, National Cerebral and Cardiovascular Center, Osaka, Japan (A.T.); Department of Environmental Medicine (J. Hata), Department of Medicine and Clinical Science (J. Hata, T.A., T.K.), and Center for Cohort Studies (J. Hata, T.N., T.K.), Graduate School of Medical Sciences, Kyushu University, Fukuoka, Japan; Epidemiology and Prevention Group, Center for Public Health Sciences, National Cancer Center, Tokyo, Japan (T.Y., N.S., M.I., S.T.); Department of Preventive Medicine, Faculty of Medicine, Saga University, Japan (M.H., K. Tanaka); Department of Public Health, Shiga University of Medical Science, Japan (N.T., Y. Kita); Laboratory of Molecular Medicine, Human Genome Center, Institute of Medical Science, The University of Tokyo, Japan (K.M.); Department of Preventive Medicine (K.W.) and Department of Epidemiology (H.T.), Nagoya University Graduate School of Medicine, Japan; Department of Public Health Medicine, Faculty of Medicine, University of Tsukuba, Ibaraki, Japan (K.Y.); Department of Preventive Medicine and Epidemiology (A.H.), Department of Biobank (N.M.), and Department of Integrative Genomics (M.Y.), Tohoku Medical Megabank Organization, Tohoku University, Sendai, Japan; Faculty of Nursing Science, Tsuruga Nursing University, Fukui, Japan (Y. Kita); Public Health, Department of Social Medicine, Osaka University Graduate School of Medicine, Japan (H.I.); Division of Epidemiology and Prevention, Aichi Cancer Center Research Institute, Nagoya, Japan (H.T.); and Hisayama Research Institute for Lifestyle Diseases, Fukuoka, Japan (Y. Kiyohara).
1,
Shoichiro Tsugane
Shoichiro Tsugane, MD
1From the Division of Biomedical Information Analysis (T.H., R.F., Y.S., H.O., K. Ono, M. Satoh, A.S.), Division of Biobank and Data Management (T.H., Y.S., M. Satoh), Division of Clinical Research and Epidemiology (K. Tanno, K. Sakata), Division of Innovation and Education (A.F.), Division of Community Medical Supports and Health Record Informatics (M. Satoh), and Division of Public Relations and Planning (R.E.), Iwate Tohoku Medical Megabank Organization (M. Sasaki, S.K., K. Ogasawara, M.N., J. Hitomi, K. Sobue), Iwate Medical University, Japan; Laboratory for Statistical Analysis (Y. Kamatani, A.T.), RIKEN Center for Integrative Medical Sciences, Kanagawa, Japan (M.K.); Laboratory for Omics Informatics, Omics Research Center, National Cerebral and Cardiovascular Center, Osaka, Japan (A.T.); Department of Environmental Medicine (J. Hata), Department of Medicine and Clinical Science (J. Hata, T.A., T.K.), and Center for Cohort Studies (J. Hata, T.N., T.K.), Graduate School of Medical Sciences, Kyushu University, Fukuoka, Japan; Epidemiology and Prevention Group, Center for Public Health Sciences, National Cancer Center, Tokyo, Japan (T.Y., N.S., M.I., S.T.); Department of Preventive Medicine, Faculty of Medicine, Saga University, Japan (M.H., K. Tanaka); Department of Public Health, Shiga University of Medical Science, Japan (N.T., Y. Kita); Laboratory of Molecular Medicine, Human Genome Center, Institute of Medical Science, The University of Tokyo, Japan (K.M.); Department of Preventive Medicine (K.W.) and Department of Epidemiology (H.T.), Nagoya University Graduate School of Medicine, Japan; Department of Public Health Medicine, Faculty of Medicine, University of Tsukuba, Ibaraki, Japan (K.Y.); Department of Preventive Medicine and Epidemiology (A.H.), Department of Biobank (N.M.), and Department of Integrative Genomics (M.Y.), Tohoku Medical Megabank Organization, Tohoku University, Sendai, Japan; Faculty of Nursing Science, Tsuruga Nursing University, Fukui, Japan (Y. Kita); Public Health, Department of Social Medicine, Osaka University Graduate School of Medicine, Japan (H.I.); Division of Epidemiology and Prevention, Aichi Cancer Center Research Institute, Nagoya, Japan (H.T.); and Hisayama Research Institute for Lifestyle Diseases, Fukuoka, Japan (Y. Kiyohara).
1,
Yutaka Kiyohara
Yutaka Kiyohara, MD
1From the Division of Biomedical Information Analysis (T.H., R.F., Y.S., H.O., K. Ono, M. Satoh, A.S.), Division of Biobank and Data Management (T.H., Y.S., M. Satoh), Division of Clinical Research and Epidemiology (K. Tanno, K. Sakata), Division of Innovation and Education (A.F.), Division of Community Medical Supports and Health Record Informatics (M. Satoh), and Division of Public Relations and Planning (R.E.), Iwate Tohoku Medical Megabank Organization (M. Sasaki, S.K., K. Ogasawara, M.N., J. Hitomi, K. Sobue), Iwate Medical University, Japan; Laboratory for Statistical Analysis (Y. Kamatani, A.T.), RIKEN Center for Integrative Medical Sciences, Kanagawa, Japan (M.K.); Laboratory for Omics Informatics, Omics Research Center, National Cerebral and Cardiovascular Center, Osaka, Japan (A.T.); Department of Environmental Medicine (J. Hata), Department of Medicine and Clinical Science (J. Hata, T.A., T.K.), and Center for Cohort Studies (J. Hata, T.N., T.K.), Graduate School of Medical Sciences, Kyushu University, Fukuoka, Japan; Epidemiology and Prevention Group, Center for Public Health Sciences, National Cancer Center, Tokyo, Japan (T.Y., N.S., M.I., S.T.); Department of Preventive Medicine, Faculty of Medicine, Saga University, Japan (M.H., K. Tanaka); Department of Public Health, Shiga University of Medical Science, Japan (N.T., Y. Kita); Laboratory of Molecular Medicine, Human Genome Center, Institute of Medical Science, The University of Tokyo, Japan (K.M.); Department of Preventive Medicine (K.W.) and Department of Epidemiology (H.T.), Nagoya University Graduate School of Medicine, Japan; Department of Public Health Medicine, Faculty of Medicine, University of Tsukuba, Ibaraki, Japan (K.Y.); Department of Preventive Medicine and Epidemiology (A.H.), Department of Biobank (N.M.), and Department of Integrative Genomics (M.Y.), Tohoku Medical Megabank Organization, Tohoku University, Sendai, Japan; Faculty of Nursing Science, Tsuruga Nursing University, Fukui, Japan (Y. Kita); Public Health, Department of Social Medicine, Osaka University Graduate School of Medicine, Japan (H.I.); Division of Epidemiology and Prevention, Aichi Cancer Center Research Institute, Nagoya, Japan (H.T.); and Hisayama Research Institute for Lifestyle Diseases, Fukuoka, Japan (Y. Kiyohara).
1,
Masayuki Yamamoto
Masayuki Yamamoto, MD
1From the Division of Biomedical Information Analysis (T.H., R.F., Y.S., H.O., K. Ono, M. Satoh, A.S.), Division of Biobank and Data Management (T.H., Y.S., M. Satoh), Division of Clinical Research and Epidemiology (K. Tanno, K. Sakata), Division of Innovation and Education (A.F.), Division of Community Medical Supports and Health Record Informatics (M. Satoh), and Division of Public Relations and Planning (R.E.), Iwate Tohoku Medical Megabank Organization (M. Sasaki, S.K., K. Ogasawara, M.N., J. Hitomi, K. Sobue), Iwate Medical University, Japan; Laboratory for Statistical Analysis (Y. Kamatani, A.T.), RIKEN Center for Integrative Medical Sciences, Kanagawa, Japan (M.K.); Laboratory for Omics Informatics, Omics Research Center, National Cerebral and Cardiovascular Center, Osaka, Japan (A.T.); Department of Environmental Medicine (J. Hata), Department of Medicine and Clinical Science (J. Hata, T.A., T.K.), and Center for Cohort Studies (J. Hata, T.N., T.K.), Graduate School of Medical Sciences, Kyushu University, Fukuoka, Japan; Epidemiology and Prevention Group, Center for Public Health Sciences, National Cancer Center, Tokyo, Japan (T.Y., N.S., M.I., S.T.); Department of Preventive Medicine, Faculty of Medicine, Saga University, Japan (M.H., K. Tanaka); Department of Public Health, Shiga University of Medical Science, Japan (N.T., Y. Kita); Laboratory of Molecular Medicine, Human Genome Center, Institute of Medical Science, The University of Tokyo, Japan (K.M.); Department of Preventive Medicine (K.W.) and Department of Epidemiology (H.T.), Nagoya University Graduate School of Medicine, Japan; Department of Public Health Medicine, Faculty of Medicine, University of Tsukuba, Ibaraki, Japan (K.Y.); Department of Preventive Medicine and Epidemiology (A.H.), Department of Biobank (N.M.), and Department of Integrative Genomics (M.Y.), Tohoku Medical Megabank Organization, Tohoku University, Sendai, Japan; Faculty of Nursing Science, Tsuruga Nursing University, Fukui, Japan (Y. Kita); Public Health, Department of Social Medicine, Osaka University Graduate School of Medicine, Japan (H.I.); Division of Epidemiology and Prevention, Aichi Cancer Center Research Institute, Nagoya, Japan (H.T.); and Hisayama Research Institute for Lifestyle Diseases, Fukuoka, Japan (Y. Kiyohara).
1,
Kenji Sobue
Kenji Sobue, MD
1From the Division of Biomedical Information Analysis (T.H., R.F., Y.S., H.O., K. Ono, M. Satoh, A.S.), Division of Biobank and Data Management (T.H., Y.S., M. Satoh), Division of Clinical Research and Epidemiology (K. Tanno, K. Sakata), Division of Innovation and Education (A.F.), Division of Community Medical Supports and Health Record Informatics (M. Satoh), and Division of Public Relations and Planning (R.E.), Iwate Tohoku Medical Megabank Organization (M. Sasaki, S.K., K. Ogasawara, M.N., J. Hitomi, K. Sobue), Iwate Medical University, Japan; Laboratory for Statistical Analysis (Y. Kamatani, A.T.), RIKEN Center for Integrative Medical Sciences, Kanagawa, Japan (M.K.); Laboratory for Omics Informatics, Omics Research Center, National Cerebral and Cardiovascular Center, Osaka, Japan (A.T.); Department of Environmental Medicine (J. Hata), Department of Medicine and Clinical Science (J. Hata, T.A., T.K.), and Center for Cohort Studies (J. Hata, T.N., T.K.), Graduate School of Medical Sciences, Kyushu University, Fukuoka, Japan; Epidemiology and Prevention Group, Center for Public Health Sciences, National Cancer Center, Tokyo, Japan (T.Y., N.S., M.I., S.T.); Department of Preventive Medicine, Faculty of Medicine, Saga University, Japan (M.H., K. Tanaka); Department of Public Health, Shiga University of Medical Science, Japan (N.T., Y. Kita); Laboratory of Molecular Medicine, Human Genome Center, Institute of Medical Science, The University of Tokyo, Japan (K.M.); Department of Preventive Medicine (K.W.) and Department of Epidemiology (H.T.), Nagoya University Graduate School of Medicine, Japan; Department of Public Health Medicine, Faculty of Medicine, University of Tsukuba, Ibaraki, Japan (K.Y.); Department of Preventive Medicine and Epidemiology (A.H.), Department of Biobank (N.M.), and Department of Integrative Genomics (M.Y.), Tohoku Medical Megabank Organization, Tohoku University, Sendai, Japan; Faculty of Nursing Science, Tsuruga Nursing University, Fukui, Japan (Y. Kita); Public Health, Department of Social Medicine, Osaka University Graduate School of Medicine, Japan (H.I.); Division of Epidemiology and Prevention, Aichi Cancer Center Research Institute, Nagoya, Japan (H.T.); and Hisayama Research Institute for Lifestyle Diseases, Fukuoka, Japan (Y. Kiyohara).
1,
Atsushi Shimizu
Atsushi Shimizu, PhD
1From the Division of Biomedical Information Analysis (T.H., R.F., Y.S., H.O., K. Ono, M. Satoh, A.S.), Division of Biobank and Data Management (T.H., Y.S., M. Satoh), Division of Clinical Research and Epidemiology (K. Tanno, K. Sakata), Division of Innovation and Education (A.F.), Division of Community Medical Supports and Health Record Informatics (M. Satoh), and Division of Public Relations and Planning (R.E.), Iwate Tohoku Medical Megabank Organization (M. Sasaki, S.K., K. Ogasawara, M.N., J. Hitomi, K. Sobue), Iwate Medical University, Japan; Laboratory for Statistical Analysis (Y. Kamatani, A.T.), RIKEN Center for Integrative Medical Sciences, Kanagawa, Japan (M.K.); Laboratory for Omics Informatics, Omics Research Center, National Cerebral and Cardiovascular Center, Osaka, Japan (A.T.); Department of Environmental Medicine (J. Hata), Department of Medicine and Clinical Science (J. Hata, T.A., T.K.), and Center for Cohort Studies (J. Hata, T.N., T.K.), Graduate School of Medical Sciences, Kyushu University, Fukuoka, Japan; Epidemiology and Prevention Group, Center for Public Health Sciences, National Cancer Center, Tokyo, Japan (T.Y., N.S., M.I., S.T.); Department of Preventive Medicine, Faculty of Medicine, Saga University, Japan (M.H., K. Tanaka); Department of Public Health, Shiga University of Medical Science, Japan (N.T., Y. Kita); Laboratory of Molecular Medicine, Human Genome Center, Institute of Medical Science, The University of Tokyo, Japan (K.M.); Department of Preventive Medicine (K.W.) and Department of Epidemiology (H.T.), Nagoya University Graduate School of Medicine, Japan; Department of Public Health Medicine, Faculty of Medicine, University of Tsukuba, Ibaraki, Japan (K.Y.); Department of Preventive Medicine and Epidemiology (A.H.), Department of Biobank (N.M.), and Department of Integrative Genomics (M.Y.), Tohoku Medical Megabank Organization, Tohoku University, Sendai, Japan; Faculty of Nursing Science, Tsuruga Nursing University, Fukui, Japan (Y. Kita); Public Health, Department of Social Medicine, Osaka University Graduate School of Medicine, Japan (H.I.); Division of Epidemiology and Prevention, Aichi Cancer Center Research Institute, Nagoya, Japan (H.T.); and Hisayama Research Institute for Lifestyle Diseases, Fukuoka, Japan (Y. Kiyohara).
1