Abstract
Variations in brain oxygen (O2) concentration can have profound effects on brain physiology. Thus, the ability to quantitate local O2 concentrations noninvasively in vivo could significantly enhance understanding of several brain pathologies. However, quantitative O2 mapping in the brain has proven difficult. The electron paramagnetic resonance (EPR) spectra of nitroxides are sensitive to molecular O2 and can be used to estimate O2 concentrations in aqueous media. We recently synthesized labile-ester-containing nitroxides, such as 3-acetoxymethoxycarbonyl-2,2,5,5-tetramethyl-1-pyrrolidinyloxyl (nitroxide 4), which accumulate in cerebral tissue after in situ hydrolysis, and thus enable spatial mapping of O2 concentrations in the mouse brain by EPR imaging. In an effort to improve O2 quantitation, we prepared 3-acetoxymethox ycarbonyl-2,2,5,5-tetra(2H3)methyl-1-(3,4,4-2H3,1-15N)pyrrolidinyloxyl (nitroxide 2), which proved to be a more sensitive probe than its normo-isotopic version for quantifying O2 in aqueous solutions of various O2 concentrations. We now demonstrate that this isotopically substituted nitroxide is ~2-fold more sensitive in vivo than the normo-isotopic nitroxide 4. Moreover, in vitro and in vivo EPR spectral-spatial imaging results with nitroxide 2 demonstrate significant improvement in resolution, reconstruction and spectral response to local O2 concentrations in cerebral tissue. Thus, isotopic-substituted nitroxides, such as 2, are excellent sensors for in vivo O2 quantitation in tissues, such as the brain.
Keywords: Labile-ester-containing nitroxides, 15N-perdeuterionitroxide, Electron paramagnetic resonance, In vivo oxygen probes, Blood brain barrier, Brain oxygen
1. Introduction
Molecular oxygen (O2) plays a central role in regulating a myriad of brain functions, including serving as the terminal electron acceptor for a broad spectrum of enzymes that catalyze the formation and metabolism of neurotransmitters, such as dopamine and serotonin. Local changes in O2 concentrations can therefore markedly impact brain physiology. Surprisingly, in light of the significance of O2 in brain physiology, O2 measurement in brain with different imaging modalities remains problematic. For instance, blood-oxygen-level-dependent (BOLD) MR imaging provides only qualitative estimates of O2 in tissues [1–3]. Thus, a noninvasive imaging method for real-time, in vivo O2 quantitation in brain would be valuable to understand the role of O2 in physiology and pathophysiology.
Molecular O2, being paramagnetic, broadens the electron paramagnetic resonance (EPR) spectral lines of other paramagnetic species, such as trityl radicals or nitroxides [2,4,5–9]. Measured changes in EPR spectral linewidth for these compounds have been used to estimate O2 concentrations in homogenous solutions [2]. With developments in low-frequency EPR spectroscopy with imaging capability [10] and the appropriate molecular probes, it is now feasible to make reliable real-time estimations of local O2 concentrations in vivo [11–20]. Despite the encouraging findings in [2], transporting O2-sensitive probes across the blood-brain barrier (BBB) has been problematic, when developing minimally invasive EPR imaging of O2 in the brain.
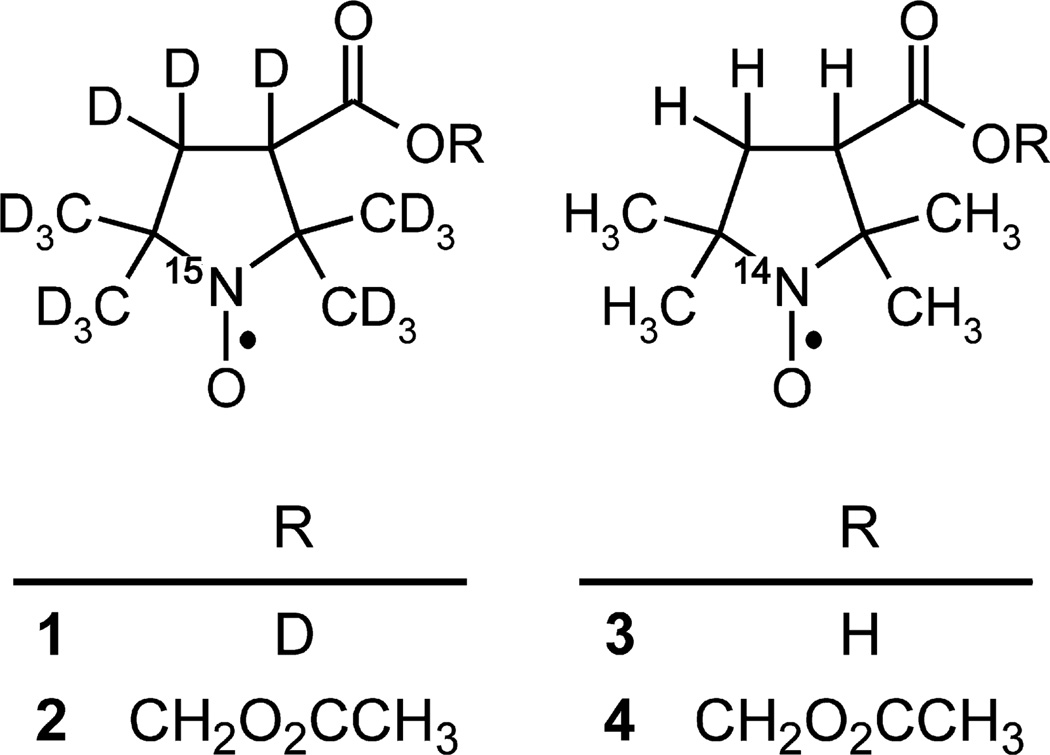
In a series of papers, we reported a family of labile-ester-containing nitroxides [21–24] that can cross the BBB to enter brain tissue, where esterases hydrolyze the esters to the corresponding carboxylates. The anionic character of the resulting carboxynitroxides, such as 4 (Fig. 1), at physiologic pH facilitates their trapping and accumulation in brain tissue, and confers resistance to bioreduction [11]. We have previously achieved sufficient levels of entrapped nitroxides in cerebral tissue to allow quantitation of O2 in different regions of the mouse brain following focal cerebral ischemia [4,12], while other groups have shown quantification of O2 in discrete tissues or targeting tumors using similar spin probes [13–16,18,20].
Fig. 1.
Chemical structures of nitroxides used in this study.
We envisioned improving the quality of O2 images by using isotopically-substituted nitroxides [15,17]. EPR imaging instrumentation measures the peak-to-peak height of one line in an EPR spectrum, thus wasting two-thirds of the EPR signal in the 3-line spectrum of an 14N- nitroxide. Substitution of 14N with 15N increases the signal-to-noise ratio (SNR) by splitting the nitroxide EPR signal into only two spectral lines that are each 50% taller. Perdeuteration further improves SNR by reducing spectral line width and consequently increasing peak height. Narrower line widths also improve the fundamental spatial resolution of nitroxides by reducing the distance the spectral signal occupies after spatial encoding by the magnetic field gradient [25–27]. Previously, we reported the synthesis of a 15N-perdeuterio-nitroxide, 1, and its acetoxymethyl (AM) ester, nitroxide 2 (Fig. 1) [27]. EPR linewidth measurements in aqueous solution showed that nitroxide 1 is ~3-fold more sensitive to O2 than its normo-isotopic counterpart, nitroxide 3. In the present study, we report that nitroxide 2 is a superior in vivo O2 indicator, and we determine the extent to which isotopically-substituted nitroxide 1 may improve O2 measurement in the brain of a mouse.
2. Material and methods
2.1. Nitroxides
3-(2H)carboxy-2,2,5,5-tetra(2H3)methyl-1-(3,4,4-2H3,1-15N)pyrrolidinyloxyl (nitroxide 1), 3-acetoxymethoxycarbonyl-2,2,5,5-tetra(2H3)methyl-1-(3,4,4-2H3,1-15N)pyrrolidinyloxyl (nitro-xide 2), 3-carboxy-2,2,5,5-tetramethyl-1-pyrrolidinyloxyl (nitroxide 3), and 3-acetoxymethoxycarbonyl-2,2,5,5-tetramethyl-1-pyrrolidiny loxyl (nitroxide 4) were synthesized as previously described [11,21,27].
2.2. Animals
Animal housing, care, and experimental protocols were approved and in accordance with the guidelines of Laboratory Animal Care and Use Committee of the UNM HSC. Male C57BL/6 mice, 16–20 g, were obtained from Charles River Laboratory (Wilmington, MA, USA). Mice were maintained in a climate-controlled vivarium with a 12 h light–dark cycle and free access to food and water.
2.3. In vitro 1 GHz (L-band) EPR spectroscopy
A solution of nitroxide 1 or 3 (100 µM in PBS) was placed in a gas-permeable Teflon tube (inside diameter: 0.813 mm; wall thickness: 0.038 ± 0.014 mm; Zeus Industries, Raritan, NJ, USA). The Teflon tube was folded into a “W” shape and fit into a quartz tube that was open at both ends; this assembly was inserted into an E540 surface probe resonator. The quartz tube was continually perfused with a gas mixture containing N2 and different concentrations of O2 (0%, 10%, 21%, and 95%). The O2 concentration in the samples was constantly monitored with a PA-1B oxygen analyzer (Sable Systems, Las Vegas, NV). EPR spectra were recorded with a Bruker E540L L-band EPR spectrometer (Bruker BioSpin, Billerica, MA) with the following parameters: microwave frequency, 1.07 GHz; microwave power, 5.7 mW; center field, 387 G (for full spectrum) and 361 G, or 356 G; modulation frequency, 50 kHz; receiver gain, 70 dB; modulation amplitude, 0.1 G and 0.3 G for nitroxides 1 and 3, respectively. For Fig. 2, linewidth and peak-to-peak amplitude were measured on the center peak in the 3-peak spectrum of nitroxide 3 and on the first peak of the 2-peak spectrum of nitroxide 1.
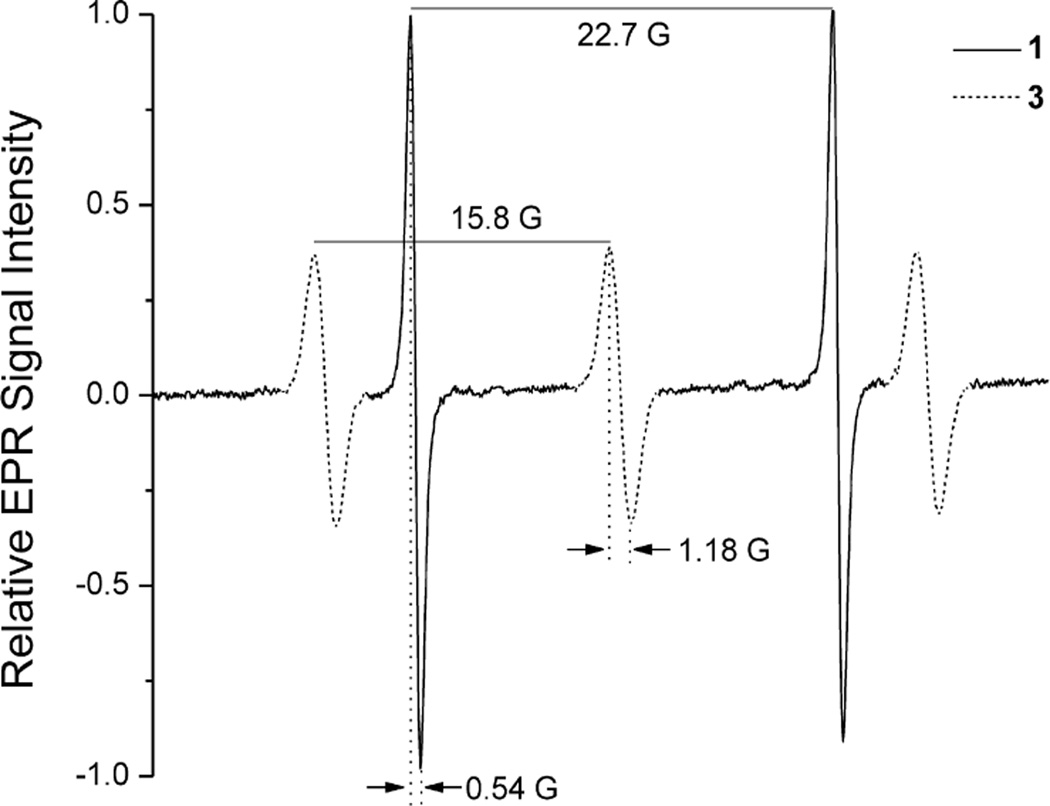
Fig. 2.
L-band EPR spectra of nitroxide 1 (solid line) and 3 (dashed line) in air-equilibrated phosphate-buffered saline. Peak-to-peak linewidths and hyperfine splittings are indicated.
2.4. In vivo 1 GHz (L-band) EPR spectroscopy
Male C57BL/6 mice (16–20 g) were from Charles River Laboratories, Inc. (Wilmington, MA, USA). Anesthesia was induced with 4% isoflurane inhalant in N2O/O2 (7:3) and maintained with 1% isoflurane in N2O/O2 (7:3). Animal core temperature was maintained at 37 °C with a heating pad or heat lamp. Nitroxides 2 and 4 were prepared as 50 mM solutions in PBS from a 0.5 M stock. Nitroxides were intravenously injected through the lateral tail vein at 0.4 mmol/kg body weight as previously described [4,28,29]. Prone positioned anesthetized mice (n = 5) were placed in a custom-made head holder for the small-animal head resonator of a Bruker E540L L-band EPR spectrometer. After placement of the mouse head in the center of the cavity, the resonator was tuned. Neither nitroxide caused obvious changes in animal behavior or any signs of acute toxicity. For each mouse, EPR spectra were recorded immediately after injection and instrument tuning, at different concentrations of respired measured O2 (0%, 10%, 21%, and 95%). The O2 concentration was constantly monitored with a PA-1B oxygen analyzer. Each acquired spectrum measures the total EPR signal in the mouse head, and is the sum of the signals from the injected nitroxides 2 and 4 and the hydrolytically-generated nitroxides 1 and 3. The following EPR acquisition parameters were used: microwave frequency, 1.04 GHz; microwave power, 18 mW; center field, 361 G and 356 G for nitroxides 2 and 4, respectively; modulation frequency, 50 kHz; receiver gain, 70 dB; modulation amplitude, 0.1 G and 0.3 G for nitroxides 2 and 4, respectively. Because of instrumental tuning and optimization, 60–90 s typically elapsed between nitroxide injection and start of EPR spectral acquisition. EPR spectral linewidths and peak amplitudes were estimated by spectral fitting.
2.5. In vitro 1 GHz (L-band) EPR imaging
A phantom containing capillaries (1.20 ± 0.05 mm ID; 1.65 ± 0.05 mm OD) of nitroxide 2 or 4 (100 µM in PBS) was placed in a custom holder for the small-animal head resonator of a Bruker E540L L-band EPR imaging system (Bruker BioSpin, Billerica, MA) equipped with 3D planar gradient sets. After placement of the phantom in the cavity, the resonator was tuned. Two-dimensional (2D) spectral-spatial images were acquired at room temperature with the same spectroscopic parameters as listed above and the following imaging parameters: gradient, 10 G/cm; spectrum width, 5 G; spectral resolution, 0.20833 G/p; pixel size, 0.5 mm; field of view, 12 mm; number of projections, 216; and acquisition time, 18 min. Other parameters were the same as for conventional 2D images. The 2D images were reconstructed by filtered back-projection and linewidth fitted using Bruker Xepr software. Peak-to-peak and Lorentzian derivative fitting gave the best linewidth image fit for nitroxide 2 and nitroxide 4 with a threshold of 1.699 and 0.020 determined by the back-projection, respectively.
2.6. In vivo 1 GHz (L-band) EPR imaging
Male C57BL/6 mice (16–20 g) were from Charles River Laboratories, Inc. (Wilmington, MA, USA). Anesthesia was induced with 4% isoflurane inhalant in N2O/O2 (7:3) and maintained with 1% isoflurane in N2O/O2 (7:3). Animal core temperature was maintained at 37 °C with a heating pad or heat lamp. Nitroxide 2 (1.95 mmole/kg body weight) was intraperitoneally (i.p.) administered into a mouse, 5 min prior to EPR acquisition as previously described [12]. Prone positioned anesthetized mouse was then transferred into the EPR cavity using a dedicated custom-made head holder for the small-animal-head resonator of a Bruker E540L L-band EPR imaging system equipped with 3D planar gradient sets. After positioning the mouse head in the center of the cavity, the resonator was tuned. EPR images were recorded immediately after thereafter, at different concentrations of respired measured O2 (21%, and 100%) during the experiments. The 2D spectral-spatial images were acquired with the same spectroscopy parameters as listed above and the following imaging parameters: gradient, 5 G/cm; spectrum width, 5 G; spectral resolution, 0.16667 G/p; pixel size, 0.5 mm; field of view, 15 mm; number of projections, 322; and acquisition time, 26.5 min. Other parameters were the same as for conventional 2D images. The 2D images were reconstructed by filtered back projection and linewidth fitted using Bruker Xepr software. Lorentzian derivative fitting (threshold of 0.214 (21%) and 0.170 (100%)) gave the best linewidth image fit for nitroxide 1.
2.7. Calibration of EPR spectrometer response
To ensure consistency in measurements, the Bruker EPR spectrometer is calibrated daily before experiments. Because the spectrometer detects the total number of unpaired electrons within the resonant cavity, a standard sample of a stable free radical is used for daily calibrations. The standard is DPPH (2,2-diphenyl-1-picrylhydrazyl; supplied by Bruker BioSpin). Reproducible recording of spectral parameters (e.g. EPR signal intensity and linewidth) for the standard confirms proper spectrometer function.
2.8. Statistical analysis
OriginPro (OriginLab, Northampton, MA) was used for data analysis and presentation. Data are represented as mean value ± SD.
3. Results and discussion
We previously described the spectral characteristics of nitroxides 1 and 3 and the dependence of their EPR spectral linewidths as a function of O2 concentration at 9.5 GHz [27]. Microwaves at this frequency penetrate tissue poorly, making in vivo EPR imaging impractical. Therefore, we initially characterized nitroxides 1 and 3 in vitro at 1 GHz, which is suitable for both in vivo spectroscopy and imaging in small animals. The EPR spectra of nitroxides 1 and 3 (as K+ salts, 100 µM in air-equilibrated phosphate-buffered saline, PBS) are shown in Fig. 2. The peak-to-peak linewidth of nitroxide 1 was 0.54 G, compared to 1.18 G for nitroxide 3. Moreover, the spectral peak amplitude of nitroxide 1 was ~2.5-fold greater than that of nitroxide 3.
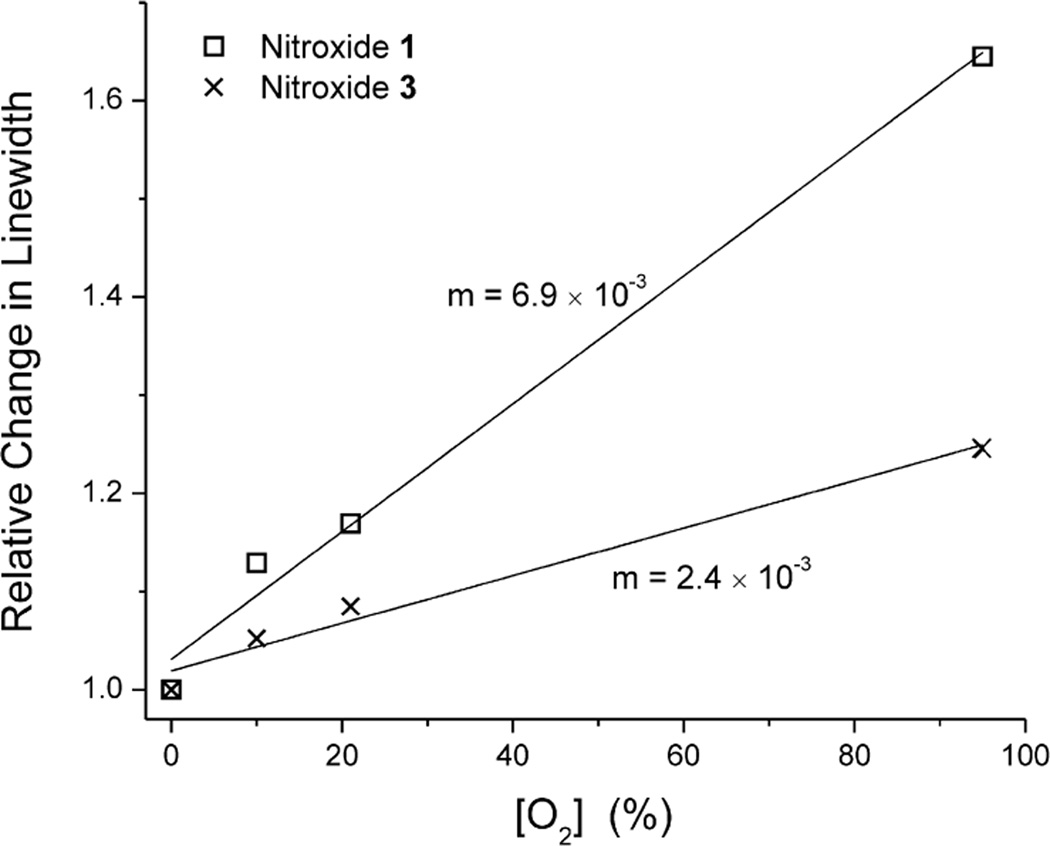
Fig. 3 shows the dependence of the EPR linewidth on O2 concentration for nitroxides 1 and 3. With varying O2 concentration, the relative change in linewidth is much greater for nitroxide 1 than for nitroxide 3. Linear least-squares fits of these data show that the line-broadening effect of O2 is 2.88-fold greater for nitroxide 1 than for nitroxide 3. Therefore, nitroxide 1 is more O2-sensitive than nitroxide 3 and should be able to resolve smaller changes in O2. As expected, at 1 GHz, the spectral characteristics of nitroxides 1 and 3, and their relative responsiveness to O2 are comparable to our previous findings and for other similar spin labels at 9.5 GHz [26,27,30].
Fig. 3.
Relative changes in linewidth of nitroxides 1 and 3 in aqueous solution equilibrated with different concentrations of O2 (0, 10, 21 or 95%) at 1 GHz. Solid lines are least-squares fits of the data; the slope of each line is indicated on the graph. Where not shown, error bars are smaller than the symbols (n = 5).
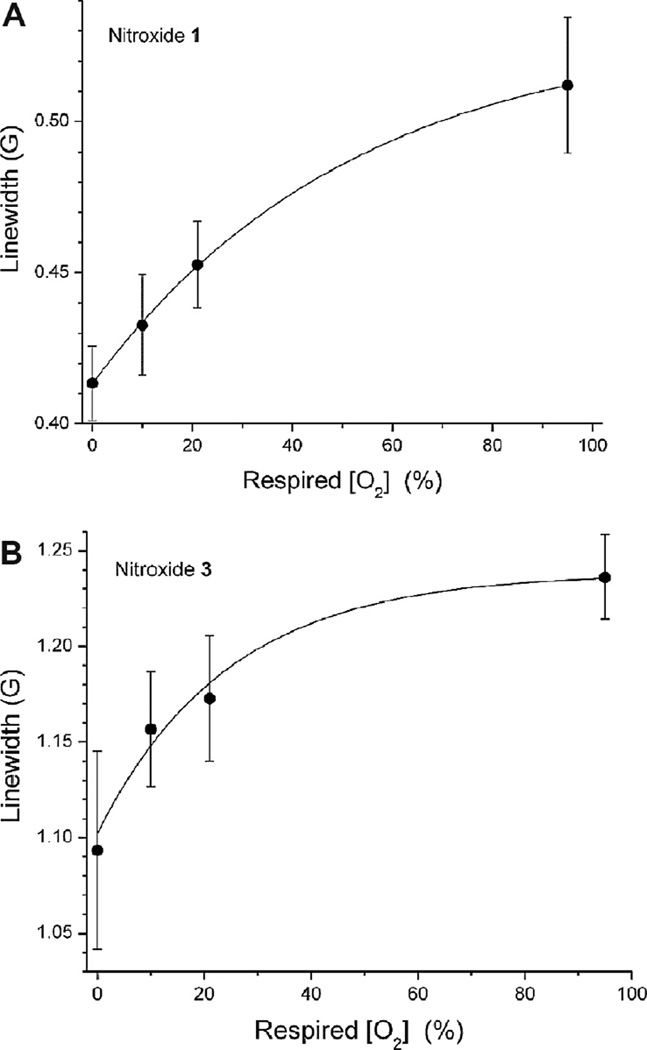
We next assessed the utility of nitroxides 1 and 3 as an O2 sensor in vivo in proof-of-concept experiments. Mice (n = 5) were intravenously injected with the AM ester pro-imaging agents (nitroxides 2 and 4). As demonstrated previously [4,12,28,29], nitroxide 4 (at analogous concentrations) can cross the BBB and be hydrolyzed to nitroxide 3, which becomes entrapped in cerebral tissue with an in vivo T1/2 of ~20–30 min dependent on injection route and 50% retention; thus, allowing sufficient amount of nitroxide to be retained in the brain tissue for quantitation of O2 without interference from concentration-dependent linewidth self-broadening [4]. We anticipate nitroxide 2 to exhibit similar characteristics. After intravenous injection with nitroxide 2 or 4, the head of the mouse was positioned in the cavity of an L-band EPR spectrometer, and the mouse respired N2 mixed with various concentrations of O2 for up to 60 min. EPR spectral data were acquired, and the dependence of the linewidth of nitroxides 1 and 3 on respired [O2] was measured in vivo. Peak-to-peak linewidth values obtained by spectral fitting are plotted in Fig. 4A and B. The dependence of nitroxide EPR spectral linewidth on respired [O2] was nonlinear and was fit with a single exponential (Fig. 5). It can then be estimated that the O2 concentration required for half-saturation of the sensor response was [O2]1/2 = 15.9 ± 5.2 %O2 for nitroxide 3 and [O2]1/2 = 36.3 ± 2.6 %O2 for nitroxide 1. This suggests that nitroxide 1 is >2-fold more sensitive than nitroxide 3 as an O2 sensor.
Fig. 4.
Changes in peak-to-peak EPR linewidths of nitroxides 1 and 3 in the mouse brain. (A) Nitroxide 2 was injected into mice (i.v., 0.4 mmol/kg body weight; n = 5). (B) Nitroxide 4 was injected into mice (i.v., 0.4 mmol/kg body weight; n = 5). EPR spectra were acquired as mice inhaled different concentrations of O2 (0, 10, 21 and 95% balance is N2).
Fig. 5.
Relative changes in EPR linewidth of nitroxides 1 and 3 in the mouse brain. Nitroxide 2 or 4 was injected into mice (i.v., 0.4 mmol/kg body weight; n = 5 for each nitroxide). EPR spectra were acquired as mice inhaled different concentrations of O2 (0, 10, 21 and 95% balance is N2). Solid lines are least-squares fit of the function, y = (ax + b)/(x + b), to the data. The O2 concentration required for 50% saturation of the response, [O2]1/2, is indicated for each curve.
While the relationship between nitroxide EPR spectral linewidth and O2 concentration in aqueous solution is linear, the observed nonlinear relation between nitroxide linewidth and respired O2 concentration in vivo is not unexpected, and can be rationalized on the basis of O2 homeostasis. We expect that line broadening at higher respired O2 concentrations would be less than that observed at the same O2 concentration in vitro, because of limited local bioavailability of O2 in cerebral tissue. Even as the respired O2 concentration approaches 100%, cerebral tissue O2 would not track respired O2 because of the high rate of brain O2 consumption, and because of reduced delivery of O2 caused by hyperoxia-induced vasoconstriction [31]. Analogously, we expect in vivo linewidths at hypoxic concentrations to be less than those observed at the same nominal concentration in vitro. During isocapnic hypoxia (decrease in pO2 without change in pCO2), vasodilation occurs leading to increased cerebral blood flow in an attempt to minimize the effects of hypoxia on brain tissue oxygenation [31,32].
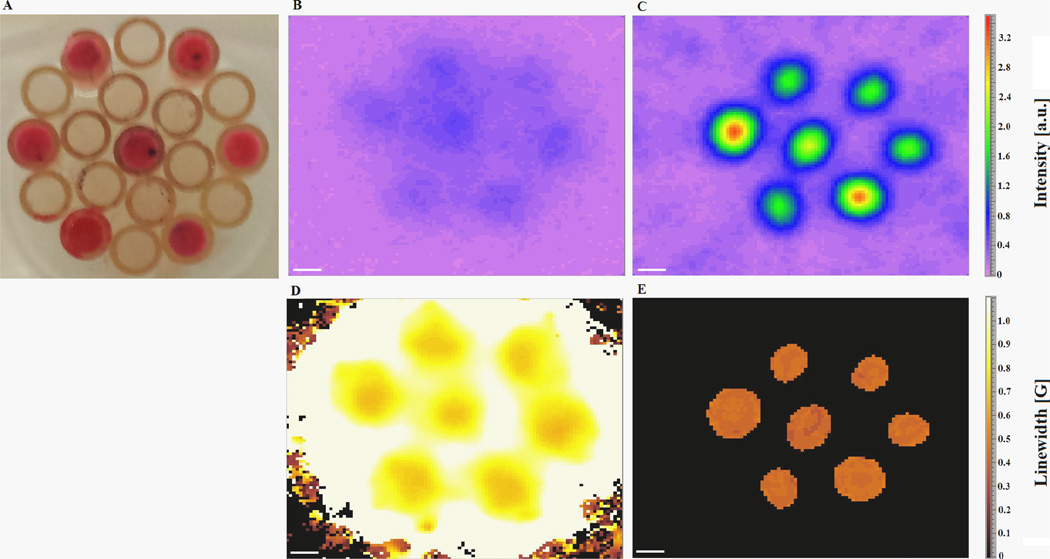
We have demonstrated that O2-dependent line broadening of nitroxide 1 is greater than that of nitroxide 3 in vivo. This suggests that nitroxide 1 is a superior probe for quantitative EPR oximetry. The EPR spectral linewidths at 1 GHz are also substantially reduced in isotopically-substituted nitroxides (0.54 G for nitroxide 1 vs 1.18 G for nitroxide 3 in air-equilibrated aqueous solutions, Fig. 2). This should enable acquisition of EPR images of greater spatial resolution than possible with non-isotopically substituted nitroxides. Magnetic resonance images are acquired in the presence of a magnetic field gradient, and the intrinsic linewidth of the probe is a limiting factor in achieving high spatial resolution. This is especially true of EPR imaging with nitroxides, whose intrinsic linewidths are relatively large (1.1 G or up to several parts per thousand of B0 = 356 G). We therefore performed proof-of-concept in vitro phantom spectral spatial EPR images of nitroxides 4 and 2 as shown in Fig. 6. The dramatic increase in EPR spectral-spatial intensity image of nitroxide 2 compared to 4 (Fig. 6B and C), and corresponding representative linewidth image (Fig. 6D and E) demonstrate the significant improvement in spectral resolution and reconstruction made possible by the higher SNR and ~2-fold narrower linewidth of nitroxide 2.
Fig. 6.
In vitro 2D spectral-spatial L-band EPR imaging of nitroxides 2 and 4. (A) A photograph of the phantom comprising capillary tubes, some of which contain air-equilibrated nitroxide solution. (B) 2D spectral-spatial intensity image of capillary phantom containing nitroxide 4. (C) 2D spectral-spatial intensity image of capillary phantom containing nitroxide 2. Note that (B) and (C) have the same intensity scale. (D) 2D spectral-spatial linewidth image of phantom containing nitroxide 4. (E) 2D spectral-spatial linewidth image of phantom containing nitroxide 2. Note that (D) and (E) have the same linewidth scale. Scale bar = 1 mm.
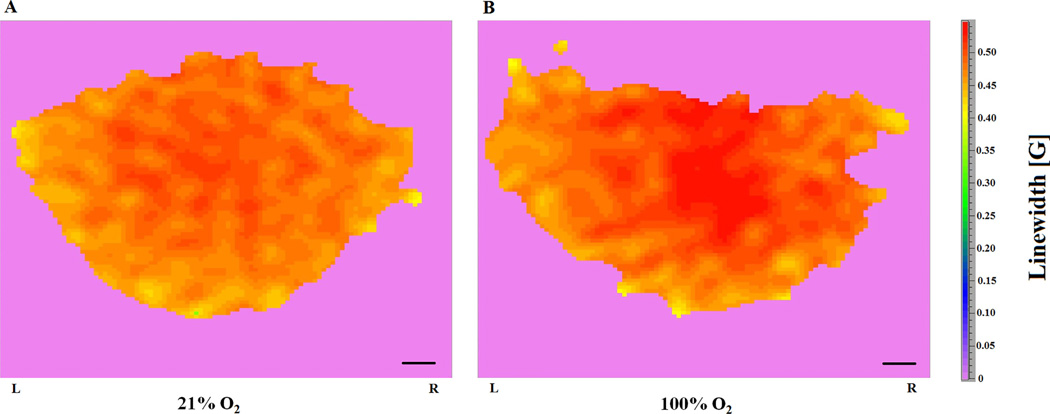
It is clear that nitroxide 2 offers significant improvement in linewidth EPR imaging as fitting from projection data showed significantly reduced image artifacts and improved background, i.e. a zero background is observed and only nitroxide-containing tubes are observed in the reconstructed linewidth EPR image (Fig. 6E). Under present experimental conditions, the ~2-fold narrower linewidth of nitroxide 1 compared to nitroxide 3 should result in significant improvement in in vivo spatial resolution of EPR images. Thus, nitroxide 2 was injected into mice to observe in vivo images of nitroxide 1 (after esterase hydrolysis of nitroxide 2) [4,12,29] in the brain of a mouse breathing different O2 concentrations (21%, and 100%) (Fig. 7). As expected, when nitroxide 4 was used for the same experiment, the time required for acquiring EPR spectral-spatial images of adequate quality increased significantly (data not shown), which is less ideal for in vivo imaging. These results establish that in vivo EPR imaging with 15N-perdeuterionitroxide provides images with sufficiently short acquisition time (~27 min) and sufficiently high spatial resolution to permit accurate mapping and quantitation of pO2 in the brain. Of importance was the observation that when the percentage of O2 in the inspired gas was increased from 21% to 100%, a corresponding increase can be observed in the in vivo EPR images indicating that pO2 levels significantly increased in the brain.
Fig. 7.
In vivo 2D spectral-spatial L-band EPR images of pO2 distribution in the mouse brain. (A) The 2D spectral-spatial linewidth image of nitroxide 1 in the brain of a mouse breathing a gas mixture containing 21% O2. (B) The 2D spectral-spatial linewidth image of nitroxide 1 in the brain of a mouse breathing 100% O2. The prone-mouse was placed head first into the custom-made head holder for the EPR small-animal head resonator and L and R labels on the image refers to left and right hemispheres, respectively. Scale bar = 1 mm.
4. Conclusions
Nitroxide 1 has spectral characteristics that make it better suited for in vivo EPR applications. Currently, EPR spectrometers measure signal intensity as the peak-to-peak amplitude of a single spectral line. Because full isotopic substitution (15N and deuterium) of the present nitroxides has the net effect of increasing peak amplitude by ~2.5-fold, a corresponding improvement in SNR is expected relative to non-isotopically-substituted nitroxides. At 1 GHz, the in vitro peak amplitude of nitroxide 1 was 2.5-fold larger than that of nitroxide 3 (Fig. 2). Correspondingly, the in vivo peak amplitude of nitroxide 1 was ~2-fold higher than that of nitroxide 3. This ~2-fold increase of in vivo peak amplitude significantly improves the sensitivity and resolution of O2 mapping in the brain. This proof-of-principle demonstration that isotopically-substituted nitroxides, such as nitroxide 1, are superior for in vivo O2 quantification in the brain motivates their use for superior and higher-resolution O2 mapping in pathological states such as ischemia [12,33], cognitive vascular impairment [34] and methamphetamine abuse [35–37], where O2 levels are compromised. While these studies present evidence of tissue pO2 as a potential important initiation event that culminates in oxidative stress, leading to subsequent injuries [33–37], inserted O2 electrodes or single-site EPR oximetry, used in these studies, does not account for other regions of the brain that may likewise experience similar or more severe changes in O2. Novel EPR imaging with excellent in vivo O2 sensors may be useful to map and quantify O2 levels throughout the brain; thus, yielding important information regarding the pathophysiology of many diseases, which would not otherwise be elucidated in such a rigorous fashion. These efforts are under way in our laboratory.
Acknowledgments
This research was supported in part by National Institutes of Health grants P30-RR-031156 (JW and KJL), R21DA023473 (JW, KJL and GMR), P41-EB-2034 (GMR) and GM-56481 (JPYK). We thank Dr. Gary Fiskum for a discussion of the in vivo effect of O2.
References
- 1.Baudelet B, Gallez B. How does blood oxygen level-dependent (BOLD) contrast correlate with oxygen partial pressure (pO2) insider tumors. Magn. Reson. Med. 2002;48:980–986. doi: 10.1002/mrm.10318. http://dx.doi.org/10.1002/mm.1038. [DOI] [PubMed] [Google Scholar]
- 2.Elas M, Williams BB, Parasca A, Mailer C, Pelizzari CA, Lewis MA, River JN, Karczmar GS, Barth ED, Halpern HJ. Quantitative tumor oxymetric images from 4D electron paramagnetic resonance imaging (EPRI): methodology and comparison with blood oxygen level-dependent (BOLD) MRI. Magn. Reson. Med. 2003;49:682–691. doi: 10.1002/mrm.10408. http://dx.doi.org/10.1002/mm.10408. [DOI] [PubMed] [Google Scholar]
- 3.Matsumoto K, Bernardo M, Subramanian S, Choyke P, Mitchell JB, Krishna MC, Lizak MJ. MR assessment of changes of tumor in response to hyperbaric oxygen treatment. Magn. Reson. Med. 2006;56:240–246. doi: 10.1002/mrm.20961. http://dx.doi.org/10.1002/mm.20961. [DOI] [PubMed] [Google Scholar]
- 4.Shen J, Liu S, Miyake M, Liu W, Pritchard A, Kao JPY, Rosen GM, Tong Y, Liu KJ. Use of 3-acetoxymethoxycarbonyl-2,2,5,5-tetramethyl-1-pyrrolidinyloxyl as an EPR oximetry probe: potential for in vivo measurement of tissue oxygenation in mouse brain. Magn. Reson. Med. 2006;55:1433–1440. doi: 10.1002/mrm.20894. http://dx.doi.org/10.1002/mm.20894. [DOI] [PubMed] [Google Scholar]
- 5.Kutala VK, Parinandi NL, Pandian RP, Kuppusamy P. Simultaneous measurement of oxygenation in intracellular and extracellular compartments of lung microvascular endothelial cells. Antioxid. Redox Signal. 2004;6:597–603. doi: 10.1089/152308604773934350. http://dx.doi.org/10.1089/152308604773934350. [DOI] [PubMed] [Google Scholar]
- 6.Shen J, Khan N, Lewis LD, Armand R, Grinberg O, Demidenko E, Swartz H. Oxygen consumption rates and oxygen concentration in molt-4 cells and their mtDNA depleted (rho0) mutants. Biophys. J. 2003;84:1291–1298. doi: 10.1016/S0006-3495(03)74944-3. http://dx.doi.org/10.1016/S0006-3495(03)74944-3. [DOI] [PMC free article] [PubMed] [Google Scholar]
- 7.Khan N, Shen J, Chang TY, Chang CC, Fung PC, Grinberg O, Demidenko E, Swartz H. Plasma membrane cholesterol: a possible barrier to intracellular oxygen in normal and mutant CHO cells defective in cholesterol metabolism. Biochemistry. 2003;42:23–29. doi: 10.1021/bi026039t. http://dx.doi.org/10.1021/bi026039t. [DOI] [PubMed] [Google Scholar]
- 8.Liu S, Timmins GS, Shi H, Gasparovic CM, Liu KJ. Application of in vivo EPR in brain research: monitoring tissue oxygenation, blood flow, and oxidative stress. NMR Biomed. 2004;17:327–334. doi: 10.1002/nbm.899. http://dx.doi.org/10.1002/nbm.899. [DOI] [PubMed] [Google Scholar]
- 9.Gallez B, Bacic G, Goda F, Jiang J, O’Hara JA, Dunn JF, Swartz HM. Use of nitroxides for assessing perfusion, oxygenation, and viability of tissues: in vivo EPR and MRI Studies. Magn. Res. Med. 1996;35:97–106. doi: 10.1002/mrm.1910350113. [DOI] [PubMed] [Google Scholar]
- 10.Halpern HJ, Spencer DP, van Polen J, Bowman MK, Massoth RJ, Nelson AC, Dowey EM, Teicher BA. An imaging radiofrequency electron spin resonance spectrometer with high resolution and sensitivity for in vivo measurements. Rev. Sci. Instrum. 1989;60:1040–1050. http://dx.doi.org/10.1063/1.1140314. [Google Scholar]
- 11.Pou S, Davis PL, Wolf GL, Rosen GM. Use of nitroxides as NMR contrast enhancing agents for joints. Free Rad. Res. 1995;23:353–364. doi: 10.3109/10715769509065256. http://dx.doi.org/10.3109/10715769509065256. [DOI] [PubMed] [Google Scholar]
- 12.Shen J, Sood R, Weaver J, Timmins GS, Schnell A, Miyake AM, Kao JPY, Rosen GM, Liu KJ. Direct visualization of mouse brain oxygen distribution by electron paramagnetic resonance imaging: application to focal cerebral ischemia. J. Cereb. Blood Flow Metab. 2009;29:1695–1703. doi: 10.1038/jcbfm.2009.89. http://dx.doi.org/10.1038/jcbfm.2009.89. [DOI] [PMC free article] [PubMed] [Google Scholar]
- 13.For a review on this topic, see: Swartz HM, Sentjurc M, Kocherginsky N. Nitroxide Spin Labels: Reactions in Biology and Chemistry. Boca Raton: CRC Press; 1995. pp. 175–198.
- 14.Redler G, Barth EG, Bauer KS, Jr, Kao JPY, Rosen GM, Halpern HJ. In vivo EPR imaging of differential tumor targeting using cis-3,4-di(acetoxymethoxycarbonyl)-2,2,5,5-tetramethyl-1-pyrrolidinyloxyl. Magn. Res. Med. 2014;71:1650–1656. doi: 10.1002/mrm.24813. http://dx.doi.org/10.1002/mrm.24813. [DOI] [PMC free article] [PubMed] [Google Scholar]
- 15.Bacic G, Walczak T, Demsar F, Swartz HM. Electron spin resonance imaging of tissues with lipid areas. Magn. Res. Med. 1988;8:209–219. doi: 10.1002/mrm.1910080211. [DOI] [PubMed] [Google Scholar]
- 16.Kuppusamy P, Shankar R, Zweier JL, et al. In vivo measurement of arterial and venous oxygenation in the rat using 3D spectral-spatial electron paramagnetic resonance imaging. Phys. Med. Biol. 1998;43:1837–1844. doi: 10.1088/0031-9155/43/7/003. [DOI] [PubMed] [Google Scholar]
- 17.Hyodo F, Matsumoto S, Devasahayam N, Dharmaraj C, Subramanian S, Mitchell JB, Krishna MC. Pulsed EPR imaging of nitroxides in mice. J. Magn. Reson. 2009;197:181–185. doi: 10.1016/j.jmr.2008.12.018. http://dx.doi.org/10.1016/j.jmr.2008.12.018. [DOI] [PMC free article] [PubMed] [Google Scholar]
- 18.Halpern HJ, Peril M, Nguyen T-D, Spencer DP, Teicher BA, Lin YJ, Bowman MK, et al. Selective isotopic labeling of a nitroxide spin label to enhance sensitivity for T2 oxymetry. J. Magn. Res. 1969;1990(90):40–51. http://dx.doi.org/10.1016/0022-2364(90)90364-F. [Google Scholar]
- 19.Halpern HJ, Peric M, Yu C, Bales BL. Rapid quantitation of parameters from inhomogeneously broadened EPR spectra. J. Magn. Res. Ser A. 1990;103:13–22. http://dx.doi.org/10.1006/jmra.1993.1125. [Google Scholar]
- 20.Halpern HJ, Yu C, Peric M, Barth E, Grdina DJ, Teicher BA, et al. Oxymetry deep in tissues with low-frequency electron paramagnetic resonance. Proc. Natl. Acad. Sci. USA. 1994;91:13047–13051. doi: 10.1073/pnas.91.26.13047. [DOI] [PMC free article] [PubMed] [Google Scholar]
- 21.Kao JPK, Rosen GM. Esterase-assisted accumulation of 3-carboxy-2,2,5,5-tetramethyl-1-pyrrolidinyloxyl into lymphocytes. Org. Biomol. Chem. 2004;2:99–102. doi: 10.1039/b310467b. http://dx.doi.org/10.1039/B310467B. [DOI] [PubMed] [Google Scholar]
- 22.Rosen GM, Burks SR, Kohr MJ, Kao JPY. Synthesis and biological testing of aminoxyls designed for long-term retention by living cells. Org. Biomol. Chem. 2005;3:645–648. doi: 10.1039/b415586f. http://dx.doi.org/10.1039/B415586F. [DOI] [PubMed] [Google Scholar]
- 23.Burks SR, Ni J, Muralidharan S, Coop A, Kao JPY, Rosen GM. Optimization of labile esters for esterase-assisted accumulation of nitroxides into cells: a model for in vivo EPR imaging. Bioconjug. Chem. 2008;19:2068–2071. doi: 10.1021/bc8001562. http://dx.doi.org/10.1021/bc800222e. [DOI] [PMC free article] [PubMed] [Google Scholar]
- 24.Burks SR, Makowsky MA, Yaffe ZA, Hoggle C, Tsai P, Muralidharan S, Bowman MK, Kao JPY, Rosen GM. The effect of structure on nitroxide EPR spectral linewidth. J. Org. Chem. 2010;75:4737–4741. doi: 10.1021/jo1005747. http://dx.doi.org/10.1021/jo1005747. [DOI] [PMC free article] [PubMed] [Google Scholar]
- 25.Liu Y, Villamena FA, Song Y, Sun J, Rockenbauer A, Zwier JL. Synthesis of 14N and 15N-labeled trityl nitroxide biradicals with strong spin-spin interaction and improved sensitivity to redox status and oxygen. J. Org. Chem. 2010;75:7796–7802. doi: 10.1021/jo1016844. http://dx.doi.org/10.1021/jo1016844. [DOI] [PMC free article] [PubMed] [Google Scholar]
- 26.Khan N, Blinco JP, Bottle SE, Hosokawa K, Swartz HM, Micallef AS. The evaluation of new and isotopically labeled isoindoline nitroxides and an azaphalene nitroxide for EPR oximetry. J. Magn. Reson. 2011;211:170–177. doi: 10.1016/j.jmr.2011.05.007. http://dx.doi.org/10.1016/j.jmr.2011.05.007. [DOI] [PMC free article] [PubMed] [Google Scholar]
- 27.Burks SR, Bakhashai J, Makowsky MA, Muralidharan S, Tsai P, Rosen GM, Kao JPY. 2H, 15N-Substituted nitroxides as sensitive probes for electron paramagnetic resonance imaging. J. Org. Chem. 2010;75:6463–6467. doi: 10.1021/jo1011619. http://dx.doi.org/10.1021/jo1011619. [DOI] [PMC free article] [PubMed] [Google Scholar]
- 28.Miyake M, Shen J, Liu S, Shi H, Liu W, Yuan Z, Pritchard A, Kao JPY, Liu KJ, Rosen GM. Acetoxymethoxycarbonyl nitroxides as EPR pro-imaging agents to measure O2 levels in mouse brain: a pharmacokinetic and pharmacodynamic study. J. Pharmacol. Exp. Therap. 2006;318:1187–1193. doi: 10.1124/jpet.106.106245. http://dx.doi.org/10.1124/jpet.106.106245. [DOI] [PubMed] [Google Scholar]
- 29.Miyake M, Burks SR, Weaver J, Tsai P, Liu W, Bigio D, Bauer KS, Liu KJ, Rosen GM, Kao JPY. Comparison of two nitroxides labile esters for delivering electron paramagnetic resonance probes into mouse brain. J. Pharm. Sci. 2010;99:3594–3600. doi: 10.1002/jps.22102. http://dx.doi.org/10.1002/jps.22102. [DOI] [PMC free article] [PubMed] [Google Scholar]
- 30.Beth AH, Venkataramu SD, Balasubramanian K, Dalton LR, Robinson BH, Pearson DE, Park CR, Park JH. 15N- and 2H-substituted maleimide spin labels: improved sensitivity and resolution for biological EPR studies. Proc. Natl. Acad. Sci. USA. 1981;78:967–971. doi: 10.1073/pnas.78.2.967. [DOI] [PMC free article] [PubMed] [Google Scholar]
- 31.Hlatky R, Valadka AB, Gopinath SP, Robertson CS. Brain tissue oxygen tension response to induced hyperoxia reduced in hypoperfused brain. J. Neurosurg. 2008;108:53–58. doi: 10.3171/JNS/2008/108/01/0053. http://dx.doi.org/10.3171/JNS/2008/108/01/0053. [DOI] [PubMed] [Google Scholar]
- 32.Severinghaus JW. Cerebral circulation at altitude. In: Schoene THR, editor. High Altitude: An Exploration of the Human Adaptation. Vol. 161. New York: Marcel Dekker; 2001. pp. 343–375. [Google Scholar]
- 33.Liu S, Shi H, Liu W, Furuichi T, Timmins GS, Liu KJ. Interstitial pO2 in ischemic penumbra and core are differentially affected following transient focal cerebral ischemia in rats. J. Cereb. Blood Flow Metab. 2004;24:343–349. doi: 10.1097/01.WCB.0000110047.43905.01. http://dx.doi.org/10.1097/01.WCB.0000110047.43905.01. [DOI] [PubMed] [Google Scholar]
- 34.Weaver J, Jalal FY, Yang Y, Thompson J, Rosenberg GA, Liu KJ. Tissue oxygen is reduced in white matter of spontaneously hypertensive-stroke prone rats: a longitudinal study with electron paramagnetic resonance. J. Cereb. Blood Flow Metab. 2014;34:890–896. doi: 10.1038/jcbfm.2014.35. http://dx.doi.org/10.1038/jcbfm.2014.35. [DOI] [PMC free article] [PubMed] [Google Scholar]
- 35.Kousik SM, Graves SM, Napier TC, Zhao C, Carvey PM. Methamphetamine-induced vascular changes lead to striatal hypoxia and dopamine reduction. NeuroReport. 2011;22:923–928. doi: 10.1097/WNR.0b013e32834d0bc8. http://dx.doi.org/10.1097/WNR.0b013e32834d0bc8. [DOI] [PMC free article] [PubMed] [Google Scholar]
- 36.Shiba T, Yamato M, Kudo W, Watanabe T, Utsumi H, Yamada K. In vivo imaging of mitochondrial function in methamphetamine-treated rats. Neuroimage. 2011;57:866–872. doi: 10.1016/j.neuroimage.2011.05.041. http://dx.doi.org/10.1016/j.neuroimage.2011.05.041. [DOI] [PubMed] [Google Scholar]
- 37.Weaver J, Yang Y, Purvis R, Weatherwax T, Rosen GM, Liu KJ. In vivo evidence of methamphetamine induced attenuation of brain tissue oxygenation as measured by EPR oximetry. Toxicol. Appl. Pharmacol. 2014;275:73–78. doi: 10.1016/j.taap.2013.12.023. http://dx.doi.org/10.1016/j.taap.2013.12.023. [DOI] [PMC free article] [PubMed] [Google Scholar]


