

Abstract
Importance
A substantial proportion of clinically normal (CN) older participants are classified as suspected non-Alzheimer’s disease (AD) pathophysiology (SNAP), as defined as being biomarker negative for beta-amyloid (Aβ) but positive for neurodegeneration (ND). The etiology of SNAP in CN remains unclear.
Objective
To determine whether SNAP CN show evidence of early AD processes (elevated Tau and/or increased risk of cognitive decline).
Design
Longitudinal observational study.
Setting
Academic medical center.
Participants
Two hundred forty seven CN (age range=63–90; 142 women).
Main outcomes and measures
CN were classified into preclinical AD stages using measures of Aβ (PIB-PET) and ND (hippocampus volume or cortical glucose metabolism from AD-vulnerable regions): Stage 0 (Aβ−/ND−), Stage 1 (Aβ+/ND−), Stage 2 (Aβ+/ND+), and SNAP (Aβ−/ND+). Continuous levels of PIB and ND, medial and inferior temporal lobe Tau, and longitudinal cognition were examined both across preclinical stages and within the SNAP group.
Results
Twenty-six percent of CN from the Harvard Aging Brain Study (HABS) were classified as SNAP. Compared to Stage 0, SNAP were not more likely to have subthreshold PIB values (higher values within the Aβ-range), suggesting that misclassification due to the PIB cut off was not a prominent contributor to this group. Tau in both the medial and inferior temporal lobes was indistinguishable between SNAP and Stage 0, and was lower in SNAP compared to Stage 2. Stage 2 demonstrated greater cognitive decline compared to all other groups, whereas SNAP showed a diminished practice effect over time compared to Stage 0.
Conclusions and relevance
SNAP CN do not exhibit evidence of elevated Tau, suggesting that this biomarker construct does not simply represent amyloid independent tauopathy. At the group level, SNAP does not show cognitive decline but does show a diminished practice effect. SNAP is likely heterogeneous with a subset of this group at elevated risk of short-term decline. Future biomarker refinement will be necessary to subclassify this group and determine the biological correlates of ND markers among Aβ− CN.
Introduction
In 2011 the National Institutes on Aging and the Alzheimer’s Association workgroup published criteria for classifying clinically normal (CN) older individuals thought to be on the AD trajectory into stages of preclinical Alzheimer’s disease (AD) 1. This staging framework postulated a sequence that begins with beta-amyloid (Aβ) accumulation, followed by neurodegeneration (ND), and eventually cognitive decline 2,3. Preclinical Stage 1 are Aβ+ but ND−, Stage 2 are Aβ+ and ND+, and Stage 3 are Aβ+/ND+ and additionally show subtle cognitive impairment. Soon after the publication of these criteria, Jack et al described an additional category of Aβ − CN that were ND+ (“Suspected Non-Alzheimer’s disease Pathophysiology,” SNAP) 4. Interestingly, the proportion of SNAP CN has been remarkably consistent at ~25% across multiple independent cohorts 5.
The relevance of SNAP CN to the conceptualization of preclinical AD is currently unclear 5,6. Among Aβ − CN, baseline neurodegenerative markers are not associated with subsequent accumulation of Aβ 7, suggesting that SNAP CN are not at elevated risk of entering the Alzheimer’s disease cascade compared to Stage 0. It has also been shown that markers of non-AD pathologies such as cerebrovascular disease and α-synucleinopathy are not more prevalent in SNAP 8 (however see 9). A remaining possibility is that SNAP CN, or at least a portion of the SNAP CN group, reflects amyloid independent tauopathy 10–12. Tau aggregation in the medial temporal lobe (MTL) is ubiquitous in aging (~94% of individuals in their 70’s are Braak stage I and higher 13). Although Tau aggregation beyond the MTL is coupled with Aβ accumulation 13,14, a subset of low Aβ individuals show this more extensive pattern of Tau deposition. The presence of Tau aggregation in the MTL and beyond the MTL among Aβ − participants has recently been labeled “primary age-related tauopathy” (PART) and is currently under discussion 10,12,15. An intriguing possibility is that SNAP CN are the in vivo analog of this postmortem group. We can test this possibility using PET imaging that enable assessment of the spatial distribution of Tau aggregates 16,17.
Another clarification regarding the relevance of SNAP is whether this group shows cognitive decline over time. If PART is a contributing etiology of SNAP, then SNAP should show cognitive decline given that PART cases demonstrate worse cognitive scores than their low Aβ/low Tau counterparts 10. Whereas most studies to date have found elevated decline in Stage 2, results in SNAP CN vary 18–20. We previously reported intermediate levels of longitudinal change over two years in SNAP CN on a global cognitive composite measure 19. We sought to expand on this finding by examining a larger sample followed over a longer duration, and additionally explore correlates of decline within the SNAP group.
Overall, the primary goal of the current study was to explore whether SNAP CN shows evidence of amyloid independent Tau and/or cognitive decline.
Methods
Participants
Harvard Aging Brain Study (HABS) participants undergo baseline MRI/PET scanning and annual neuropsychological testing. Study protocols were approved by the Partners Healthcare Institutional Review Board, and all participants provided informed consent.
At baseline participants had a global CDR=0, performed within education-adjusted norms on the Logical Memory delayed recall, and MMSE≥ 27. Two hundred forty-seven participants included in the current analyses completed PIB-PET, FDG-PET, and structural MRI scanning within one year of baseline (Table 1). Eighty of these participants additionally underwent T807-PET within one year of the other imaging procedures.
Table 1.
Group characteristics. aHV=adjusted hippocampus volume.
| SNAP | Stage 0 | Stage 1 | Stage 2 | |
|---|---|---|---|---|
| N | 64 (25.9%) | 117 (47.4%) | 31 (12.6%) | 35 (14.2%) |
| Age (years) | 76.5 (71.1, 81.3) | 70.0 (66.9, 75.3)* | 72.3 (69.3, 77.2)* | 76.9 (73.0, 82.2) |
| % Female | 46.9% | 62.4%^ | 58.1% | 60% |
| Education (years) | 16 (12, 18) | 16 (13, 18)* | 16 (14, 18)* | 16 (16, 18)* |
| % APOE4+ | 17.8% | 15.0% | 64.3%* | 53.1%* |
| PIB (DVR) | 1.073 (1.044, 1.107) | 1.091 (1.055, 1.128) | 1.398 (1.290, 1.491)* | 1.415 (1.314, 1.546)* |
| aHV (mm3) | 6828 (6377, 7575) | 7859 (7343, 8413)* | 7717 (7197, 8060)* | 6636 (6030, 7202) |
| MetaROI FDG (SUVR) | 1.221 (1.162, 1.266) | 1.354 (1.296, 1.436)* | 1.377 (1.313, 1.399)* | 1.208 (1.156, 1.244) |
| Follow-up (years) | 3.6 (2.2, 4.2) | 3.9 (2.1, 4.4) | 4.0 (2.7, 4.2) | 4.1 (3.0, 5.0)^ |
| MMSE | 29 (28, 30) | 29 (29, 30) | 29 (28, 30) | 29 (28, 29) |
Statistically different (p<0.05) and
marginally non-significant effects (p<0.15) than SNAP.
Medians and interquartile ranges are listed for continuous variables.
MRI
MRI was completed at the MGH Martinos Center on a Siemens TIM Trio 3T System with a 12-channel head coil. Structural T1-weighted volumetric magnetization-prepared, rapid acquisition gradient echo scans (TR/TE/TI=6400/2.8/900ms, flip angle=8°, 1x1x1.2mm resolution) were used to extract hippocampus volume (HV) with FreeSurfer v5.1 21. Total bilateral HV was adjusted for estimated total intracranial volume 19.
PET
PET scanning using PIB, T807, and FDG radioligands was completed at the MGH PET facility using a Siemens ECAT EXACT HR+ PET scanner (3D mode; 63 image planes; 15.2cm axial field of view; 5.6mm transaxial resolution and 2.4mm slice interval). C11-PIB and F18-T807 were synthesized using previously published protocols22.
Ten-minute transmission scans for attenuation correction were collected before emission data. For PIB, 8.5–15 mCi were injected and 60-minutes of dynamic data were acquired in 69 frames (12x15 seconds, 57x60 seconds). T807 was acquired from 80–100 minutes after a 9.0–11.0 mCi injection in 4x5 minute frames. For FDG, 5.0–10.0 mCi was injected and images were acquired across 6x5 minute frames 45-min post-injection.
PET preprocessing was performed using SPM8. PIB images were realigned, and the first 8 minutes were averaged and used for normalization to the MNI FDG template. Distribution volume ratio images were created with Logan plotting (40–60 minutes, gray matter cerebellar reference). PIB signal from a global cortical aggregate was extracted for each participant 19. T807-PET data were realigned, summed, and coregistered to each participant’s MRI. T807 was extracted from FreeSurfer-defined bilateral entorhinal, parahippocampal, and inferior temporal gyrus and expressed as the standardized uptake value ratio (SUVR) relative to a gray matter cerebellar reference 17. FDG-PET data were realigned, summed, and normalized to the MNI FDG template. FDG was extracted from a MetaROI reflecting AD vulnerable cortical regions, and normalized using a pons/vermis reference region23.
Classification into preclinical AD stages
A Gaussian mixture modeling approach was used to classify HABS CN as Aβ+ or Aβ − (cut-off value=1·20) 24. Although ND markers vary across studies 5, the most commonly used ND markers are aHV, MetaROI FDG, and CSF Tau. We previously have used aHV and FDG to classify participants into preclinical stages 19,25,26 since this data is available for the majority of HABS participants (CSF Tau is only collected on a subset) and is consistent with classification procedures used by Jack and colleagues 4,19. Specifically, participants were classified as ND+ if positive for either aHV or MetaFDG (using a cut-off of 6723mm3 for aHV and 1·249 for MetaROI FDG) 19. Further details regarding classification into ND groups is presented in Supplemental Materials (eMethods 1, eTable 1). Based on joint Aβ and ND status, CN were classified as Stage 0 (Aβ −/ND−), Stage 1 (Aβ+/ND−), Stage 2 (Aβ+/ND+), and SNAP (Aβ −/ND+)4.
Neuropsychological testing
We assessed cognition using the Preclinical Alzheimer’s Disease Cognitive Composite (PACC)27, which is comprised of the (1) Free and Cued Selective Reminding Test Cued Recall, (2) Logical Memory Delayed Recall, (3) Digit Symbol Coding, and (4) MMSE. Measures were z-transformed based on the mean and standard deviation from baseline data and averaged.
Statistical models
Analyses were performed using R v3·2. Differences in demographics across preclinical stages were examined with t-tests for continuous variables and chi-squared tests for dichotomous variables. Multiple linear regression models were used to examine biomarker differences, controlling for age and sex.
Linear mixed models were used to examine change in the PACC. All models included covariates for preclinical stage, age, sex, and education, as well as each covariate’s interaction with time from baseline. A random intercept and slope was included for each participant. We were specifically interested in contrasting SNAP with Stage 0, Stage 1, and Stage 2. To further explore variation among SNAP, we examined the association between continuous values of PIB and ND markers within the SNAP group. All p-values were 2-sided and no correction for multiple comparisons was performed.
Results
Continuous levels of PIB and ND
Participant characteristics are found in Table 1. Given that biomarker cut off selection may impact group classification, it is possible that SNAP CN are more likely to have greater levels of subthreshold PIB compared to Stage 0 (values of PIB below the cut off of 1.20) and/or lower levels of ND markers compared to Stage 2 (values of ND markers just above the cut off for ND positivity). We therefore contrasted continuous levels of subthreshold PIB between SNAP and Stage 0 (groups below the Aβ cut off), as well as ND markers between SNAP and Stage 2 (groups above the ND cut off). Although not reaching statistical significance, SNAP CN showed less PIB uptake compared to Stage 0 (p=0·069), suggesting there was no evidence for higher levels of subthreshold PIB in SNAP compared to Stage 0. There were also no differences between SNAP and Stage 2 for continuous levels of aHV (p=0·27) or metaFDG (p=0·27). To determine whether SNAP shows a distinct ND pattern, vertexwise gray matter thickness was contrasted between SNAP and Stage 2 and did not reveal any regions showing reduced thickness in SNAP (eFigure 1).
Tau Imaging across preclinical stages
Examination of regional Tau as measured with T807 PET revealed less Tau in SNAP compared to both Stage 1 and Stage 2 in entorhinal cortex (SNAP vs. Stage 1: p= 0·015; SNAP vs. Stage 2: p= 0·0030) and parahippocampal gyrus (SNAP vs. Stage 1: p=0·049, SNAP vs. Stage 2: p=0·016). T807 signal in the inferior temporal gyrus was significantly lower in SNAP compared to Stage 2 (p=0·0095), but this did not reach statistical significance compared to Stage 1 (p=0·18). Importantly, T807 signal between SNAP and Stage 0 was indistinguishable across all three regions (p-values≥0·88). Stage 2 and Stage 1 showed similar levels of Tau in medial temporal regions (p-values≥0·68). Although not statistically significant from Stage 2, Stage 1 showed intermediate values of T807 in the inferior temporal gyrus (p=0·28, Figure 1). Examination of continuous T807 versus PIB confirmed that T807 signal among Aβ − participants was not related to SNAP (eFigure 2). Furthermore, higher inferior temporal lobe T807 was associated with smaller aHV within Aβ+ (p=0.035) but not within Aβ − (p=0.81; Figure 2). The association between metaROI FDG and T807 did not reach significance within either Aβ+ (p=0.11) or Aβ − (p=0.61).
Figure 1. T807 versus preclinical stages.

T807 by preclinical stage in the entorhinal cortex (A), parahippocampal gyrus (B) and inferior temporal gyrus (C). SNAP and Stage 0 show indistinguishable levels of Tau across all regions. Stage 1 and Stage 2 show elevated Tau in both medial temporal regions. Stage 2 shows significantly higher levels of Tau in the inferior temporal gyrus, while levels in Stage 1 are intermediate compared to SNAP.
Figure 2. Hippocampus volume versus inferior temporal lobe T807.

Associations are shown separately for Aβ − (A) and Aβ+ groups (B). Plotted variables are residualized for age. Whereas no association was observed between inferior temporal Tau and hippocampus volume within the Aβ − group, there was a significant association in the Aβ+ group that accounted for 15% of the variance above and beyond age.
Longitudinal change in cognitive performance on PACC
There were no baseline differences on PACC between SNAP and any group (p-values≥0.87, eTable 2). Examination of longitudinal change revealed that SNAP showed better performance over time on the PACC compared to Stage 2 (beta=0.157 ±0.044, p=0.0004). SNAP showed worse performance over time compared to Stage 0 (beta=−0.082±0.037, p=0.026), which was primarily driven by a diminished practice effect. The difference between SNAP and Stage 1 was not statistically significant (beta= −0.085±0.047, p=0.069, Figure 3).
Figure 3. Longitudinal change in the PACC by preclinical stage.
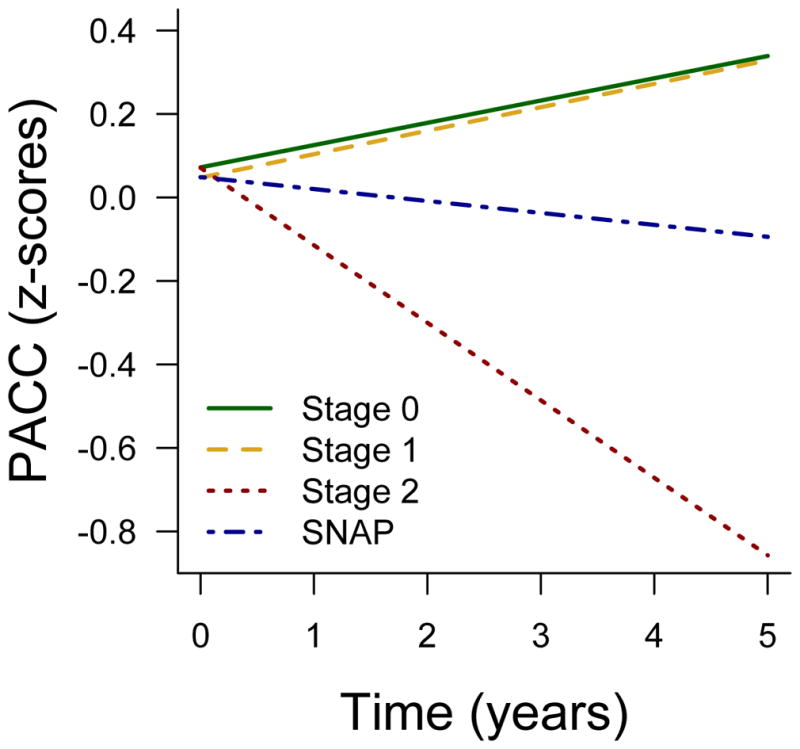
Stage 2 shows decline compared to all other groups. SNAP shows worse performance over time compared to Stage 0.
Examination of individual trajectories across preclinical stages revealed two SNAP participants showing rapid cognitive decline (eFigure 3). We therefore repeated longitudinal models excluding these two participants, and found a marginally significant difference between SNAP and Stage 0 (beta= −0.053±0.038, p=0.084) and no difference between SNAP and Stage 1 (beta= −0.045±0.038, p=0.24, eFigure 4). Thus, the diminished practice effect observed in SNAP compared to Stage 0 was not solely driven by the two rapid decliners.
To further understand cognitive change within SNAP, we examined continuous levels of ND and subthreshold PIB (continuous values of PIB below the cut off of 1.20) on longitudinal PACC within the SNAP group. This analysis revealed that higher subthreshold PIB (p=0.0010) and reduced aHV (p=0.0016) were associated with worse PACC performance over time in the SNAP group. There was no significant contribution of MetaROI FDG (p=0.60). These effects were no longer significant after excluding the two SNAP rapid decliners (effect of subthreshold PIB: p=0.48; aHV: p=0.41). A similar analysis within Stage 0 did not reveal any significant associations between cognitive change and subthreshold PIB (p=0.20), MetaROI FDG (p=0.95), or aHV (p=0.079).
Discussion
Twenty-six percent of clinically normal (CN) HABS participants were classified as SNAP (Aβ −/ND+). Using T807 PET imaging, we found that SNAP had lower levels of medial temporal lobe Tau compared to Stage 1 and Stage 2, and similar levels to Stage 0. Furthermore, SNAP had similar levels of inferior temporal lobe Tau as Stage 0, but significantly lower Tau levels compared to Stage 2. At the group level, SNAP CN showed a diminished practice effect over time compared to Stage 0, and better performance over time compared to Stage 2. Examination within SNAP revealed that subthreshold PIB values and reduced hippocampus volume were associated with decline, an effect that was driven by two SNAP rapid decliners. Overall, these results highlight that patterns of neurodegeneration in AD vulnerable regions as detected with hippocampus volume and cortical glucose metabolism are not specific to AD processes among CN. Instead, multiple etiologies likely contribute to the biomarker construct of SNAP.
The presence of small hippocampi and reduced cortical metabolism in AD-vulnerable regions among Aβ − CN highlights that factors beyond Aβ influence variability among ND markers in aging. Although ND markers have been associated with Aβ 28,29, they are also influenced by cerebrovascular disease 9, hippocampal sclerosis 30, and TDP-43 31. Likewise, associations between chronological age and gray matter 32 as well as cortical metabolism 33 are present throughout the lifespan, well before the age of Aβ accumulation 14. Given that ND markers used in our analyses are cross-sectional, these markers may also be influenced by early-life brain reserve factors (suggesting that the term “neurodegeneration” is a misnomer in at least some cases). Thus, abnormal ND levels measured with hippocampus volume and cortical glucose metabolism do not appear to be specific to AD processes 34 but are also likely influenced by a number of age-related pathologies, normal aging processes, and inter-individual differences.
Given the high prevalence of medial temporal tangle pathology in aging 14, as well as the presence of Tau aggregates extending into inferior temporal cortex in a subset of low Aβ participants 10, one hypothesis is that elevated Tau is a pathological substrate of SNAP CN 11. However, examination of T807 signal did not reveal higher levels of either medial temporal or inferior temporal lobe Tau in SNAP compared to Stage 0. In fact, T807 signal was elevated in both Stage 1 and Stage 2 compared to SNAP within medial temporal lobe regions. Although inferior temporal T807 was only statistically higher in Stage 2 compared to SNAP, Stage 1 showed intermediate levels in this region whereas the mean values between Stage 0 and SNAP were nearly identical. Thus, these data do not support the hypothesis that the biomarker construct of SNAP is analogous to the post-mortem construct of primary age-related tauopathy (PART) 10. Approximately 42% of the sample described by Crary et al (182/434) would, if they had undergone Amyloid PET, likely be classified as Aβ − because they were Thal Aβ Phase 0–2 35. Of these 182 Aβ − cases, 77 (42%) were Braak Stage III or IV, were age~90, and MMSE~23 10. In HABS there is a much larger proportion of Aβ − participants (181/247, ~73%), which is expected given the younger mean age of 74 in the HABS cohort. Among the 181 Aβ − participants in HABS, 64 (35%) had abnormal neurodegenerative biomarkers, were age=76.5, and MMSE=29. Given the restrictive enrollment requirements in a study of CN (i.e. baseline MMSE≥27), it is likely that cases with Tau aggregation extending into Braak III or IV would be excluded from the HABS, which is consistent with our finding of low tau PET signal in SNAP. It is possible there may be more concordance between SNAP and PART in older populations and/or in mild cognitive impairment, but not within a CN sample with a mean age of 74. Nevertheless, our analyses emphasize discordance between ND markers used to define SNAP and Tau PET imaging. Interestingly, higher inferior temporal lobe T807 was significantly associated with smaller hippocampus volume within Aβ+ participants but not within Aβ − participants (the association between inferior temporal T807 and hippocampus volume among Aβ+ only accounted for 15% of the variance, suggesting that these markers are not completely aligned even within the Aβ+ group). This discordance has important implications for staging criteria of preclinical AD, given that classifying participants using Tau imaging will differ from approaches that use hippocampus volume or MetaROI FDG.
The SNAP group showed a diminished practice effect over time compared to Stage 0, and better performance than Stage 2. This finding is consistent with our previous publication examining longitudinal cognition over a shorter duration and fewer participants, such that short term decline was most prominent in Aβ+/ND+ participants 19. Although the group level effect was influenced by two SNAP participants showing rapid decline (3% of the entire SNAP sample), the difference between SNAP and Stage 0 was marginally significant after excluding these two participants (the beta describing the difference between SNAP and Stage 0 was reduced from −0.08 to −0.05 after excluding the rapid decliners). Within the SNAP group, there was an association between subthreshold PIB and decline in the PACC, but this effect was driven by the two rapid decliners. The finding that subthreshold PIB values were predictive of cognitive change within SNAP is notable, given that SNAP did not show greater levels of subthreshold PIB compared to Stage 0, and subthreshold PIB values were not associated with cognitive change within Stage 0. This finding suggests that pre-existing neurodegeneration makes a small subset of SNAP participants that are additionally confronted with early Aβ accumulation at elevated risk of cognitive decline.
Our study has several limitations. We only examined cross-sectional markers of ND, and it is possible that longitudinal change in these markers will give a better estimate of neurodegenerative processes. The lack of concordance between ND status and T807 among Aβ − participants may reflect the spatial distribution of the ND markers used in our analyses, whereas more focal structural atrophy and/or hypometabolism may be a better correlate of amyloid independent tauopathy. Although we did not find evidence of elevated neocortical or medial temporal lobe Tau in SNAP compared to Stage 0, it is possible that Tau species not detectable with the T807 radioligand are present within SNAP. Finally, our analyses examining cognitive decline within SNAP are limited by the reduced variation in cognitive change among these groups, warranting future analyses with a longer follow up duration.
Approximately 25% of clinically normal participants in the Harvard Aging Brain Study are classified as SNAP. The lack of group level associations between the SNAP group and AD processes (subthreshold PIB and elevated Tau) suggests ND markers are influenced by multiple etiologies. Postmortem studies will be critical to determine pathological correlates of SNAP, and the development of novel molecular biomarkers will help subclassify this group in vivo.
Supplementary Material
Acknowledgments
E. Mormino had full access to all of the data in the study and takes responsibility for the integrity of the data and the accuracy of the data analysis.
The study was supported primarily by P01 AG036694 and R01 AG046396, with contributions from F32AG044054 and K24AG035007.
Footnotes
Authors’ contributions
E. Mormino: design and conduct of the study; analysis and interpretation of the data; preparation of the manuscript
K. Papp: collection, analysis, and interpretation of the data; preparation of the manuscript
D. Rentz: design of the study; interpretation of the data; review and approval of the manuscript
A. Schultz: management, analysis, and interpretation of the data; review and approval of the manuscript
M. LaPoint: collection, analysis, and interpretation of the data; review and approval of the manuscript
R. Amariglio: collection and interpretation of the data; review and approval of the manuscript
B. Hanseeuw: interpretation of the data; review and approval of the manuscript
G. Marshall: collection and interpretation of the data; review and approval of the manuscript
T. Hedden: collection and interpretation of the data; review and approval of the manuscript
K. Johnson: design of the study; interpretation of the data; preparation of the manuscript
R. Sperling: design of the study; interpretation of the data; preparation of the manuscript
Potential Conflicts of Interest
E. Mormino received funding from NIH grant F32AG044054 and P01 AG036694.
K. Papp received funding from NIH grant P01 AG036694 and the Charles King Trust Foundation.
D. Rentz received research support from the NIH grants P01 AG036694, R01 MH090291, U01 AG024904, R01 AG027435, R01 AG037497 and P50 AG005134, Alzheimer Association grant IIRG-08-90934 and Fidelity Biosciences. She has also served as a paid consultant for Eli Lilly, Janssen Pharmaceuticals and Neurotrack. These relationships are not related to the content in the manuscript.
A. Schultz has no conflicts to report.
M. LaPoint has no conflicts to report.
R. Amariglio received funding from the Alzheimer’s Association NIRG-12-243012 and NIH P01AG036694, RO1-AG027435.
B. Hanseeuw received support from the Belgian American Education Foundation (BAEF).
G. Marshall received research support from NIH grants K23AG033634, P50AG005134, P01AG036694, R01AG027435, and U01AG024904, he received salary support from Eisai Inc. and Eli Lilly and Company, and he served as a paid consultant for Halloran/GliaCure. These relationships are not related to the content in the manuscript.
T. Hedden received funding from NIH grants K01 AG040197, P01 AG036694, and R01 AG034556.
K. Johnson has served as paid consultant for Bayer, GE Healthcare, Janssen Alzheimer’s Immunotherapy, Siemens Medical Solutions, Genzyme, Novartis, Biogen, Roche, ISIS Pharma, AZTherapy, GEHC, Lundberg, and Abbvie. He is a site coinvestigator for Lilly/Avid, Pfizer, Janssen Immunotherapy, and Navidea. He has spoken at symposia sponsored by Janssen Alzheimer’s Immunotherapy and Pfizer. These relationships are not related to the content in the manuscript. K. Johnson receives funding from NIH grants R01EB014894, R21 AG038994, R01 AG026484, R01 AG034556, P50 AG00513421, U19 AG10483, P01 AG036694, R13 AG042201174210, R01 AG027435, and R01 AG037497 and the Alzheimer’s Association grant ZEN-10-174210.
R. Sperling has served as a paid consultant for Abbvie, Biogen, Bracket, Genentech, Lundbeck, Roche, and Sanofi. She has served as a co-investigator for Avid, Eli Lilly, and Janssen Alzheimer Immunotherapy clinical trials. She has spoken at symposia sponsored by Eli Lilly, Biogen, and Janssen. R. Sperling receives research support from Janssen Pharmaceuticals, and Eli Lilly and Co. These relationships are not related to the content in the manuscript. She also receives research support from the following grants: P01 AG036694, U01 AG032438, U01 AG024904, R01 AG037497, R01 AG034556, K24 AG035007, P50 AG005134, U19 AG010483, R01 AG027435, Fidelity Biosciences, Harvard NeuroDiscovery Center, and the Alzheimer’s Association.
References
- 1.Sperling RA, Aisen PS, Beckett LA, et al. Toward defining the preclinical stages of Alzheimer’s disease: Recommendations from the National Institute on Aging and the Alzheimer’s Association workgroup. Alzheimers Dement. 2011;7:280–292. doi: 10.1016/j.jalz.2011.03.003. [DOI] [PMC free article] [PubMed] [Google Scholar]
- 2.Hardy J, Selkoe DJ. The amyloid hypothesis of Alzheimer’s disease: progress and problems on the road to therapeutics. Science. 2002;297(5580):353–356. doi: 10.1126/science.1072994. [DOI] [PubMed] [Google Scholar]
- 3.Jack CR, Jr, Knopman DS, Jagust WJ, et al. Tracking pathophysiological processes in Alzheimer’s disease: an updated hypothetical model of dynamic biomarkers. Lancet Neurol. 2013;12(2):207–216. doi: 10.1016/S1474-4422(12)70291-0. [DOI] [PMC free article] [PubMed] [Google Scholar]
- 4.Jack CR, Jr, Knopman DS, Weigand SD, et al. An operational approach to National Institute on Aging-Alzheimer’s Association criteria for preclinical Alzheimer disease. Ann Neurol. 2012;71(6):765–775. doi: 10.1002/ana.22628. [DOI] [PMC free article] [PubMed] [Google Scholar]
- 5.Jack CR, Jr, Knopman DS, Chételat G, et al. Suspected non-Alzheimer disease pathophysiology—concept and controversy. Nature Reviews Neurology. doi: 10.1038/nrneurol.2015.251. In Press. [DOI] [PMC free article] [PubMed] [Google Scholar]
- 6.Chetelat G. Alzheimer disease: Abeta-independent processes-rethinking preclinical AD. Nat Rev Neurol. 2013;9(3):123–124. doi: 10.1038/nrneurol.2013.21. [DOI] [PMC free article] [PubMed] [Google Scholar]
- 7.Jack CR, Jr, Wiste HJ, Weigand SD, et al. Amyloid-first and neurodegeneration-first profiles characterize incident amyloid PET positivity. Neurology. 2013;81(20):1732–1740. doi: 10.1212/01.wnl.0000435556.21319.e4. [DOI] [PMC free article] [PubMed] [Google Scholar]
- 8.Knopman DS, Jack CR, Jr, Wiste HJ, et al. Brain injury biomarkers are not dependent on beta-amyloid in normal elderly. Ann Neurol. 2012 doi: 10.1002/ana.23816. [DOI] [PMC free article] [PubMed] [Google Scholar]
- 9.Wirth M, Villeneuve S, Haase CM, et al. Associations between Alzheimer disease biomarkers, neurodegeneration, and cognition in cognitively normal older people. JAMA Neurol. 2013;70(12):1512–1519. doi: 10.1001/jamaneurol.2013.4013. [DOI] [PMC free article] [PubMed] [Google Scholar]
- 10.Crary JF, Trojanowski JQ, Schneider JA, et al. Primary age-related tauopathy (PART): a common pathology associated with human aging. Acta Neuropathol. 2014;128(6):755–766. doi: 10.1007/s00401-014-1349-0. [DOI] [PMC free article] [PubMed] [Google Scholar]
- 11.Jack CR., Jr PART and SNAP. Acta Neuropathol. 2014;128(6):773–776. doi: 10.1007/s00401-014-1362-3. [DOI] [PMC free article] [PubMed] [Google Scholar]
- 12.Jellinger KA, Alafuzoff I, Attems J, et al. PART, a distinct tauopathy, different from classical sporadic Alzheimer disease. Acta Neuropathol. 2015;129(5):757–762. doi: 10.1007/s00401-015-1407-2. [DOI] [PMC free article] [PubMed] [Google Scholar]
- 13.Braak H, Braak E. Frequency of stages of Alzheimer-related lesions in different age categories. Neurobiol Aging. 1997;18(4):351–357. doi: 10.1016/s0197-4580(97)00056-0. [DOI] [PubMed] [Google Scholar]
- 14.Nelson PT, Alafuzoff I, Bigio EH, et al. Correlation of Alzheimer disease neuropathologic changes with cognitive status: a review of the literature. J Neuropathol Exp Neurol. 2012;71(5):362–381. doi: 10.1097/NEN.0b013e31825018f7. [DOI] [PMC free article] [PubMed] [Google Scholar]
- 15.Duyckaerts C, Braak H, Brion JP, et al. PART is part of Alzheimer disease. Acta Neuropathol. 2015;129(5):749–756. doi: 10.1007/s00401-015-1390-7. [DOI] [PMC free article] [PubMed] [Google Scholar]
- 16.Chien DT, Bahri S, Szardenings AK, et al. Early clinical PET imaging results with the novel PHF-tau radioligand [F-18]-T807. J Alzheimers Dis. 2013;34(2):457–468. doi: 10.3233/JAD-122059. [DOI] [PubMed] [Google Scholar]
- 17.Johnson KA, Schultz A, Betensky RA, et al. Tau PET imaging in aging and early Alzheimer’s disease. Ann Neurol. 2015 doi: 10.1002/ana.24546. [DOI] [PMC free article] [PubMed] [Google Scholar]
- 18.Knopman DS, Jack CR, Jr, Wiste HJ, et al. Short-term clinical outcomes for stages of NIA-AA preclinical Alzheimer disease. Neurology. 2012;78(20):1576–1582. doi: 10.1212/WNL.0b013e3182563bbe. [DOI] [PMC free article] [PubMed] [Google Scholar]
- 19.Mormino EC, Betensky RA, Hedden T, et al. Synergistic effect of beta-amyloid and neurodegeneration on cognitive decline in clinically normal individuals. JAMA Neurol. 2014;71(11):1379–1385. doi: 10.1001/jamaneurol.2014.2031. [DOI] [PMC free article] [PubMed] [Google Scholar]
- 20.Vos SJ, Xiong C, Visser PJ, et al. Preclinical Alzheimer’s disease and its outcome: a longitudinal cohort study. Lancet Neurol. 2013;12(10):957–965. doi: 10.1016/S1474-4422(13)70194-7. [DOI] [PMC free article] [PubMed] [Google Scholar]
- 21.Fischl B, Salat DH, Busa E, et al. Whole brain segmentation: automated labeling of neuroanatomical structures in the human brain. Neuron. 2002;33(3):341–355. doi: 10.1016/s0896-6273(02)00569-x. [DOI] [PubMed] [Google Scholar]
- 22.Johnson KA, Schultz A, Betensky RA, et al. Tau PET imaging in aging and early Alzheimer’s disease. Ann Neurol. doi: 10.1002/ana.24546. In Press. [DOI] [PMC free article] [PubMed] [Google Scholar]
- 23.Landau SM, Harvey D, Madison CM, et al. Associations between cognitive, functional, and FDG-PET measures of decline in AD and MCI. Neurobiol Aging. 2009;32(7):1207–1218. doi: 10.1016/j.neurobiolaging.2009.07.002. [DOI] [PMC free article] [PubMed] [Google Scholar]
- 24.Mormino EC, Betensky RA, Hedden T, et al. Amyloid and APOE epsilon4 interact to influence short-term decline in preclinical Alzheimer disease. Neurology. 2014;82(20):1760–1767. doi: 10.1212/WNL.0000000000000431. [DOI] [PMC free article] [PubMed] [Google Scholar]
- 25.Amariglio RE, Mormino EC, Pietras AC, et al. Subjective cognitive concerns, amyloid-beta, and neurodegeneration in clinically normal elderly. Neurology. 2015;85(1):56–62. doi: 10.1212/WNL.0000000000001712. [DOI] [PMC free article] [PubMed] [Google Scholar]
- 26.Papp KV, Amariglio RE, Mormino EC, et al. Free and cued memory in relation to biomarker-defined abnormalities in clinically normal older adults and those at risk for Alzheimer’s disease. Neuropsychologia. 2015;73:169–175. doi: 10.1016/j.neuropsychologia.2015.04.034. [DOI] [PMC free article] [PubMed] [Google Scholar]
- 27.Donohue MC, Sperling RA, Salmon DP, et al. The preclinical Alzheimer cognitive composite: measuring amyloid-related decline. JAMA Neurol. 2014;71(8):961–970. doi: 10.1001/jamaneurol.2014.803. [DOI] [PMC free article] [PubMed] [Google Scholar]
- 28.Dickerson BC, Bakkour A, Salat DH, et al. The cortical signature of Alzheimer’s disease: regionally specific cortical thinning relates to symptom severity in very mild to mild AD dementia and is detectable in asymptomatic amyloid-positive individuals. Cereb Cortex. 2009;19(3):497–510. doi: 10.1093/cercor/bhn113. [DOI] [PMC free article] [PubMed] [Google Scholar]
- 29.Rowe CC, Ellis KA, Rimajova M, et al. Amyloid imaging results from the Australian Imaging, Biomarkers and Lifestyle (AIBL) study of aging. Neurobiol Aging. 2010;31(8):1275–1283. doi: 10.1016/j.neurobiolaging.2010.04.007. [DOI] [PubMed] [Google Scholar]
- 30.Dawe RJ, Bennett DA, Schneider JA, Arfanakis K. Neuropathologic correlates of hippocampal atrophy in the elderly: a clinical, pathologic, postmortem MRI study. PLoS One. 2011;6(10):e26286. doi: 10.1371/journal.pone.0026286. [DOI] [PMC free article] [PubMed] [Google Scholar]
- 31.Josephs KA, Whitwell JL, Tosakulwong N, et al. TAR DNA-binding protein 43 and pathological subtype of Alzheimer’s disease impact clinical features. Ann Neurol. 2015 doi: 10.1002/ana.24493. [DOI] [PMC free article] [PubMed] [Google Scholar]
- 32.Raz N, Gunning-Dixon F, Head D, Rodrigue KM, Williamson A, Acker JD. Aging, sexual dimorphism, and hemispheric asymmetry of the cerebral cortex: replicability of regional differences in volume. Neurobiol Aging. 2004;25(3):377–396. doi: 10.1016/S0197-4580(03)00118-0. [DOI] [PubMed] [Google Scholar]
- 33.Knopman DS, Jack CR, Jr, Wiste HJ, et al. F-fluorodeoxyglucose positron emission tomography, aging, and apolipoprotein E genotype in cognitively normal persons. Neurobiol Aging. 2014 doi: 10.1016/j.neurobiolaging.2014.03.006. [DOI] [PMC free article] [PubMed] [Google Scholar]
- 34.Jack CR, Jr, Dickson DW, Parisi JE, et al. Antemortem MRI findings correlate with hippocampal neuropathology in typical aging and dementia. Neurology. 2002;58(5):750–757. doi: 10.1212/wnl.58.5.750. [DOI] [PMC free article] [PubMed] [Google Scholar]
- 35.Thal DR, Beach TG, Zanette M, et al. [(18)F]flutemetamol amyloid positron emission tomography in preclinical and symptomatic Alzheimer’s disease: specific detection of advanced phases of amyloid-beta pathology. Alzheimers Dement. 2015;11(8):975–985. doi: 10.1016/j.jalz.2015.05.018. [DOI] [PubMed] [Google Scholar]
Associated Data
This section collects any data citations, data availability statements, or supplementary materials included in this article.