Abstract
Purpose
To test the efficacy of triple-refocusing MRS for improved detection of 2-hydroxyglutarate (2HG) in brain tumors at 3T in vivo.
Methods
The triple-refocusing sequence parameters were tailored at 3T, with density-matrix simulations and phantom validation, for enhancing the 2HG 2.25-ppm signal selectivity with respect to the adjacent resonances of glutamate (Glu), glutamine (Gln) and GABA. In-vivo MRS data were acquired from 15 glioma patients and analyzed with LCModel using calculated basis spectra. Metabolites were quantified with reference to water.
Results
A triple-refocusing sequence (TE = 137 ms) was obtained for 2HG detection. The 2HG 2.25-ppm signal was large and narrow while the Glu and Gln signals between 2.2 and 2.3 ppm were minimal. The optimized triple refocusing offered improved separation of 2HG from Glu, Gln and GABA when compared to published MRS methods. 2HG was detected in all the 15 patients, the estimated 2HG concentrations ranging from 2.4 to 15.0 mM, with Cramer-Rao lower bounds of 2 – 11%. The 2HG estimates did not show significant correlation with total choline.
Conclusion
The optimized triple refocusing provides excellent 2HG signal discrimination from adjacent resonances and may confer reliable in-vivo measurement of 2HG at relatively low concentrations.
Keywords: 2-Hydroxyglutarate (2HG), 1H MRS, 3T, Triple refocusing, Human brain tumor, Glioma, Isocitrate dehydrogenase (IDH)
INTRODUCTION
Cancers reprogram their metabolism to meet the needs of rapid cell growth (1,2), resulting in alterations in metabolic profiles. The metabolic activity of tumors is predictive of their genetype and may also predict tumor grade and patient outcomes. The majority of World Health Organization grade-2 and grade-3 gliomas and secondary glioblastomas contain mutations in the metabolic enzymes, isocitrate dehydrogenase (IDH) 1 and 2 and the mutations are associated with 2 – 3 times longer patient survival compared to IDH wild-type tumors (3–5). These heterozygous mutations are confined to the active site of the enzyme and result in a neomorphic activity that causes the mutant enzyme to produce an oncometabolite, 2-hydroxyglutarate (2HG), and as a result 2HG, which is normally present in vanishingly small quantities, is elevated by 2 – 3 orders of magnitude in IDH-mutated gliomas (6–8). Noninvasive identification of elevated 2HG therefore has significant clinical utility in patient care.
In-vivo detection of 2HG in patients by 1H MRS at the widely-available field strength 3T was recently reported by several researchers. Among the five non-exchangeable, J-coupled proton resonances of 2HG, the C4-proton resonances at ~2.25 ppm, which are proximate to each other, give rise to a large signal in most experimental situations and may be well detectable using short-TE point-resolved spectroscopy (PRESS) (9,10) and optimized long-TE PRESS (10–12) when the 2HG concentration is relatively high. The C2-proton resonance at 4.02 ppm, which is weakly coupled to the C3-proton spins, can be detected using J-difference editing (11,13,14), but the small edited signal from a single proton spin is difficult to assess reliably when the baseline at ~4 ppm is distorted due to the presence of artefactual signals arising from potential subject motion and/or imperfect cancelation of adjacent resonances including water. 2D correlation spectroscopy provides excellent signal separation (13), but the sensitivity is low compared to the aforementioned approaches, its applicability likely being limited to cases with high 2HG concentration.
At present, precise evaluation of 2HG at relatively low concentration with abundant signals in the proximity remains challenging at 3T. When targeting the 2HG 2.25-ppm resonance, the major interferences include glutamate (Glu) and glutamine (Gln). The Glu C4-proton and Gln C3-proton resonances (2.35 and 2.12 ppm respectively) can interfere with 2HG estimation extensively when their signals are large compared to 2HG signal. The 2HG and interference resonances are all strongly coupled and consequently the coherences evolve with time in complex manners. For example, the 2HG C4-proton signal is not symmetric with respect to the PRESS subecho times, TE1 and TE2 (11). This complicated dependence of strongly-coupled resonances on the inter-RF pulse timings can be utilized for manipulating the J-coupled spin coherences for detection of signals of interest. Triple refocusing (90° – 180° – 180° – 180°) has three subecho times and may provide a means of manipulating the J-coupled spin signals more effectively. In this paper, we propose a triple-refocusing sequence for 2HG measurement, whose subecho times and RF pulse duration were tailored, with numerical simulation and phantom validation, for generating a large and narrow 2HG signal at 2.25 ppm and suppressing the Glu, Gln and GABA signals between 2.2 and 2.3 ppm. Preliminary in-vivo data from 15 patients is presented.
METHODS
Fourteen patients with biopsy-confirmed IDH mutant gliomas and a patient with a lesion in the brainstem (6 males and 9 females; age range 25 – 67, median age of 44 years old) were recruited for the present study. The IDH mutations were all IDH1 R132H, according to immunohistochemical analysis of tumor tissue. The tumor locations included 6 frontal, 5 parietal, 3 temporal, and 1 brainstem. The protocol was approved by the Institutional Review Board of the University of Texas Southwestern Medical Center. Written informed consent was obtained from patients prior to the scans.
Density-matrix simulation of 3D-volume localized triple refocusing was carried out to optimize the sequence parameters for detection of the 2HG 2.25-ppm resonance. The time evolution of the density operator was calculated by solving the Liouville-von Neumann equation for the Hamiltonian that included Zeeman, chemical shift and scalar coupling terms, and shaped RF and gradient pulses, using a product-operator based transformation matrix algorithm described in a prior study (11). The spatial resolution of slice selection was set to 1%, namely, 0.01 = sample length/number of pixels/slice thickness, where the sample length was two-fold greater than the slice thicknesses with number of pixels (isochromats) of 200. The MRS sequence had three 180° RF pulses following a 90° excitation RF pulse, as shown in Fig. 1. The 90° pulse and the first and third 180° pulses were slice selective while the second 180° was non-slice selective. Volume localization RF pulses included a 9.8-ms long 90° pulse with bandwidth (at half amplitude) of 4.2 kHz and two 13.2-ms long 180° pulses with bandwidth of 1.3 kHz, at an RF field strength (B1) of 13.5 μT, whose envelopes are shown in prior papers (10,15). Spectra of 2HG, GABA, Glu, and Gln were numerically calculated for various durations of the second 180° RF pulse and various subecho time sets (TE1, TE2, TE3). The carrier frequencies of the RF pulses were all set to 2.5 ppm in the simulations. Published chemical shift and J coupling constants were used for the simulations (16–18). The computer simulation was programmed with Matlab (The MathWorks, Inc., Natick, MA).
Figure 1.
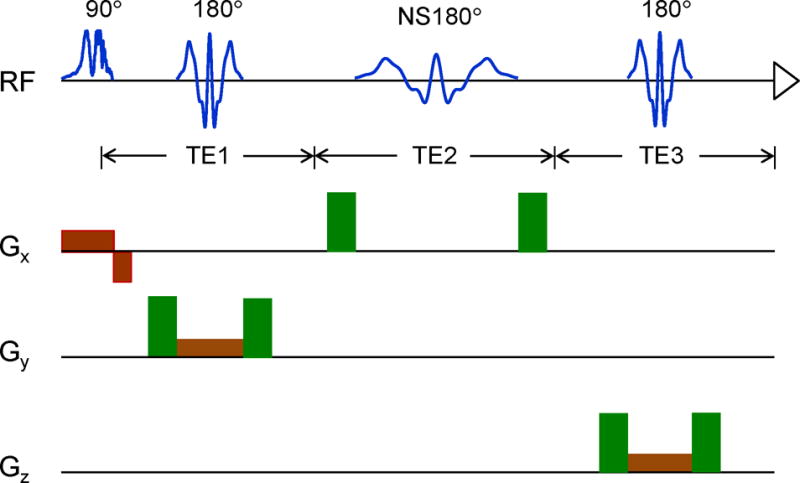
(a) Schematic diagram of the triple-refocusing sequence used is shown with slice selective gradients (brown) and spoiling gradients (green) (strength 32 mT/m, length 1.7 ms, total slope length 0.8 ms). The durations of the slice selective RF pulses were kept the same in numerical simulations and experiments. The duration of the non-slice selective, second 180° RF pulse (NS180) was varied in the simulations.
MR experiments were carried out on a whole-body 3T scanner (Philips Medical Systems, Best, The Netherlands), equipped with a whole-body coil for RF transmission and an 8-channel phased-array head coil for reception. An in-vitro test of the 2HG-optimized triple-refocusing sequence was conducted on a phantom solution with 2HG (8 mM) and Gly (10 mM), at pH = 7.0 and temperature 37°C. Data were acquired, with TR = 9 s and TE = 137 ms, from a 2×2×2 cm3 voxel at the center of the phantom sphere (6 cm diameter). Phantom T2s of 2HG and Gly were evaluated from comparison of experimental and calculated spectra at 10 equidistant TEs between 50 and 500 ms. In-vivo triple-refocused spectra were obtained from tumors identified by T2-weighted fluid-attenuated inversion recovery (T2-FLAIR) imaging. The MRS voxel size was 4 – 10 mL, depending on the tumor volume. MRS acquisition parameters included TR = 2 s, sweep width = 2.5 kHz, number of sampling points = 2048, and number of signal averages (NSA) = 128 – 512. Water suppression was obtained with a vendor-supplied four-pulse variable-flip-angle sub-sequence. First and second order shimming was carried out, using the fast automatic shimming technique by mapping along projections (FASTMAP) (19). A 256-step RF phase cycling scheme, which had 4 orthogonal phases for each of the four RF pulses, was used to minimize potential outer-volume signals. In addition, unsuppressed water was acquired from the voxel for eddy current compensation and multi-channel combination. Unsuppressed water was also obtained with short-TE (13 ms) STEAM and TR = 20 s, for use as reference in metabolite quantification. The RF carrier frequencies of the triple-refocusing sequence were set at 2.5 ppm and were adjusted for B0 drifts in each excitation using a vendor-supplied tool (Frequency Stablization). Surgical cavities, areas of intratumoral hemorrhage, cystic changes, and necrosis, identified on T2-FLAIR anatomical images, were excluded from the tumor voxels.
Spectral fitting was performed with LCModel software (20), following apodization using a 1-Hz exponential function. The basis set for the fitting had in-house calculated model spectra of 21 metabolites, which included 2HG, Glu, Gln, GABA, NAA (N-acetylaspartate), tCr (creatine+phosphocreatine), Gly (glycine), mI (myo-inositol), Lac (lactate), GSH (glutathione), Ala (alanine), Ace (acetate), Asp (aspartate), Eth (ethanolamine), PE (phosphorylethanolamine), sI (scyllo-inositol), Tau (taurine), NAAG (N-acetylaspartylglutamate), Glc (glucose), Suc (succinate), tCho (glycerophosphorylcholine + phosphorylcholine). The spectral fitting was conducted between 0.5 and 4.1 ppm. Cramér-Rao lower bounds (CRLB), returned as percentage standard deviation by LCModel, were used to determine the precision of the metabolite estimates. Metabolite concentrations were estimated with reference to water at 48 M for all tumors. Relaxation effects on metabolite signals were corrected using published metabolite T2 and T1 values and equation [1] of reference 10; T2 = 170, 290 and 260 ms for tCr, tCho and tNAA, respectively, and 180 ms for 2HG and other metabolites (21,22); T1 = 1.2 s for 2HG, Glu, Gln and mI, and 1.5 s for other metabolites (23,24). Data are presented as mean ± standard deviation.
RESULTS
Triple-refocused spectra of 2HG were numerically calculated for ten values of the non-selective (NS), second 180° RF pulse duration (i.e., TpNS180 = 14 – 32 ms with 2 ms increments) and for all possible combinations of subecho times TE1, TE2 and TE3 (2 ms increments for each) for total echo time (TE) between the shortest possible TE and 150 ms (total ~130,000 spectra). The result indicated that the 2HG 2.25-ppm peak amplitude overall increases with TE in a sinusoidal fashion, with temporal maxima at TEs of ~78, ~110 and ~136 ms (Fig. 2). The 2HG signal strength and its TE dependence were both very different between TpNS180 values, exhibiting large 2HG signals at TE = ~110 ms when TpNS180 = 14 – 18 ms, and at TE = ~136 ms when TpNS180 = 20 – 32 ms. The spectral pattern of the 2HG 2.25-ppm resonance also depended on TpNS180 and TE. The 2HG multiplet became progressively narrower with increasing TpNS180 and as a result the multiplet width at half amplitude was as small as a singlet width for TpNS180 ≥ 24 ms, for which the TEs of the signals were all between 130 and 140 ms, with subecho times of TE1 = 26 – 34 ms, TE2 = 82 – 90 ms, and TE3 = 20 – 24 ms. Apparently, long TE and long TpNS180 were preferable for minimizing the interferences from GABA, Glu and Gln (Fig. 3). To refine the TpNS180 and the subecho times, spectra of 2HG, GABA, Glu and Gln were calculated for the aforementioned subecho time ranges, with 1 ms increments of subecho times and for TpNS180 = 24, 26, 28, 30 and 32 ms. The Glu C4-proton resonance (~2.35 ppm) was attenuated, giving rise to small signals with various patterns between 2.25 and 2.3 ppm. For Gln, the C3-proton resonance (~2.12 ppm), which was also attenuated, exhibiting signal variations between 2.2 and 2.25 ppm. A triple-refocusing condition was searched for with criteria; 1) high amplitude and small width of the 2HG 2.25-ppm multiplet and 2) small signals of GABA, Glu and Gln between 2.2 and 2.3 ppm. A triple-refocusing scheme for 2HG detection was finalized as TpNS180 = 26 ms and (TE1, TE2, TE3) = (30, 86, 21) ms. In addition, with the same TpNS180 and the same total echo time of 137 ms, we obtained another subecho time set, (TE1, TE2, TE3) = (39, 26, 72) ms, at which the 2HG 2.25-ppm resonance was minimal. The 26-ms 180° RF pulse had a bandwidth of 640 Hz at half amplitude, acting on resonances between 0 and 5 ppm with a carrier frequency of 2.5 ppm.
Figure 2.
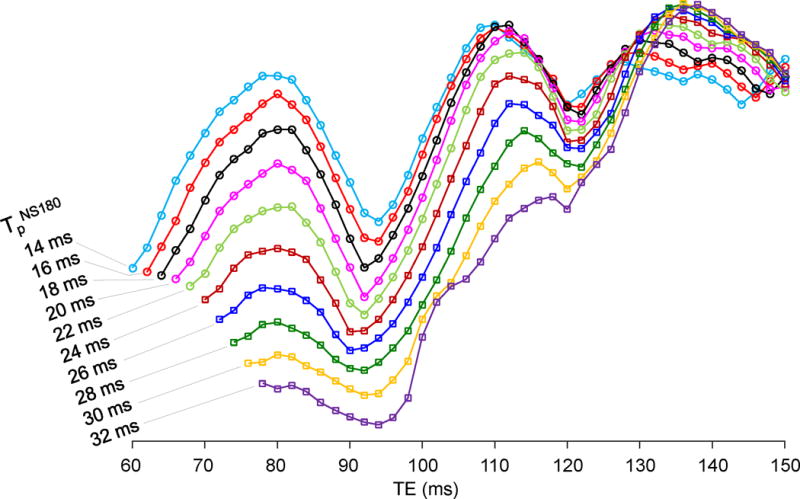
TE dependence of the numerically-calculated 2HG 2.25-ppm peak amplitude is shown for ten values of the non-selective, second 180° RF pulse duration (TpNS180) of the triple-refocusing sequence used in the study. The 2HG peak amplitude was obtained from the spectra broadened to singlet linewidth of 5 Hz.
Figure 3.
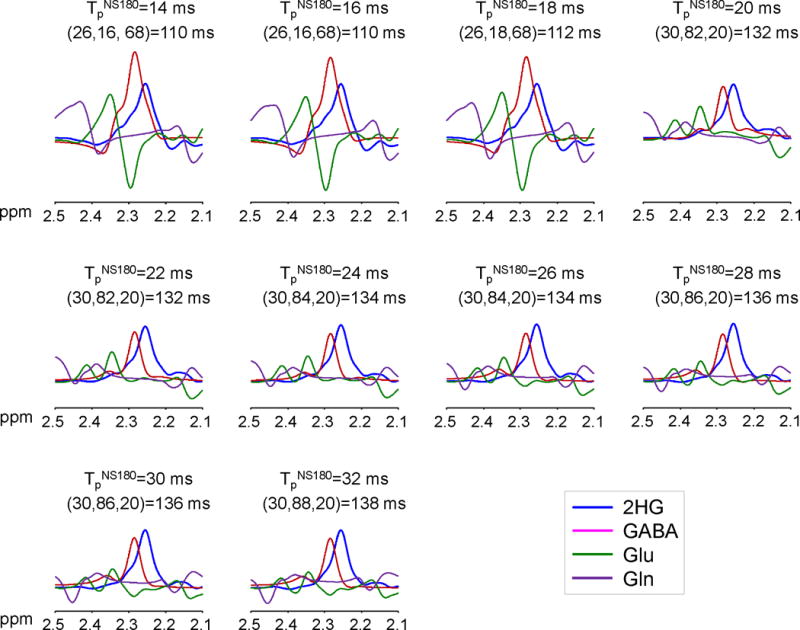
Numerically calculated spectra of 2HG, GABA, Glu and Gln at equal concetrations for each of TpNS180 = 14 – 32 ms with 2 ms increments. The subecho time set (TE1, TE2, TE3), shown together with TE at the top in each figure, was chosen at which the 2HG 2.25-ppm peak amplitude was maximum for each TpNS180. Spectra were broadened to singlet linewidth of 5 Hz. Shown at the top of each figure are TpNS180, (TE1, TE2, TE3), and TE.
Figure 4a shows the spectra of 2HG, GABA, Glu and Gln, calculated for the 2HG-optimized triple-refocusing sequence. For equal concentrations, the spectral range between 2.2 and 2.3 ppm was dominated by the 2HG and GABA signals, with minimal contributions from Glu and Gln. The Glu and Gln C4-/C3-proton signals, whose amplitudes are greater than the 2HG 2.25-ppm signal at zero TE (i.e., by 1.16 and 1.08 fold), were extensively suppressed, and as a result the Glu and Gln signals between 2.2 and 2.3 ppm were ~3% and ~7% with respect to 2HG, respectively. The GABA 2.29-ppm resonance, which also gives a larger signal (1.29 fold) than 2HG at zero TE, was markedly reduced (2.8 fold), resulting in a smaller signal (82%) than the 2HG signal. The 2HG 2.25-ppm signal yield of the sequence was 56% compared to 90°-acquisition for a localized volume, ignoring T2 relaxation effects. For the 2HG-suppressed subecho time set, the 2HG signal was essentially null between 2.2 and 2.3 ppm, in which the GABA signal was dominant (Fig. 4b).
Figure 4.
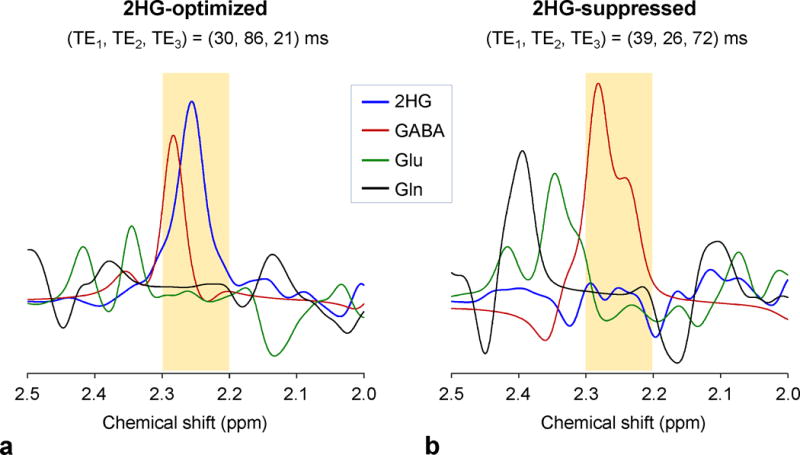
Spectra of 2HG, GABA, Glu and Gln at equal concentrations, numerically calculated for the 2HG-optimized and 2HG-suppressed triple-refocusing sequences.
We tested the 2HG-optimized and 2HG-suppressed triple-refocusing sequences in a 2HG plus Gly phantom and in an IDH-mutated glioma patient in vivo (Fig. 5). The calculated 2HG spectra were in excellent agreement with phantom spectra for both triple-refocusing schemes. For the 2HG-optimized sequence, the calculated and phantom spectra both showed a large and narrow 2HG peak at 2.25 ppm, with small signals at ~1.9 and ~4.0 ppm. For a Gly 3.55-ppm singlet linewidth of 5 Hz, the 2HG 2.25-ppm signal width in the phantom spectrum was 5.5 Hz, consistent with the simulation. The experimental 2HG 2.25-ppm peak area was ~73% with respect to the Gly peak area, reproducing the prepared 2HG-to-Gly concentration ratio (8:10), when the phantom T2 effects were corrected (Gly T2 = 1.4 s and 2HG T2 = 0.7 s). For the 2HG-suppressed sequence, the 2HG 2.25-ppm resonance was diminished in the phantom spectrum, as predicted by the simulation. The 2HG signal manipulation by the triple-refocusing schemes was reproduced in vivo. In an IDH-mutated oligoastrocytoma patient, a large peak was observed at 2.25 ppm in the 2HG-optimized triple-refocused spectrum, but the 2HG-suppressed triple-refocused spectrum did not present a noticeable signal between 2.2 and 2.3 ppm, indicating that the large peak at 2.25 ppm was attributed to 2HG. The 2HG level in the tumor was estimated to be 15.0 mM, which was the highest among the 14 tumors studied. tCho was quite elevated (4.2 mM) compared to the published normal level from similar regions (~1.5 mM) (25).
Figure 5.
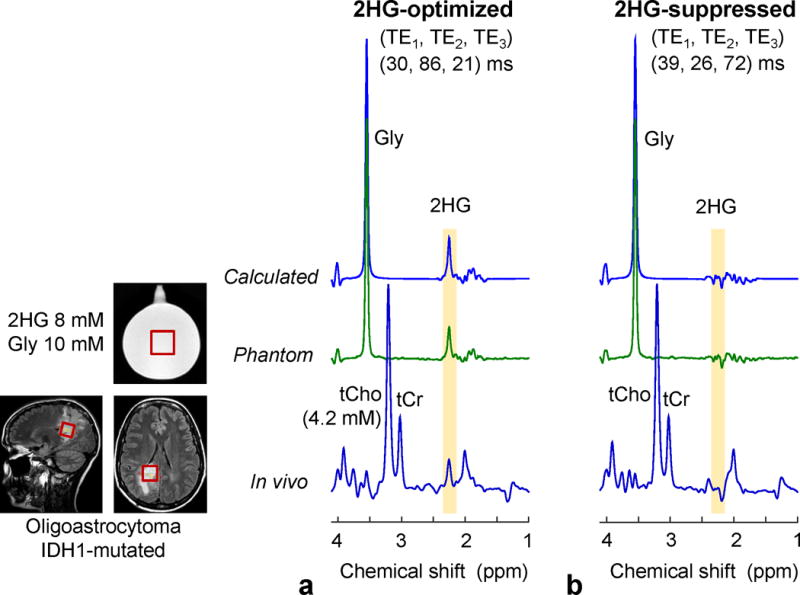
Calculated, in-vitro and in-vivo spectra, obtained with the 2HG-optimized and 2HG-suppressed triple-refocusing sequences. The MRS voxel positioning (2.3×2.3×2.3 cm3) is shown in the T2w-FLAIR images. The calculated and in-vitro spectra were broadened to match the in-vivo linewidth (singlet FWHM = 5 Hz). The 2HG-to-Gly concentration ratio was 8:10 for the calculation and in vitro. The in-vivo scan parameters included NSA = 128, TR = 2 s, and TE = 137 ms for both scans.
Figure 6 compares in-vivo spectra from a tumor vs. the contralateral region in a subject with an IDH-mutated oligodendroglioma. 2HG-optimized triple-refocusing spectra were obtained from the tumor mass in the right insula and from a normal-appearing region in the left insula. With identical voxel size (5.8 mM) and scan time (13 min) between the scans, the signal-to-noise ratio and singlet linewidth were similar between the spectra. The overall spectral pattern was different between the spectra due to the differences in metabolite concentrations. The spectrum from the tumor showed slight elevation of tCho and tCr and marked decrease in tNAA, compared to the contralateral. A large signal was present at 2.25 ppm in the tumor spectrum. The 2HG level in the tumor was estimated to be 5.4 mM, with CRLB of 5%. The data from the contralateral voxel did not show evidence of 2HG. GABA was not reliably measurable in the tumor or in the contralateral voxel.
Figure 6.
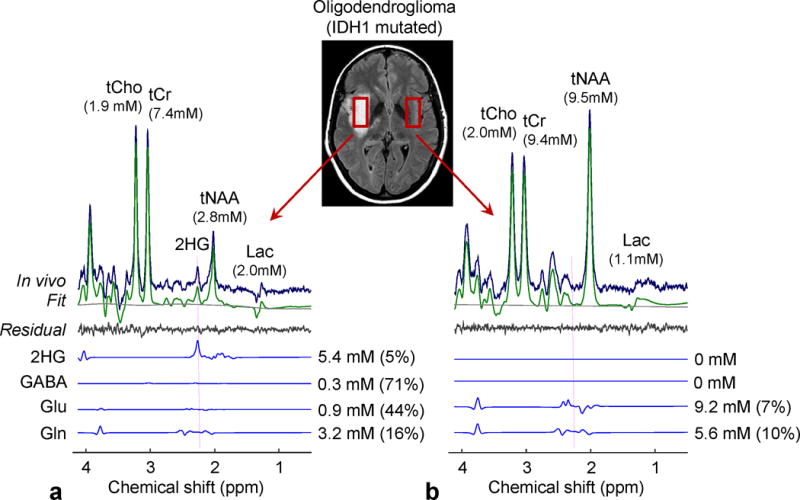
In-vivo spectra from an IDH1-mutated oligodendroglioma (a) and the contralateral voxel (b), obtained with the 2HG-optimized triple-refocusing sequence, are shown together with LCModel outputs and spectra of 2HG, GABA, Glu and Gln. The estimated concentrations of the metabolites are presented with percentage CRLB values. Vertical dotted lines were drawn at 2.25 ppm. The voxel size and scan time were identical between the scans (3.2×1.5×1.2 cm3 and 12.8 min). Spectra were normalized to STEAM TE=13 ms water. The metabolite concentrations in the contralateral were estimated with reference to water at 40 M following the correction for relaxation effects using T2 = 150, 240, 290 and 180 ms for tCr, tCho, tNAA, and other metabolites, respectively (21,22), and T1 values used for tumor data correction.
Since the 2HG-optimized triple-refocusing sequence was designed for improving 2HG detectability, we compared its performance with a previously-reported PRESS TE=97 ms method (11) in an IDH-mutated tumor with relatively low 2HG concentration (Fig. 7). The metabolite signals were overall smaller in the triple-refocused spectrum than in the PRESS spectrum, largely due to differences in T2 relaxation effects (TE = 137 vs. 97 ms). In the PRESS spectrum (Fig. 7b), a signal was discernible at ~2.25 ppm, and the signal was extensively overlapped with a much larger Glu signal at 2.35 ppm. LCModel analysis of the PRESS data resulted in a 2HG estimate of 0.6 mM (CRLB = 61%), with a GABA estimate of 2.3 mM. In the triple-refocused spectrum, the Glu C4-proton resonance was drastically attenuated, giving rise to a signal at 2.25 ppm (Fig. 7a, Inset). 2HG was estimated to be 2.4 mM with a much smaller CRLB (11%). The GABA estimate was 0.9 mM, which may be slightly lower than normal similarly to moderate decreases in tNAA and Glu. Albeit the large T2 signal loss the triple refocusing provided improved precision compared to the published long-TE PRESS method, which was largely due to line narrowing of 2HG and suppression of Glu, Gln and GABA resonances.
Figure 7.
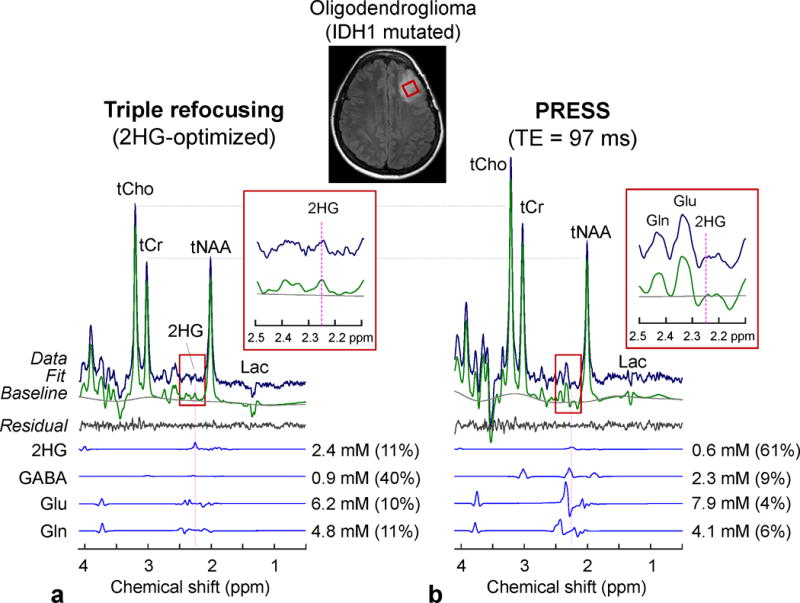
In-vivo spectra from an IDH1-mutated oligodendroglioma, obtained with (a) triple refocusing and (b) PRESS TE = 97 ms (11), are shown with LCModel outputs and spectra of 2HG, GABA, Glu and Gln. The voxel size and scan time were identical between the scans (2×2×2 cm3 and 5 min). Spectra were normalized to STEAM TE = 13 ms water. Insets show magnified spectra between 2.1 and 2.5 ppm.
In addition, we tested the 2HG-optimized MRS in a subject with a lesion in the brainstem. The patient did not undergo biopsy and thus the lesion was clinically undefined. A regular clinical MR scan (which had been done independently of the present study) showed increases in tCho and Lac and decreases in tCr and tNAA, which are commonly observed in many tumors. Given that these metabolic alterations also occur in other neurological diseases such as stroke, multiple sclerosis, demyelination, etc. (26), the abnormal levels of those metabolites did not provide useful clinical information. Our triple-refocusing MRS scan showed elevated 2HG, indicating the lesion was an IDH-mutated glioma. A 2HG signal at 2.25 ppm was clearly discernible without considerable interferences in the proximity (Fig. 8). A composite signal at ~4.05 ppm was decomposed into 2HG (4.02 ppm) and mI (4.06 ppm) signal in the spectral fitting. The 2HG level was estimated to be 4.7 mM with CRLB of 5%. GABA was undetectable, suggesting that the low-concentration neurotransmitter in the white-matter dominant region was substantially decreased due to the presence of tumor cells.
Figure 8.
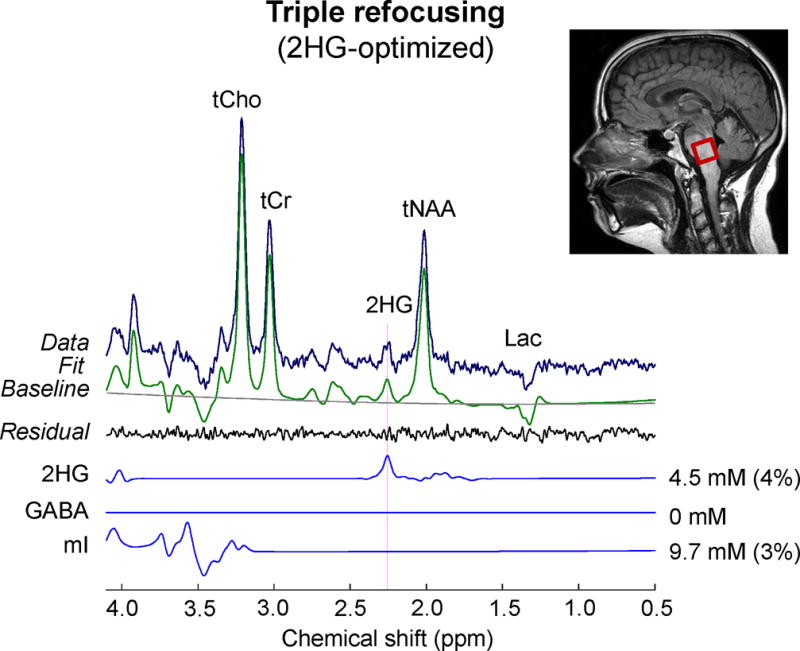
An in-vivo triple-refocused spectrum from a brainstem lesion is shown with LCModel outputs and spectra of 2HG, GABA, and mI. The in-vivo scan parameters included voxel size = 2×2×2 cm3, NSA = 128, TR = 2 s, and TE = 137 ms.
For the MRS scans in the 15 patients in this study, the mean voxel size was 7.1±2.5 mL, with mean linewidth of the tCho singlet at 6.7±1.7 Hz. With an average scan time of 7.1±4.6 min, the ratio of the tCho peak amplitude to noise was 163±82, where the noise standard deviation was calculated from the spectral region between −5 and 0 ppm. 2HG was measurable in all 15 patients. The estimated 2HG levels ranged from 2.4 to 15.0 mM (mean = 5.4±3.2 mM), with CRLBs between 2% and 11% (mean = 6±2%). The GABA estimation was relatively less reliable. Excluding 3 cases with zero GABA estimates, the mean GABA level was obtained as 0.3±0.2 mM, with mean CRLB of 252±387%. The LCModel-returned correlation coefficient between 2HG and GABA signals ranged from −0.32 to −0.08 (mean = −0.18±0.07). The correlation coefficients of 2HG signal with respect to Glu and Gln were relatively small (i.e., ranging from −0.08 to 0.13 and from −0.08 to 0.17 respectively), which may be due to the Glu and Gln signal suppression. tCho was elevated in all the tumors studied, with a mean level at 3.7±2.3 mM (CRLB = 1% for all). tNAA was substantially decreased (mean = 2.8±2.2 mM). Lastly, we evaluated potential correlation between 2HG and tCho levels in our data set. Figure 9 presents the 2HG and tCho estimates from the 14 patients with biopsy-confirmed IDH1 R132H mutated gliomas (excluding a brainstem tumor). There was no evidence of significant correlation between the metabolite concentrations (p = 0.28).
Figure 9.
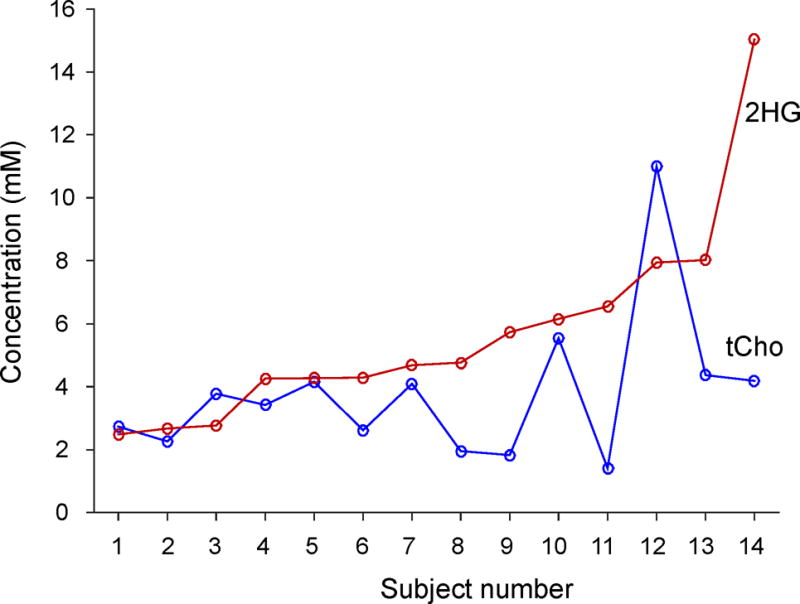
The estimated concentrations of 2HG and tCho in 14 glioma patients with IDH1 mutated gliomas. The data are arranged in the order of increasing 2HG level left to right.
DISCUSSION
The current paper reports a new triple-refocusing approach for 2HG detection at 3T. Taking advantage of the high variability of J-coupled spin signals with changes of the three subecho times, the signals of 2HG, GABA, Glu and Gln were effectively manipulated for improving the 2HG detectability in vivo. With the 2HG-optimized triple-refocusing scheme, considerable line narrowing of the 2HG 2.25-ppm multiplet was achieved with good signal yield. Moreover, the signals of Glu and Gln were extensively suppressed, giving nearly no interferences with 2HG measurement. The GABA 2.29-ppm resonance was also suppressed. Assuming that GABA is decreased in brain tumors similarly to NAA and Glu, the interference of residual GABA signals with 2HG evaluation may not be considerable in many tumors. When the GABA 2.29 ppm signal is not negligible compared to the 2HG 2.25 ppm peak, separation of 2HG from GABA may be achievable by the 2HG 4.0 ppm resonance whose signal is ~40% of the 2HG 2.25 ppm signal. In addition, the triple refocusing sequence with TE=137 ms gives rise to an inverted Lac signal at 1.31 ppm and thus Lac can be easily resolved from the overlapping signals of lipids which are increased in some tumors.
Compared to PRESS short-TE (30 ms) and TE=97 ms (11), the 2HG-optimized triple refocusing gives a smaller 2HG 2.25-ppm signal (see Fig. 10). The 2HG 2.25-ppm peak amplitude ratio between the triple refocusing, PRESS TE=97 ms, and PRESS TE=30 ms was calculated to be 72:76:100. The signal reduction at the long TEs will be extensive in vivo because of the T2 relaxation effect. However, high signal selectivity is important for reliable measurement of 2HG. While the signals of 2HG, Glu and Gln are extensively overlapped with each other at short TE, PRESS TE=97 ms provides signal narrowing and consequently improved spectral resolution between 2HG, Glu and Gln (Fig. 10b,c). However, this PRESS TE=97 ms does not fully differentiate the 2HG signal from the adjacent resonances and thus 2HG evaluation will be compromised when the Glu and Gln signals are much larger than the 2HG signal (as shown in Fig. 7). The triple refocusing provides excellent suppression of these major interference signals between 2.2 and 2.3 ppm and suppression of the GABA 2.29-ppm resonance by ~50% with respect to the PRESS TE=97 ms method (Fig. 10a,b). Benefits from this signal suppression were observed in terms of CRLB and LCModel-returned correlation coefficient, which is a measure of the dependency (or interference) between metabolite signal estimates. For the 15 tumors studied, the mean 2HG CRLB was clearly smaller in triple refocusing than in PRESS TE=97 ms (6±2% vs. 9±15%) although the mean 2HG estimate was about the same between the methods (5.4±3.2 vs. 5.5±3.7 mM). The correlation coefficients of 2HG with respect to GABA, Glu and Gln ranged from −0.32 to −0.08, −0.08 to 0.13, −0.08 to 0.17 for triple refocusing, and −0.28 to −0.62, 0.18 to 0.42, −0.11 to 0.22 for PRESS TE=97 ms, respectively. It is noteworthy that the tCho singlet amplitude to noise ratio was about the same between the triple refocusing TE=137 ms and PRESS TE=97 ms (171±68 vs. 172±81) largely due to difference in the tCho singlet line width between the methods (FWHM 6.7±1.7 vs. 7.1±2.0 Hz, p = 0.02). Among the 14 IDH-mutated tumors, triple refocusing gave all meaningful 2HG measures while the long-TE PRESS failed in one case (Fig. 7). Taken together, the 2HG-optimized triple refocusing approach may provide more reliable estimation of 2HG than the PRESS short- and long-TE methods.
Figure 10.
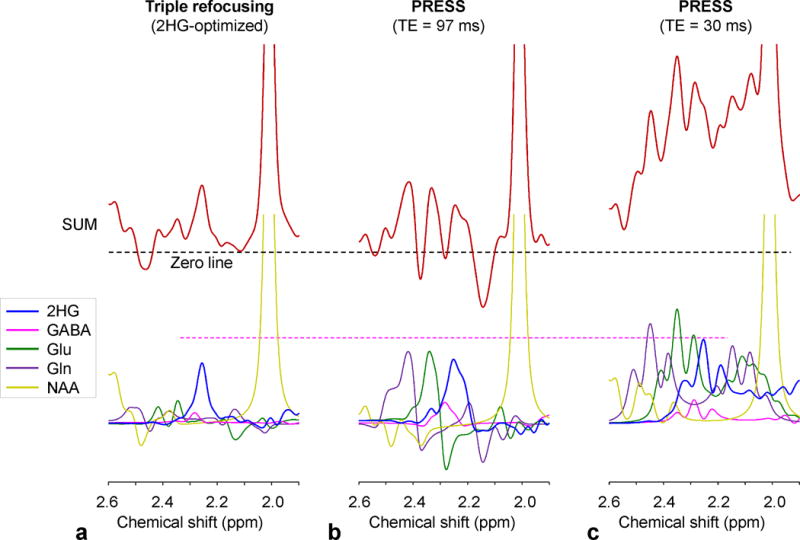
Spectra of 2HG, GABA, Glu, Gln and NAA at a concentration ratio of 5:1:5:5:5, numerically calculated for (a) the 2HG-optimized triple refocusing, (b) PRESS TE = 97 ms (TE1 = 32 ms and TE2 = 65 ms), and (c) PRESS TE = 30 ms at 3T, are shown together with the sum spectra for each sequence. Spectra were broadened to NAA singlet linewidth of 5 Hz.
In the present triple-refocusing study, the carrier frequency of the non-slice selective 180° RF pulse (NS180), νcNS180, was set to 2.5 ppm throughout the experiments. It is noteworthy that the J-coupled spin metabolite signals following the triple-refocusing sequence is affected by νcNS180. For the 26-ms long RF pulse used, the 180° action is equally uniform over the 2HG resonances for νcNS180 = 3.5, 3.0 and 2.5 ppm. The resulting 2HG signal for the 2HG-optimized triple refocusing is quite different between these carrier frequencies, while the singlet intensity is identical. The 2HG 2.25-ppm signal intensity was calculated to be 81:86:100 for νcNS180 = 3.5, 3.0 and 2.5 ppm, respectively, ignoring T2 relaxation effects. The overall pattern of the 2HG signal was also influenced by the NS180 carrier frequency. The triple-refocusing scheme used for experiments in this study had an NS180 as the second 180° pulse. This triple-refocusing scheme is likely advantageous over the scheme with an NS180 as the first or third 180° pulse. A computer simulation indicated that the 2HG signal is overall smaller and broader in the scheme with an NS180 as the first 180° pulse compared to the triple-refocusing sequence of the present study. For the scheme with an NS180 as the third 180° pulse, the 2HG signals were similar as in the scheme used for experiments, but with the presence of a non-slice selective RF action at the end of the sequence, the volume localization performance may be low.
There are several pitfalls in the 2HG estimation in the present study. First, due to the use of long TE (137 ms), accurate evaluation of 2HG requires a 2HG T2 value in tumors, which has not been reported to date. Potential 2HG T2 variations between tumors will cause errors in 2HG estimation. Second, use of STEAM water as reference causes some errors because the frequency profiles of the slice-selective 90° and 180° RF pulses used were not identical (i.e., transition width/bandwidth ≅ 10% and 12% respectively (27)). The discrepancy between the STEAM and PRESS voxel shapes was ignored in this study. Given that water T2 is quite different between tumors (21), the errors arising from the profile discrepancy may be smaller than the errors that can be introduced when triple-refocused water signal at the shortest possible TE (~70 ms) is used as reference. Lastly, metabolites were quantified with reference to water at 48 M, which was determined based on proton density images from 7 tumors (data not shown) that showed the tumor water signal higher by 19% than the white-matter water concentration (40 M) (28). Use of a constant water concentration will cause errors in metabolite quantification when the water concentration differs between tumors.
Lastly, our in-vivo 2HG data from IDH1 mutated gliomas did not show significant correlation with tCho, in contrast to a prior ex-vivo 1H MRS study (29). The tCho elevation was moderate to high in our data, with concentrations ranging from 1.5 to 11 mM. tCho is elevated in brain tumors due to increased phospholipid metabolism (30,31). Specifically, elevation of tCho in IDH1-mutant gliomas may be attributed to membrane synthesis of mitochondria which is increased to compensate for the utilization of α-ketoglutarate and NADPH for the α-ketoglutarate to 2HG conversion in the cytosol (32). IDH wild-type and IDH2-mutated tumors may not exhibit increased mitochondrial number (32), but shows marked elevation of tCho, which may be due to rapidly proliferating tumor cells (30). Thus increased phospholipid metabolism may not provide definitive identification of IDH1 mutation status, as opposed to a proposal in a pre-clinical 31P MRS study (31). Further study is required to find a potential causal relationship amongst phospholipid metabolism, tCho increase, and 2HG production.
CONCLUSION
2HG is well established as a diagnostic and prognostic imaging biomarker for IDH-mutated gliomas and thus the capability of MRS to analyze this oncometabolite in patients noninvasively has significant relevance in patient care. Diagnostic and prognostic information offered by noninvasive detection of 2HG may significantly impact treatment decision in glioma patients, especially when the tumor is located in the brain region where a biopsy is associated with a risk of permanent neurological injury (e.g., brainstem). This requires precise evaluation of 2HG. Our proposed triple-refocusing method provides a new tool for improved measurement of 2HG with good suppression of adjacent resonances, making it possible to evaluate 2HG in small tumors with low cellularity. Importantly, several therapeutic studies targeting mutated forms of IDH1 and IDH2 (33) are currently underway. Reliable measurement of 2HG may also have significant potential for drug development.
Acknowledgments
This work was supported by a US National Institutes of Health grant CA184584, and by Cancer Prevention Research Institute of Texas grants RP140021-P04 and RP130427. We thank Ms. Jeannie Baxter and Sarah McNeil for study coordination and Dr. Ivan Dimitrov for technical assistance.
References
- 1.Hanahan D, Weinberg RA. Hallmarks of cancer: the next generation. Cell. 2011;144:646–674. doi: 10.1016/j.cell.2011.02.013. [DOI] [PubMed] [Google Scholar]
- 2.DeBerardinis RJ, Thompson CB. Cellular metabolism and disease: what do metabolic outliers teach us? Cell. 2012;148:1132–1144. doi: 10.1016/j.cell.2012.02.032. [DOI] [PMC free article] [PubMed] [Google Scholar]
- 3.Balss J, Meyer J, Mueller W, Korshunov A, Hartmann C, von Deimling A. Analysis of the IDH1 codon 132 mutation in brain tumors. Acta Neuropathol. 2008;116:597–602. doi: 10.1007/s00401-008-0455-2. [DOI] [PubMed] [Google Scholar]
- 4.Parsons DW, Jones S, Zhang X, Lin JC, Leary RJ, Angenendt P, Mankoo P, Carter H, Siu IM, Gallia GL, Olivi A, McLendon R, Rasheed BA, Keir S, Nikolskaya T, Nikolsky Y, Busam DA, Tekleab H, Diaz LA, Jr, Hartigan J, Smith DR, Strausberg RL, Marie SK, Shinjo SM, Yan H, Riggins GJ, Bigner DD, Karchin R, Papadopoulos N, Parmigiani G, Vogelstein B, Velculescu VE, Kinzler KW. An integrated genomic analysis of human glioblastoma multiforme. Science. 2008;321:1807–1812. doi: 10.1126/science.1164382. [DOI] [PMC free article] [PubMed] [Google Scholar]
- 5.Yan H, Parsons DW, Jin G, McLendon R, Rasheed BA, Yuan W, Kos I, Batinic-Haberle I, Jones S, Riggins GJ, Friedman H, Friedman A, Reardon D, Herndon J, Kinzler KW, Velculescu VE, Vogelstein B, Bigner DD. IDH1 and IDH2 mutations in gliomas. N Engl J Med. 2009;360:765–773. doi: 10.1056/NEJMoa0808710. [DOI] [PMC free article] [PubMed] [Google Scholar]
- 6.Dang L, White DW, Gross S, Bennett BD, Bittinger MA, Driggers EM, Fantin VR, Jang HG, Jin S, Keenan MC, Marks KM, Prins RM, Ward PS, Yen KE, Liau LM, Rabinowitz JD, Cantley LC, Thompson CB, Vander Heiden MG, Su SM. Cancer-associated IDH1 mutations produce 2-hydroxyglutarate. Nature. 2009;462:739–744. doi: 10.1038/nature08617. [DOI] [PMC free article] [PubMed] [Google Scholar]
- 7.Figueroa ME, Abdel-Wahab O, Lu C, Ward PS, Patel J, Shih A, Li Y, Bhagwat N, Vasanthakumar A, Fernandez HF, Tallman MS, Sun Z, Wolniak K, Peeters JK, Liu W, Choe SE, Fantin VR, Paietta E, Lowenberg B, Licht JD, Godley LA, Delwel R, Valk PJ, Thompson CB, Levine RL, Melnick A. Leukemic IDH1 and IDH2 mutations result in a hypermethylation phenotype, disrupt TET2 function, and impair hematopoietic differentiation. Cancer Cell. 2010;18:553–567. doi: 10.1016/j.ccr.2010.11.015. [DOI] [PMC free article] [PubMed] [Google Scholar]
- 8.Ward PS, Patel J, Wise DR, Abdel-Wahab O, Bennett BD, Coller HA, Cross JR, Fantin VR, Hedvat CV, Perl AE, Rabinowitz JD, Carroll M, Su SM, Sharp KA, Levine RL, Thompson CB. The common feature of leukemia-associated IDH1 and IDH2 mutations is a neomorphic enzyme activity converting alpha-ketoglutarate to 2-hydroxyglutarate. Cancer Cell. 2010;17:225–234. doi: 10.1016/j.ccr.2010.01.020. [DOI] [PMC free article] [PubMed] [Google Scholar]
- 9.Pope WB, Prins RM, Albert Thomas M, Nagarajan R, Yen KE, Bittinger MA, Salamon N, Chou AP, Yong WH, Soto H, Wilson N, Driggers E, Jang HG, Su SM, Schenkein DP, Lai A, Cloughesy TF, Kornblum HI, Wu H, Fantin VR, Liau LM. Non-invasive detection of 2-hydroxyglutarate and other metabolites in IDH1 mutant glioma patients using magnetic resonance spectroscopy. J Neurooncol. 2012;107:197–205. doi: 10.1007/s11060-011-0737-8. [DOI] [PMC free article] [PubMed] [Google Scholar]
- 10.Choi C, Ganji S, Hulsey K, Madan A, Kovacs Z, Dimitrov I, Zhang S, Pichumani K, Mendelsohn D, Mickey B, Malloy C, Bachoo R, Deberardinis R, Maher E. A comparative study of short- and long-TE 1H MRS at 3 T for in vivo detection of 2-hydroxyglutarate in brain tumors. NMR Biomed. 2013;26:1242–1250. doi: 10.1002/nbm.2943. [DOI] [PMC free article] [PubMed] [Google Scholar]
- 11.Choi C, Ganji SK, Deberardinis RJ, Hatanpaa KJ, Rakheja D, Kovacs Z, Yang XL, Mashimo T, Raisanen JM, Marin-Valencia I, Pascual JM, Madden CJ, Mickey BE, Malloy CR, Bachoo RM, Maher EA. 2-hydroxyglutarate detection by magnetic resonance spectroscopy in IDH-mutated patients with gliomas. Nat Med. 2012;18:624–629. doi: 10.1038/nm.2682. [DOI] [PMC free article] [PubMed] [Google Scholar]
- 12.de la Fuente MI, Young RJ, Rubel J, Rosenblum M, Tisnado J, Briggs S, Arevalo-Perez J, Cross JR, Campos C, Straley K, Zhu D, Dong C, Thomas A, Omuro AA, Nolan CP, Pentsova E, Kaley TJ, Oh JH, Noeske R, Maher E, Choi C, Gutin PH, Holodny AI, Yen K, DeAngelis LM, Mellinghoff IK, Thakur SB. Integration of 2-hydroxyglutarate-proton magnetic resonance spectroscopy into clinical practice for disease monitoring in isocitrate dehydrogenase-mutant glioma. Neuro Oncol. 2016;18:283–290. doi: 10.1093/neuonc/nov307. [DOI] [PMC free article] [PubMed] [Google Scholar]
- 13.Andronesi OC, Kim GS, Gerstner E, Batchelor T, Tzika AA, Fantin VR, Vander Heiden MG, Sorensen AG. Detection of 2-hydroxyglutarate in IDH-mutated glioma patients by in vivo spectral-editing and 2D correlation magnetic resonance spectroscopy. Sci Transl Med. 2012;4:116ra114. doi: 10.1126/scitranslmed.3002693. [DOI] [PMC free article] [PubMed] [Google Scholar]
- 14.Andronesi OC, Loebel F, Bogner W, Marjanska M, Vander Heiden MG, Iafrate AJ, Dietrich J, Batchelor TT, Gerstner ER, Kaelin WG, Chi AS, Rosen BR, Cahill DP. Treatment Response Assessment in IDH-Mutant Glioma Patients by Noninvasive 3D Functional Spectroscopic Mapping of 2-Hydroxyglutarate. Clinical cancer research: an official journal of the American Association for Cancer Research. 2015 doi: 10.1158/1078-0432.CCR-15-0656. [DOI] [PMC free article] [PubMed] [Google Scholar]
- 15.Henning A, Fuchs A, Murdoch JB, Boesiger P. Slice-selective FID acquisition, localized by outer volume suppression (FIDLOVS) for (1)H-MRSI of the human brain at 7 T with minimal signal loss. NMR Biomed. 2009;22:683–696. doi: 10.1002/nbm.1366. [DOI] [PubMed] [Google Scholar]
- 16.Bal D, Gryff-Keller A. 1H and 13C NMR study of 2-hydroxyglutaric acid and its lactone. Magn Reson Chem. 2002;40:533–536. [Google Scholar]
- 17.Govindaraju V, Young K, Maudsley AA. Proton NMR chemical shifts and coupling constants for brain metabolites. NMR Biomed. 2000;13:129–153. doi: 10.1002/1099-1492(200005)13:3<129::aid-nbm619>3.0.co;2-v. [DOI] [PubMed] [Google Scholar]
- 18.Kaiser LG, Young K, Meyerhoff DJ, Mueller SG, Matson GB. A detailed analysis of localized J-difference GABA editing: theoretical and experimental study at 4 T. NMR Biomed. 2008;21:22–32. doi: 10.1002/nbm.1150. [DOI] [PubMed] [Google Scholar]
- 19.Gruetter R. Automatic, localized in vivo adjustment of all first- and second-order shim coils. Magn Reson Med. 1993;29:804–811. doi: 10.1002/mrm.1910290613. [DOI] [PubMed] [Google Scholar]
- 20.Provencher SW. Estimation of metabolite concentrations from localized in vivo proton NMR spectra. Magn Reson Med. 1993;30:672–679. doi: 10.1002/mrm.1910300604. [DOI] [PubMed] [Google Scholar]
- 21.Madan A, Ganji SK, An Z, Choe KS, Pinho MC, Bachoo RM, Maher EM, Choi C. Proton T2 measurement and quantification of lactate in brain tumors by MRS at 3 Tesla in vivo. Magn Reson Med. 2015;73:2094–2099. doi: 10.1002/mrm.25352. [DOI] [PMC free article] [PubMed] [Google Scholar]
- 22.Ganji SK, Banerjee A, Patel AM, Zhao YD, Dimitrov IE, Browning JD, Brown ES, Maher EA, Choi C. T2 measurement of J-coupled metabolites in the human brain at 3T. NMR Biomed. 2012;25:523–529. doi: 10.1002/nbm.1767. [DOI] [PMC free article] [PubMed] [Google Scholar]
- 23.Mlynarik V, Gruber S, Moser E. Proton T1 and T2 relaxation times of human brain metabolites at 3 Tesla. NMR Biomed. 2001;14:325–331. doi: 10.1002/nbm.713. [DOI] [PubMed] [Google Scholar]
- 24.Traber F, Block W, Lamerichs R, Gieseke J, Schild HH. 1H metabolite relaxation times at 3.0 tesla: Measurements of T1 and T2 values in normal brain and determination of regional differences in transverse relaxation. J Magn Reson Imaging. 2004;19:537–545. doi: 10.1002/jmri.20053. [DOI] [PubMed] [Google Scholar]
- 25.Choi C, Ganji SK, Madan A, Hulsey KM, An Z, Zhang S, Pinho MC, DeBerardinis RJ, Bachoo RM, Maher EA. In vivo detection of citrate in brain tumors by 1H magnetic resonance spectroscopy at 3T. Magn Reson Med. 2014;72:316–323. doi: 10.1002/mrm.24946. [DOI] [PMC free article] [PubMed] [Google Scholar]
- 26.Barker PB, Bizzi A, De Stefano N, Gullapalli RP, Lin DDM. Clinical MR Spectroscopy: Techniques and Applications. Cambridge: Cambridge University Press; 2010. [Google Scholar]
- 27.Ganji SK, An Z, Banerjee A, Madan A, Hulsey KM, Choi C. Measurement of regional variation of GABA in the human brain by optimized point-resolved spectroscopy at 7 T in vivo. NMR Biomed. 2014;27:1167–1175. doi: 10.1002/nbm.3170. [DOI] [PMC free article] [PubMed] [Google Scholar]
- 28.Norton WT, Poduslo SE, Suzuki K. Subacute sclerosing leukoencephalitis. II. Chemical studies including abnormal myelin and an abnormal ganglioside pattern. J Neuropathol Exp Neurol. 1966;25:582–597. doi: 10.1097/00005072-196610000-00006. [DOI] [PubMed] [Google Scholar]
- 29.Elkhaled A, Jalbert LE, Phillips JJ, Yoshihara HA, Parvataneni R, Srinivasan R, Bourne G, Berger MS, Chang SM, Cha S, Nelson SJ. Magnetic resonance of 2-hydroxyglutarate in IDH1-mutated low-grade gliomas. Sci Transl Med. 2012;4:116ra115. doi: 10.1126/scitranslmed.3002796. [DOI] [PMC free article] [PubMed] [Google Scholar]
- 30.Howe FA, Opstad KS. 1H MR spectroscopy of brain tumours and masses. NMR Biomed. 2003;16:123–131. doi: 10.1002/nbm.822. [DOI] [PubMed] [Google Scholar]
- 31.Esmaeili M, Hamans BC, Navis AC, van Horssen R, Bathen TF, Gribbestad IS, Leenders WP, Heerschap A. IDH1 R132H mutation generates a distinct phospholipid metabolite profile in glioma. Cancer Res. 2014;74:4898–4907. doi: 10.1158/0008-5472.CAN-14-0008. [DOI] [PubMed] [Google Scholar]
- 32.Navis AC, Niclou SP, Fack F, Stieber D, van Lith S, Verrijp K, Wright A, Stauber J, Tops B, Otte-Holler I, Wevers RA, van Rooij A, Pusch S, von Deimling A, Tigchelaar W, van Noorden CJ, Wesseling P, Leenders WP. Increased mitochondrial activity in a novel IDH1-R132H mutant human oligodendroglioma xenograft model: in situ detection of 2-HG and alpha-KG. Acta neuropathologica communications. 2013;1:18. doi: 10.1186/2051-5960-1-18. [DOI] [PMC free article] [PubMed] [Google Scholar]
- 33.Rohle D, Popovici-Muller J, Palaskas N, Turcan S, Grommes C, Campos C, Tsoi J, Clark O, Oldrini B, Komisopoulou E, Kunii K, Pedraza A, Schalm S, Silverman L, Miller A, Wang F, Yang H, Chen Y, Kernytsky A, Rosenblum MK, Liu W, Biller SA, Su SM, Brennan CW, Chan TA, Graeber TG, Yen KE, Mellinghoff IK. An inhibitor of mutant IDH1 delays growth and promotes differentiation of glioma cells. Science. 2013;340:626–630. doi: 10.1126/science.1236062. [DOI] [PMC free article] [PubMed] [Google Scholar]


