

Abstract
Ferredoxins play an important role as an electron donor in iron–sulfur (Fe–S) cluster biosynthesis. Two ferredoxins, human mitochondrial ferredoxin 1 (FDX1) and human mitochondrial ferredoxin 2 (FDX2), are present in the matrix of human mitochondria. Conflicting results have been reported regarding their respective function in mitochondrial iron–sulfur cluster biogenesis. We report here biophysical studies of the interaction of these two ferredoxins with other proteins involved in mitochondrial iron–sulfur cluster assembly. Results from nuclear magnetic resonance spectroscopy show that both FDX1 and FDX2 (in both their reduced and oxidized states) interact with the protein complex responsible for cluster assembly, which contains cysteine desulfurase (NFS1), ISD11 (also known as LYRM4), and acyl carrier protein (Acp). In all cases, ferredoxin residues close to the Fe–S cluster are involved in the interaction with this complex. Isothermal titration calorimetry results showed that FDX2 binds more tightly to the cysteine desulfurase complex than FDX1 does. The reduced form of each ferredoxin became oxidized in the presence of the cysteine desulfurase complex when l-cysteine was added, leading to its conversion to l-alanine and the generation of sulfide. In an in vitro reaction, the reduced form of each ferredoxin was found to support Fe–S cluster assembly on ISCU; the rate of cluster assembly was faster with FDX2 than with FDX1. Taken together, these results show that both FDX1 and FDX2 can function in Fe–S cluster assembly in vitro.
Iron–sulfur (Fe–S) clusters are versatile protein prosthetic groups that are critical for multiple biological processes, including respiration, electron transfer, DNA replication and repair, cofactor biosynthesis, and gene regulation.1,2 Because of the toxicity of free sulfide and iron ions, Fe–S cluster biosynthesis in cells is a strictly regulated process requiring the participation of many proteins. In eukaryotic cells, the mitochondria are the major sites for Fe–S cluster biogenesis by the ISC (iron–sulfur cluster) machinery.3,4 The eukaryotic mitochondrial ISC system is believed to have originated from the prokaryotic ISC system, and the two systems share many similar features.5,6 Defects in protein components in the human ISC machinery are associated with numerous diseases.7,8
The human mitochondrial ISC machinery can be divided into two steps: (1) the assembly of a cluster on the scaffold protein (ISCU) and (2) the subsequent transfer of the cluster to an acceptor protein.9 The first step involves the scaffold protein ISCU and a protein complex containing cysteine desulfurase (NFS1), a small accessory protein (ISD11, also known as LYRM4),10−12 and acyl carrier protein (ACP).13 Recently, it was discovered that NFS1 and ISD11 co-expressed in Escherichia coli cells form a complex containing the holo-form of E. coli acyl carrier protein (Acp) with the an [Acp]2:[ISD11]2:[NFS1]2 stoichiometry (K. Cai, R. O. Frederick, and M. Tonelli, manuscript submitted for publication). Apparently, E. coli Acp substitutes for human ACP, despite their 40% sequence identity and 60% sequence similarity over 69 common residues. The sulfur atoms in an Fe–S cluster are generated by the transformation of cysteine to alanine catalyzed by the cysteine desulfurase, and the iron ions are donated by an unidentified iron protein.14 A reductant is required for cluster formation, and ferredoxin has been shown to be the electron donor for cluster assembly.15 Frataxin (FXN), whose defects are associated with the neurodegenerative disease Friedreich’s ataxia, is known to be important for this process,16 although its exact role is still under debate. FXN has been proposed to be either an allosteric switch17 or an iron donor18 for Fe–S cluster biogenesis. A recent study showed that FXN stimulates sulfur transfer within the cysteine desulfurase complex when ISCU is present.19 Interestingly, CyaY (the bacterial homologue of FXN) has been shown to be a negative regulator for Fe–S cluster assembly.20 This finding has been explained on the basis of nuclear magnetic resonance (NMR) studies of the E. coli system that showed that the binding of CyaY to the cysteine desulfurase (IscS) displaces the scaffold protein IscU from the IscS:IscU complex or ferredoxin (Fdx) from the IscS:Fdx complex.15,21 However, a recent study has reported that CyaY contributes positively to the maturation of Fe–S proteins in vivo.22
The second step of human ISC machinery is the transfer of nascent Fe–S clusters from ISCU to other acceptor Fe–S proteins facilitated by a mitochondrial HSP70–HSC20 chaperone–cochaperone system.23,24 It has been shown that the cochaperone HSC20 guides Fe–S cluster delivery by binding to a conserved leucine–tyrosine–arginine (LYR) motif present in specific recipient Fe–S proteins or in accessory factors.25
Ferredoxins were among the first Fe–S proteins to be identified and characterized. E. coli ferredoxin (Fdx), which is encoded within the isc operon, is involved in Fe–S cluster biogenesis.26 Recent studies have shown that E. coli Fdx binds directly to cysteine desulfurase IscS and supplies electrons for Fe–S cluster assembly.15,21 Yeast ferredoxin Yah1 has also been shown to be involved in mitochondrial Fe–S cluster biosynthesis.27 Human mitochondria possess two ferredoxins, FDX1 and FDX2. The X-ray structures of the two ferredoxins, Protein Data Bank (PDB) entries 3P1M (FDX1) and 2Y5C (FDX2), are very similar, but the two ferredoxins share only 33% protein sequence identity28 (Figure 1). FDX1 is known to be a versatile electron mediator involved in multiple physiological processes such as donating electrons to cytochrome P450 enzymes as part of steroid hormone biosynthesis and vitamin D metabolism.29 FDX2 is the more recently characterized mitochondrial ferredoxin.28 A deleterious mutation on FDX2 has been shown to be associated with a novel mitochondrial muscle myopathy.30 Conflicting studies regarding the functions of these two ferredoxins have been reported. Shi and co-workers provided evidence that both FDX1 and FDX2 are important for Fe–S cluster biogenesis,31 whereas Sheftel et al. claimed that FDX1 is specifically involved in the production of steroid hormones. FDX2 has been shown to be essential for the biosynthesis of heme A as well as Fe–S cluster assembly.28 It has been shown that FDX1 has a thermal stability higher than that of FDX2 and that FDX2 exhibits a temperature-induced conformational transition, not observed with FDX1, that increases its binding affinity for adrenodoxin reductase.32
Figure 1.

Sequence alignment of ferredoxins and crystal structures of FDX1 and FDX2. (A) Sequence alignment of ferredoxins. Human FDX1 and FDX2 are highlighted in black boxes. Color code: red, conserved; blue, partially conserved. The four conserved cysteine residues that ligate the [2Fe-2S] cluster are indicated by red arrows. The secondary structure prediction is based on the structure of human FDX1. Abbreviations: Xa, Xenopus laevis; Mm, Mus musculus; Bt, Bos taurus; Sc, Saccharomyces cerevisiae; Ec, E. coli; Hs, Homo sapiens; At, Arabidopsis thaliana. (B) Crystal structures of human ox-FDX1 (left, PDB entry 3P1M) and ox-FDX2 (right, PDB entry 2Y5C). The [2Fe-2S] clusters are shown as spheres, and the cysteine ligands are colored red.
Here we demonstrate by NMR spectroscopy that FDX1 and FDX2, in both their oxidized (ox) and reduced (re) states, interact directly with the [Acp]2:[ISD11]2:[NFS1]2 complex. We identified the sites on ox-FDX1 and ox-FDX2 where the [Acp]2:[ISD11]2:[NFS1]2 complex binds, by following the chemical shift perturbations and line broadening of NMR signals from the ferredoxins resulting from the addition of a substoichiometric quantity of the cysteine desulfurase complex. We used isothermal titration calorimetry (ITC) to further quantify the interaction of the two ferredoxins in their oxidized states with the [Acp]2:[ISD11]2:[NFS1]2 complex. The reduced form of either FDX1 or FDX2, when added to a solution of the [Acp]2:[ISD11]2:[NFS1]2 complex and l-cysteine, became oxidized, indicating that both ferredoxins are capable of donating an electron leading to the reduction of S0. We have developed a physiologically relevant Fe–S cluster assembly reaction that utilizes either reduced FDX1 or FDX2 as the reductant in place of DTT. Our results show that reduced FDX1 and reduced FDX2 each support in vitro Fe–S cluster assembly on ISCU; however, the reaction rate was higher in the presence of reduced FDX2 than in the presence of reduced FDX1. Our results show that both FDX1 and FDX2 can function in Fe–S cluster assembly in vitro; however, because FDX2 exhibits both a higher binding affinity for the [Acp]2:[ISD11]2:[NFS1]2 complex and a much higher efficiency in assisting Fe–S cluster assembly, it is more likely to be physiologically relevant in Fe–S cluster assembly.
Methods
Protein Expression and Purification
Information about the proteins used in this study is provided in Table 1, which identifies the vectors and tags used in their production, lists the sizes of the proteins produced, and specifies their amino acid sequences. Published methods23 were used to prepare the protein samples of unlabeled ISCU. The protein targets NFS1, FDX1, and FDX2 were cloned into pE-SUMO (Lifesensors) vectors using polymerase chain reaction (PCR)-based methods. ISD11 was cloned into the pET14b vector (Novagen) containing a noncleavable C-terminal hexahistidine tag.
Table 1. Proteins Studied, Properties, and Production Details.
| abbreviation | name | UniProt entry | residue composition of the protein studied | vector | tag | cleaved? | MW | pI |
|---|---|---|---|---|---|---|---|---|
| FDX1 | H. sapiens ferredoxin 1 | P10109 | 61–184 | pE-SUMO | His6-SUMO- | yes | 13561 | 4.36 |
| FDX2 | H. sapiens ferredoxin 2 | Q6P4F2 | 53–183 | pE-SUMO | His6-SUMO- | yes | 14263 | 4.57 |
| NFS1 | H. sapiens cysteine desulfurase | Q9Y697 | 53–457 | pE-SUMO | His6-SUMO- | yes | 44914 | 6.94 |
| ISD11 | H. sapiens LYRM4 | Q9HD34 | 1–91 | pET14b | -His6 | no | 11581 | 10.73 |
| ISCU | H. sapiens scaffold protein | Q9H1K1 | 35–167 | pE-SUMO | His6-SUMO- | yes | 14386 | 8.99 |
| FXN | H. sapiens frataxin | Q16595 | 81–210 | pE-SUMO | His6-SUMO- | yes | 18826 | 4.72 |
| Acp | E. coli acyl carrier protein | P0A6A8 | 2–78 | none | N/A | N/A | 8508 | 3.98 |
For co-expression and protein production of the [Acp]2:[ISD11]2:[NFS1]2 complex, NFS1-pE-SUMO and ISD11-pET14b were cotransformed into Rosetta2(DE3)pLysS cells and spread onto YT plates with the appropriate antibiotics (50 μg/mL kanamycin, 50 μg/mL ampicillin, and 35 μg/mL chloramphenicol) and grown overnight at 37 °C. E. coli colonies were picked from the plates and grown in 1 mL of YT medium with 1% glucose and appropriate antibiotics for ∼4 h at 37 °C (250 rpm). One milliliter starters were added to overnight MDAG inoculums of 50 mL and grown at 25 °C. The next day, these were used to inoculate 2 L of YT protein production medium. The large-scale cultures usually reached an OD600 of 1–2 after growth for 3–6 h at 37 °C while being shaken at 250 rpm. At that point, 0.4 mM isopropyl β-d-1-thiogalactopyranoside (IPTG) was added to induce overexpression of NFS1 and ISD11. After being incubated for an additional 12 h, the cells were harvested by centrifugation and stored at −80 °C until they were used.
FDX1 and FDX2 were produced as follows. Single colonies containing validated genes for the target proteins were picked from the YT or MDAG plates and grown in 1 mL of YT medium with 1% glucose (supplemented with 50 μg/mL kanamycin and 35 μg/mL chloramphenicol) for 1–3 h at 37 °C while being shaken at 250 rpm and then transferred to 50–100 mL of MDAG medium (with appropriate antibiotics) and grown overnight at 25 °C. For large-scale protein production, the overnight MDAG starter culture was transferred to one of the following media. (1) For the production of unlabeled proteins, 25 mL of MDAG culture was transferred to 1 L of LB liquid medium supplemented with appropriate antibiotics. (2) For the production of [U-15N]FDX1 or -FDX2, 25 mL of MDAG culture was transferred to 1 L of M9 minimal medium containing 1 g/L 15NH4Cl, 3 g/L glucose, and appropriate antibiotics. (3) For the production of [U-13C,U-15N]FDX1 or -FDX2, 25 mL of MDAG culture was transferred to 1 L of M9 minimal medium containing 1 g/L 15NH4Cl and 2 g/L [U-13C]glucose. The cell cultures described above were grown at 37 °C (while being shaken at 250–320 rpm) for 2–5 h until the OD600 reached 1.0–1.5. The temperature was then decreased to 18 °C, and 0.4 mM IPTG, 1 mM l-cysteine, and 0.1 mg/mL ferric ammonium citrate were added to induce the overexpression of the proteins. After being incubated for an additional 12 h, the cells were harvested by centrifugation and stored at −80 °C until they were used.
Buffers
The buffer used for the first immobilized metal affinity chromatography (IMAC) step (1st IMAC buffer) consisted of 20 mM Tris (pH 8), 300–500 mM NaCl, 0.1% NP-40 (Sigma-Aldrich), 1–2 mM β-mercaptoethanol or DTT, 1 mM PMSF, 5–10% glycerol, and 5 mM imidazole. The lysis buffer had this same composition except that it was supplemented with Benzonase (Novagen, Millipore, Billerica, MA) or OmniCleave nuclease (Epicenter, Illumina, Madison, WI), rLysozyme (Novagen), 1 mM phenylmethanesulfonyl fluoride (PMSF) (Sigma-Aldrich), and RNase (Qiagen, Valencia, CA). The buffer used for the second IMAC step (2nd IMAC buffer) had the same composition as the first except that it contained 250 mM imidazole. The SUMO fusion cleavage buffer consisted of 20 mM Tris buffer (pH 8) containing 150 mM NaCl, 2 mM DTT (or β-mercaptoethanol), and 5–10% glycerol. The HN buffer [50 mM HEPES (pH 7.8) and 150 mM NaCl] and HNT buffer [50 mM HEPES (pH 7.8), 150 mM NaCl, and 5 mM TCEP] used in this study were clarified by being passed through a 0.2 μm filter (Millipore) and thoroughly degassed. For anaerobic experiments, the buffers were equilibrated for at least 24 h in an anaerobic chamber (Coy Laboratory, Farmingdale, NY) filled with 95% N2 gas and 5% H2 gas. An O2 detector was installed inside the anaerobic chamber to ensure an O2 concentration of <1 ppm.
Protein Purification
The [Acp]2:[ISD11]2:[NFS1]2 complex, FDX1, and FDX2 were purified as follows. All E. coli cell pastes were quickly thawed at room temperature and then resuspended in 60 mL of lysis buffer. To break open the resuspended cells, we used sonication with a total time of 15 min at 4 °C, with a duty cycle of 2 s on and 4 s off. Cell lysates were clarified by high-speed centrifugation at 25000 rpm for 30 min using a Beckman Coulter centrifuge with a JA 30.5Ti rotor (Beckman Coulter). The clear cell lysate was then treated with 70% (w/v) saturation of (NH4)2SO4 to precipitate total protein. Then the sample was spun at 25000 rpm for 30 min. The protein pellet was resuspended in 30–50 mL of 1st IMAC buffer, and any debris was discarded after a final centrifugation at 25000 rpm for 30 min. The clarified protein solution was loaded onto a Qiagen Ni-NTA Superflow FF or Ni-Sepharose column (GE Amersham Pharmacia, Piscataway, NJ) with IMAC resin at a rate of 1 mL/min. The IMAC column was washed first with ∼10 column volumes of 1st IMAC buffer and second with 5–10 column volumes of wash buffer (1st IMAC buffer and 30 mM imidazole). The target protein was eluted with the 2nd IMAC buffer, and fractions were collected. The His-tagged, N-terminal SUMO fusion protein was treated with 0.5 mg of SUMO protease and extensively dialyzed against the SUMO fusion cleavage buffer. For the purification of FDX1 and FDX2, the SUMO-cleaved sample was loaded onto a freshly equilibrated subtractive IMAC column, which bound the cleaved His-tagged SUMO domain and allowed the cleaved target protein to be eluted. The proteins were further purified by size exclusion chromatography (SEC). For the [Acp]2:[ISD11]2:[NFS1]2 complex, the subtractive IMAC step was omitted and the SUMO-cleaved sample was purified by SEC. The purities of the target protein fractions were assessed by sodium dodecyl sulfate–polyacrylamide gel electrophoresis (SDS-PAGE). As noted elsewhere (K. Cai, R. O. Frederick, and M. Tonelli, manuscript submitted for publication), the presence of Acp in the complex was determined by mass spectrometry, and the stoichiometry of the proteins in the complex was determined by a combination of amino acid analysis and molecular weight estimation from small-angle X-ray scattering (SAXS) data.
FDX1 and FDX2 were reduced by adding a 10-fold excess of sodium dithionite to oxidized FDX1 or FDX2 in an anaerobic chamber (Coy Laboratory). The reduction of FDX1 or FDX2 was monitored by the color change from dark brown to light pink and by recording UV/vis spectra before and after reduction. The sample was dialyzed extensively against anaerobic HN buffer to remove excess sodium dithionite. Apo-FDX1 and -FDX2 were prepared by incubating ox-FDX1 and -FDX2, respectively, with 10% trichloroacetic acid and 10 mM DTT on ice for 10 min, pelleting the sample, rinsing the pellet twice with water, and resuspending the pellet in HNT buffer. The soluble sample was then dialyzed against HNT buffer to remove trichloroacetic acid and further purified by SEC. Mass spectrometry was used to determine the level of 15N isotope labeling.
NMR Spectroscopy
The HNT buffer used for NMR samples contained 8% D2O for the frequency lock. All NMR spectra were recorded on 500 or 750 MHz (1H) Bruker BioSpin (Billerica, MA) or 600, 800, or 900 MHz Varian (Palo Alto, CA) NMR spectrometers equipped with a z-gradient cryogenic probe. All sample temperatures were regulated at 25 °C. NMRPipe was used to process the raw NMR data,33 and NMRFAM-SPARKY34 was utilized to visualize and analyze the processed NMR data.
Samples of 0.3 mM uniformly 15N-labeled apo-FDX1, apo-FDX2, ox-FDX1, and ox-FDX2 were placed in Shigemi NMR tubes (Shigemi Inc.). Samples of 0.3 mM re-FDX1 and re-FDX2 were prepared in an anaerobic chamber and transferred to anaerobic NMR tubes (Wilmad-Labglass) equipped with robust seals. 1H–15N TROSY-HSQC spectra of each sample were collected. To investigate the interaction between the [Acp]2:[ISD11]2:[NFS1]2 complex and ferredoxins, 0.5–1 equiv (subunit) of unlabeled [Acp]2:[ISD11]2:[NFS1]2 was titrated into the uniformly 15N-labeled ferredoxin samples described above, and 1H–15N TROSY-HSQC spectra were collected.
The chemical shift perturbations, ΔδHN (absolute value in parts per million), were calculated with eq 1:
| 1 |
where ΔδH and ΔδN are the chemical shift changes in the 1H and 15N dimensions, respectively.
The backbone signals of [U-13C,U-15N]FDX1 or -FDX2 in its oxidized and reduced states were assigned by collecting and analyzing the following NMR spectra: two-dimensional (2D) 1H–15N HSQC, three-dimensional (3D) HNCA, 3D HNCACB, and 3D CBCA(CO)NH. All 3D spectra were recorded using nonuniform sampling with a sampling rate of 36% and were processed using NESTA35 and NMRPipe. The PINE server36 was used for the automatic assignment of the backbone signals followed by manual correction. The backbone signals from residues close to the Fe–S cluster were not observed because of the paramagnetic effect of the [2Fe-2S] cluster.
Isothermal Titration Calorimetry (ITC) Measurement
A Nano ITC (TA Instrument, Schaumburg, IL) system was used to investigate interactions between the [Acp]2:[ISD11]2:[NFS1]2 complex and ox-FDX1 and ox-FDX2. Proteins were dialyzed overnight in the same HNT buffer. The experiments were conducted at 25 °C. The syringe contained 0.8 mM [Acp]2:[ISD11]2:[NFS1]2, and the sample cell (169 μL) contained 0.03 mM ox-FDX1 or 0.09 mM ox-FDX2. Twenty aliquots of 2.5 μM [Acp]2:[ISD11]2:[NFS1]2 were injected into the sample cell, and the heat generated was measured. Processing and fitting of ITC data were conducted using NanoAnalyse Software (TA Instrument).
Electron Transfer Experiment, Cysteine Desulfurase Assay, and in Vitro Fe–S Cluster Assembly Reaction
The protein samples used in electron transfer and in vitro cysteine desulfurase assay and Fe–S cluster reconstitution experiments were prepared in an anaerobic chamber (Coy Laboratory) with samples buffer-exchanged extensively with anaerobic HN buffer prior to the experiments. The reaction volumes in all the experiments were kept to 1 mL. A UV-1700 UV/visible spectrophotometer (Shimadzu, Kyoto, Japan) with a temperature control unit was used to collect the spectra, and UVProbe version 2.21 (Shimadzu) was used to collect and analyze the data.
Electron transfer from re-FDX1 or re-FDX2 to the [Acp]2:[ISD11]2:[NFS1]2 complex was monitored as follows. re-FDX1 or re-FDX2 (25 μM) was mixed with 25 μM [Acp]2:[ISD11]2:[NFS1]2, and 125 μM l-cysteine was added to initiate the reaction. Samples were then transferred to 1 cm path-length quartz cuvettes, sealed with rubber septa, and UV/vis spectra were collected at 25 °C. Control experiments without l-cysteine were also conducted.
The cysteine desulfurase assay reaction mixtures (300 μL in HN buffer) contained 1 μM [Acp]2:[ISD11]2:[NFS1]2 and 50 μM l-cysteine. The reductant was 10 μM re-FDX1, 10 μM re-FDX2, 10 μM DTT, or 1 mM DTT. The l-cysteine was added last to initiate the reaction. One or more of the following components were added to assess their effects on sulfide production: 10 μM ISCU, 10 μM FXN, and 50 μM Fe2(NH4)2(SO4)2. After anaerobic incubation for 20 min at room temperature, the reaction mixture was diluted to 800 μL, and 100 μL of 20 mM N,N-dimethyl-p-phenylenediamine in 7.2 M HCl and 100 μL of 30 mM FeCl3 in 1.2 M HCl were added to quench the reaction and convert sulfide to methylene blue. The quenched reaction mixture was incubated for 15 min at room temperature, and then the absorbance at 670 nm was measured and used to estimate the amount of sulfide by comparison to a standard curve obtained from known concentrations of Na2S.
The in vitro Fe–S cluster reconstitution assays were performed as follows. Reaction mixtures (1 mL) prepared in the anaerobic chamber contained 25 μM re-FDX1 or re-FDX2, 0.5 μM [Acp]2:[ISD11]2:[NFS1]2, 25 μM ISCU, and 125 μM Fe2(NH4)2(SO4)2. l-cysteine (final concentration of 125 μM) was added to initiate the experiment. Samples were then transferred to 1 cm path-length quartz cuvettes, sealed with rubber septa, and UV/vis spectra were collected at 25 °C. Control experiments were conducted without l-cysteine.
Results
Biophysical Characterization of FDX1 and FDX2 and Their Apo Forms by NMR
We prepared uniformly 15N-labeled samples of FDX1 and FDX2 and collected 1H–15N TROSY-HSQC spectra of these proteins in both their oxidized and reduced states. Spectra of ox-FDX1 and re-FDX1 are shown in the left and middle panels of Figure 2A, respectively, and spectra of ox-FDX2 and re-FDX2 are shown in the left and middle panels of Figure 2B, respectively. The difference in redox state resulted in significant changes in the chemical shifts (CS) and line widths of the 1H–15N cross peaks. Careful analysis of the CS perturbations and peak broadenings revealed that, for both FDX1 and FDX2, most affected residues are located close to the Fe–S cluster; more peaks from FDX1 disappeared (Figure 3A) than from FDX2 (Figure 3C). When mapped onto the structures of FDX1 and FDX2, these CS perturbations and peak broadenings showed similar patterns (Figure 3BD). The hyperfine 1H NMR signals of FDX1 and FDX2 in both their oxidized and reduced states were found to be very similar, indicating similar patterns of electron delocalization in both ferredoxins (Figure S1).
Figure 2.

750 MHz (1H) 2D 1H–15N TROSY-HSQC NMR spectra of different states of FXD1 and FDX2. (A) FDX1 in its oxidized (left), reduced (middle), and apo (right) states. (B) FDX2 in its oxidized (left), reduced (middle), and apo (right) states.
Figure 3.

Redox state differences in the backbone chemical shifts of FDX1 and FDX2. 1H and 15N chemical shifts were obtained from assigned 1H–15N TROSY-HSQC spectra acquired at 750 MHz of uniformly 15N-labeled FDX1 and FDX2 before (oxidized) and after reduction with sodium dithionite. The differences in these chemical shifts (ΔδH and ΔδN) were converted to chemical shift perturbations (ΔδHN) as described in Methods. (A) ΔδHN values for FDX1 plotted as a function of residue number. The red ovals denote residues whose signals were broadened beyond detection. (B) ΔδHN results from panel A mapped onto the structure of FDX1 (PDB entry 3P1M). Color code: green, not significantly affected (ΔδNH < 0.1 ppm); blue, significant chemical shift changes (ΔδNH > 0.1 ppm); red, severe line broadening; black, no assignments. (C) ΔδHN values for FDX2 plotted as a function of residue number. The red ovals denote residues whose signals were broadened beyond detection. (D) ΔδHN results from panel C mapped onto the structure of FDX2 (PDB entry 2Y5C). Color code: green, not significantly affected (ΔδNH < 0.05 ppm); blue, significant chemical shift changes (ΔδNH > 0.05 ppm); red, severe line broadening; black, no assignments.
We also prepared uniformly 15N-labeled apo-FDX1 and apo-FDX2 by removing the Fe–S cluster from each protein. The 1H–15N TROSY-HSQC spectra of both apoproteins (Figure 2A,B, right panels) showed the reduced level of dispersion of 1H NMR signals characteristic of a partially unfolded protein; this result suggests the importance of the Fe–S cluster in stabilizing the protein structure.
Oxidized and Reduced Forms of FDX1 and FDX2 Interact Directly with the Cysteine Desulfurase–ISD11 Complex
It has been shown that E. coli ferredoxin (Fdx) interacts directly with E. coli cysteine desulfurase (IscS)15,21 and that reduced Fdx donates an electron for Fe–S cluster biosynthesis.15 It is thus of interest to perform analogous NMR investigations of the interactions of FDX1 and FDX2 with the human cysteine desulfurase complex.
We co-expressed the genes encoding human NFS1 and ISD11 in E. coli cells and isolated and purified the [Acp]2:[ISD11]2:[NFS1]2 complex. Upon purification, the complex exhibited a yellow color because of the presence of the bound cofactor, pyridoxal phosphate (PLP).
We employed NMR titration to investigate the interaction between the [Acp]2:[ISD11]2:[NFS1]2 complex and the ferredoxins. Aliquots (0.20–1.0 subunit equivalent) of the unlabeled [Acp]2:[ISD11]2:[NFS1]2 complex were titrated into each of the [U-15N]ferredoxins, and 1H–15N TROSY-HSQC spectra were recorded before and after the addition of each aliquot.
The addition of one subunit equivalent of unlabeled [Acp]2:[ISD11]2:[NFS1]2 complex led to severe broadening of 1H–15N TROSY-HSQC signals from either [U-15N]ox-FDX1 (Figure 4A) or [U-15N]re-FDX1 (Figure 4B). However, the addition of substoichiometric amounts of the [Acp]2:[ISD11]2:[NFS1]2 complex to [U-15N]ox-FDX1 resulted in CS perturbations (Figure 4C) that allowed the identification of the regions of FDX1 that interact with the [Acp]2:[ISD11]2:[NFS1]2 complex (Figure 4D). The backbone 1H–15N signals of FDX1 residues F11, N13, R14, L57–I63, I71–L90, L96, T97, and N102 were significantly shifted or broadened as a result of binding to [Acp]2:[ISD11]2:[NFS1]2. Most of these residues are close to the [2Fe-2S] cluster. The progressive CS changes of signals from FDX1 residues A81, L84, D76, and D79 as a function of added [Acp]2:[ISD11]2:[NFS1]2 concentration (Figure 5A) are shown in Figure 5B.
Figure 4.

NMR evidence showing that both ox-FDX1 and re-FDX1 interact with the cysteine desulfurase complex ([Acp]2:[ISD11]2:[NFS1]2). (A) Left, 1H–15N TROSY-HSQC NMR spectrum of [U-15N]ox-FDX1; right, 1H–15N TROSY-HSQC spectrum of [U-15N]ox-FDX1 following addition of 1 subunit equivalent of unlabeled [Acp]2:[ISD11]2:[NFS1]2. (B) Left, 1H–15N TROSY-HSQC NMR spectrum of [U-15N]re-FDX1; right, 1H–15N TROSY-HSQC spectrum of [U-15N]re-FDX1 following the addition of 1 subunit equivalent of unlabeled [Acp]2:[ISD11]2:[NFS1]2. (C) CS perturbation of the 1H–15N signals (ΔδNH) of [U-15N]ox-FDX1 resulting from the interaction with [Acp]2:[ISD11]2:[NFS1]2. The red ovals denote the residues whose signals were broadened beyond detection. (D) CS perturbation results from panel C mapped onto the structure of FDX1 (PDB entry 3P1M). Color code: green, not significantly affected (ΔδNH < 0.03 ppm); blue, significant chemical shift changes (ΔδNH > 0.03 ppm); red, severe line broadening; black, no assignments. All NMR data were collected at 750 MHz (1H).
Figure 5.

Identification of residues of FDX1 that interact with the [Acp]2:[ISD11]2:[NFS1]2 complex. (A) Left, 1H–15N TROSY-HSQC NMR spectrum of [U-15N]ox-FDX1; middle, 1H–15N TROSY-HSQC spectrum of [U-15N]ox-FDX1 following the addition of 0.4 subunit equivalent of unlabeled [Acp]2:[ISD11]2:[NFS1]2; right, overlay of the left and middle panels. (B) Signals from residues D76, D79, A81, and L84 as a function of added [Acp]2:[ISD11]2:[NFS1]2: 0 (red), 0.2 (magenta), 0.4 (blue), and 0.8 (green) subunit equivalent. NMR spectra were acquired at 750 MHz (1H).
The addition of one subunit equivalent of unlabeled [Acp]2:[ISD11]2:[NFS1]2 led to severe broadening of 1H–15N TROSY-HSQC signals from either [U-15N]ox-FDX2 or [U-15N]re-FDX2 (Figure 6A,B). The addition of a substoichiometric amount of unlabeled [Acp]2:[ISD11]2:[NFS1]2 to [U-15N]ox-FDX2 led to the shifting or broadening of signals from the following residues: L38–I40, L50, Y64, and A81–L97 (Figure 6C). As with FDX1, most of these residues correspond to the regions close to the [2Fe-2S] cluster (Figure 6D). The progressive CS changes of signals from FDX2 residues E81, E83, L91, and Q92 as the result of added [Acp]2:[ISD11]2:[NFS1]2 (Figure 7A) are shown in Figure 7B.
Figure 6.

NMR evidence showing that both ox-FDX2 and re-FDX2 interact with the cysteine desulfurase complex ([Acp]2:[ISD11]2:[NFS1]2). (A) Left, 1H–15N TROSY-HSQC NMR spectrum of [U-15N]ox-FDX2; right, 1H–15N TROSY-HSQC spectrum of [U-15N]ox-FDX2 following addition of 1 subunit equivalent of unlabeled [Acp]2:[ISD11]2:[NFS1]2. (B) Left, 1H–15N TROSY-HSQC NMR spectra of [U-15N]re-FDX2; right, 1H–15N TROSY-HSQC spectrum of [U-15N]re-FDX2 following addition of 1 subunit equivalent of unlabeled [Acp]2:[ISD11]2:[NFS1]2. (C) CS perturbation of the 1H–15N signals (ΔδNH) of [U-15N]ox-FDX2 resulting from the interaction with [Acp]2:[ISD11]2:[NFS1]2. The red ovals denote the residues whose signals were broadened beyond detection. (D) CS perturbation results from panel C mapped onto the structure of FDX2 (PDB entry 2Y5C). Color code: green, not significantly affected (ΔδNH < 0.03 ppm); blue, significant chemical shift changes (ΔδNH > 0.03 ppm); red, severe line broadening; black, no assignments. All NMR data were collected at 750 MHz (1H).
Figure 7.

Identification of residues of FDX2 that interact with the [Acp]2:[ISD11]2:[NFS1]2 complex. (A) Left, 1H–15N TROSY-HSQC NMR spectrum of [U-15N]ox-FDX2; middle, 1H–15N TROSY-HSQC spectrum of [U-15N]ox-FDX2 following the addition of 0.4 subunit equivalent of unlabeled [Acp]2:[ISD11]2:[NFS1]2; right, overlay of the left and middle panels. (B) Signals from residues E81, E83, L91, and Q92 as a function of added [Acp]2:[ISD11]2:[NFS1]2: 0 (red), 0.2 (magenta), 0.4 (blue), and 0.8 (green) subunit equivalent. NMR spectra were acquired at 750 MHz (1H).
No interactions were found between apo-FDX1 or apo-FDX2 and [Acp]2:[ISD11]2:[NFS1]2 (data not shown).
We used isothermal titration calorimetry (ITC) to quantify the nature of the interactions between the highly stable [Acp]2:[ISD11]2:[NFS1]2 complex and the two more weakly binding human ferredoxins. Titration of the [Acp]2:[ISD11]2:[NFS1]2 complex with ox-FDX1 or ox-FDX2 resulted in exothermic binding that could be fitted to a 1:1 binding model and yielded Kd values of 41.7 ± 2.6 and 14.9 ± 1.2 μM for FDX1 and FDX2, respectively (Figure 8). The ITC experiments indicate that ox-FDX1 has a binding affinity for the [Acp]2:[ISD11]2:[NFS1]2 complex lower than that of ox-FDX2. Attempts to perform ITC with reduced ferredoxins failed because the ferredoxins became oxidized by air during the course of the experiment.
Figure 8.

ITC analysis of the interaction of the [Acp]2:[ISD11]2:[NFS1]2 complex with (A) ox-FDX1 and (B) ox-FDX2. The top panels show peaks indicating heat released after each injection of the [Acp]2:[ISD11]2:[NFS1]2 complex into the solution of ox-FDX1 or ox-FDX2. The bottom panels show data points fitted to a single binding constant to yield thermodynamic parameters.
Reduced FDX1 and FDX2 Each Donate Electrons to the Cysteine Desulfurase Complex in Vitro and Facilitate Iron–Sulfur Cluster Assembly
To investigate the physiological relevance of the interactions between the [Acp]2:[ISD11]2:[NFS1]2 complex and ferredoxins, we took advantage of the distinct UV/vis spectra of oxidized and reduced human ferredoxins (Figure S2) to determine whether electrons can be transferred from the reduced ferredoxins to the [Acp]2:[ISD11]2:[NFS1]2 complex. The UV/vis spectra of re-FDX1 and re-FDX2 did not change over the time period of 30 min following the addition of one subunit equivalent of the [Acp]2:[ISD11]2:[NFS1]2 complex (Figure 9A,B, black traces), indicating that both FDX1 and FDX2 remained reduced under this condition. The addition of 5 equiv of l-cysteine to the reaction mixtures mentioned above led to the oxidation of re-FDX1 (Figure 9A, blue traces) and re-FDX2 (Figure 9B, red traces). The results indicate that both re-FDX1 and re-FDX2 can donate electrons to the product of the human cysteine desulfurase reaction.
Figure 9.
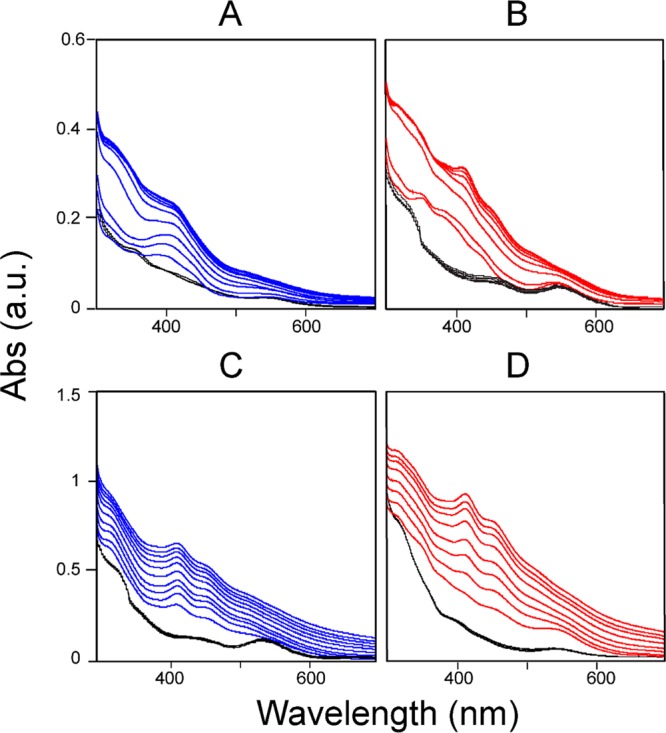
UV/vis spectra taken to monitor the oxidation state of ferredoxins under different conditions. (A) Results for FDX1: (blue lines) UV/vis spectra taken every 5 min for 60 min of the reaction mixture containing 25 μM re-FDX1 and 25 μM [Acp]2:[ISD11]2:[NFS1]2 following the addition of a 5-fold excess of l-cysteine and (black lines) control reaction without l-cysteine, with UV/vis spectra taken every 5 min for 30 min. (B) Results for FDX2: (red lines) UV/vis spectra taken every 5 min for 60 min of the reaction mixture containing 25 μM re-FDX2 and 25 μM [Acp]2:[ISD11]2:[NFS1]2 following the addition of a 5-fold excess of l-cysteine and (black lines) control reaction without l-cysteine, with UV/vis spectra taken every 5 min for 30 min. (C) Results for FDX1 in the presence of ISCU: (blue lines) UV/vis spectra taken every 5 min for 50 min of the reaction mixture containing 25 μM re-FDX1 and 25 μM ISCU in the presence of a catalytic quantity (0.02 subunit equivalent) of [Acp]2:[ISD11]2:[NFS1]2 and 5 equiv of ferrous ammonium sulfate following the addition of a 5-fold excess of l-cysteine and (black lines) control reaction without l-cysteine, with UV/vis spectra taken every 5 min for 30 min. (D) Results for FDX2 in the presence of ISCU: (red lines) UV/vis spectra taken every 5 min for 50 min of the reaction mixture containing 25 μM re-FDX2 and 25 μM ISCU in the presence of a catalytic quantity (0.02 subunit equivalent) of [Acp]2:[ISD11]2:[NFS1]2 and 5 equiv of ferrous ammonium sulfate following the addition of a 5-fold excess of l-cysteine and (black lines) control reaction without l-cysteine, with UV/vis spectra taken every 5 min for 30 min. The results show that neither reduced ferredoxin is oxidized by the reaction mixture when l-cysteine is absent. The results also demonstrate that both re-FDX1 and re-FDX2 can transfer an electron to [Acp]2:[ISD11]2:[NFS1]2 in the presence of l-cysteine and that both ferredoxins facilitate Fe–S cluster assembly on the scaffold protein ISCU.
To determine whether FDX1 and FDX2 can donate the electrons required for Fe–S cluster assembly on human ISCU, we performed an in vitro Fe–S cluster assembly reaction. The reaction mixture contained ISCU, a catalytic quantity of [Acp]2:[ISD11]2:[NFS1]2 (0.02 subunit equivalent), 5 equiv of ferrous ammonium sulfate, and 1 equiv of either re-FDX1 or re-FDX2 as the reductant. The UV/vis spectra of re-FDX1 or re-FDX2 mixed with ISCU, ferrous ammonium sulfate, and [Acp]2:[ISD11]2:[NFS1]2 remained unchanged over the time period of 30 min (Figure 9C,D, black traces). With both re-FDX1 and re-FDX2, following the addition of 5 equiv of l-cysteine, we observed a progressive increase in the absorbance at 400 and 456 nm (Figure 9C,D) that was indicative of Fe–S cluster formation and the oxidation of reduced ferredoxin. Notably, the absorbance at 400 and 456 nm increased significantly more rapidly in the reaction mixture containing re-FDX2 (Figure 9D, red traces) than in the reaction mixture containing re-FDX1 (Figure 9C, blue traces), indicating that FDX2 is more efficient in donating an electron to assist in vitro Fe–S cluster assembly. The reaction mixtures were subjected to anion-exchange FPLC to isolate holo-ISCU for analysis by UV/vis spectroscopy, which confirmed that the reactions involving both FDX1 and FDX2 led to the formation of holo-ISCU (Figure S3).
Both FDX1 and FDX2 Stimulate Cysteine Desulfurase Activity, and Both Serve as Reductants for Fe–S Cluster Assembly
We explored the effect of three different reductants (re-FDX1, re-FDX2, and DTT) on the cysteine desulfurase activity of [Acp]2:[ISD11]2:[NFS1]2 as monitored by sulfide production. The control reactions without [Acp]2:[ISD11]2:[NFS1]2 or a reductant (Figure 10A, black bars) produced little sulfide. With excess re-FDX1 (10 times the amount of [Acp]2:[ISD11]2:[NFS1]2) as the reducing agent (Figure 10A, blue bars), the addition of either FXN or ISCU only slightly stimulated the cysteine desulfurase activity of [Acp]2:[ISD11]2:[NFS1]2; however, the concomitant addition of ISCU and FXN led to a significant stimulation of cysteine desulfurase activity. With excess re-FDX2 (10 times the amount of [Acp]2:[ISD11]2:[NFS1]2) as the reducing agent (Figure 10A, red bars), the addition of ISCU alone led to a slight stimulation of cysteine desulfurase activity, whereas the addition of FXN alone had no effect; however, the concomitant addition of ISCU and FXN led to a significant stimulation of cysteine desulfurase activity (Figure 10A). In the reactions with excess DTT (10 μM) as the reducing agent (Figure 9B), FXN alone slightly stimulated the cysteine desulfurase activity, whereas ISCU alone depressed the cysteine desulfurase activity of [Acp]2:[ISD11]2:[NFS1]2; however, the addition of both FXN and ISCU increased in the cysteine desulfurase activity by a factor of ∼2. The large increase in the level of production of sulfide when the DTT concentration was increased from 10 μM to 1 mM suggests that the reaction was limited by the amount of reductant. The presence of added Fe2+ had an opposite effect on the cysteine desulfurase activity depending on the nature of the reductant. When either re-FDX1 or re-FDX2 was the reductant, the addition of Fe2+ depressed cysteine desulfurase activity; however, when DTT was the reductant, the addition of Fe2+ increased cysteine desulfurase activity.
Figure 10.

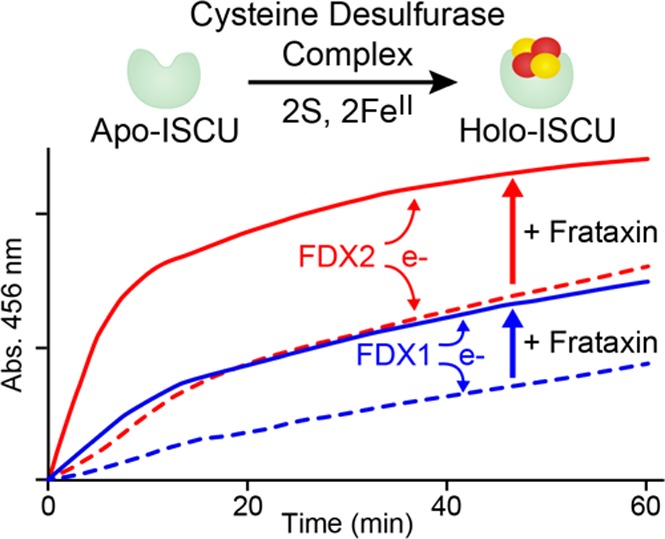
Cysteine desulfurase activities and in vitro Fe–S cluster assembly rates of different reaction mixtures. (A) Cysteine desulfurase activity assay of [Acp]2:[ISD11]2:[NFS1]2 with either re-FDX1 or re-FDX2 as the reducing agent. The composition of each reaction mixture is denoted below the x-axis. The components of the 300 μL reaction mixture were [Acp]2:[ISD11]2:[NFS1]2 (1 μM), re-FDX1 (10 μM), re-FDX2 (10 μM), FXN (10 μM), ISCU (10 μM), Fe2(NH4)2(SO4)2 (50 μM), and l-cysteine (50 μM) added last to initiate the reaction. (B) Cysteine desulfurase activity assay of [Acp]2:[ISD11]2:[NFS1]2 using DTT as the reducing agent. The composition of each reaction mixture is denoted below the x-axis. The components of the reaction mixture were [Acp]2:[ISD11]2:[NFS1]2 (300 μL), DTT (as shown in the figure), FXN (10 μM), ISCU (10 μM), Fe2(NH4)2(SO4)2 (50 μM), and l-cysteine (50 μM) added last to initiate the reaction. (C) Time course of the in vitro Fe–S cluster assembly reaction as monitored by absorbance at 456 nm. The reaction mixture contained [Acp]2:[ISD11]2:[NFS1]2 (0.5 μM), ISCU (25 μM), Fe2(NH4)2(SO4)2 (125 μM), either re-FDX1 (25 μM) or re-FDX2 (25 μM), and l-cysteine (125 μM) added last to initiate the reaction. FXN, if present, was at a concentration of 25 μM. Reaction with re-FDX1 as the reducing agent, with (solid blue line) or without (dashed blue line) FXN. Reaction with re-FDX2 as the reducing agent, with (solid red line) or without (dashed red line) FXN.
We then used the in vitro Fe–S cluster assembly reaction to investigate the effect of FXN on cluster assembly catalyzed by [Acp]2:[ISD11]2:[NFS1]2 with re-FDX1 or re-FDX2 as the reductant. With either reductant, the presence of FXN accelerated the cluster assembly as monitored by the absorbance at 456 nm (Figure 10C). Notably, cluster assembly was faster with re-FDX2, with or without FXN, than with re-FDX1 as the reductant.
Discussion
Human mitochondria contain two ferredoxins (FDX1 and FDX2) whose physiological functions have been subject to debate.28,31 We have employed various biophysical techniques and functional assays to elucidate the properties of the two ferredoxins and to determine their interactions with other protein components in human mitochondrial Fe–S cluster biosynthesis. NMR titration data revealed that both FDX1 and FDX2, in their oxidized and reduced states, interact directly with the [Acp]2:[ISD11]2:[NFS1]2 complex (Figures 4 and 6). ITC results revealed that ox-FDX2 binds [Acp]2:[ISD11]2:[NFS1]2 much more tightly (Kd = 14.9 ± 1.2 μM) than ox-FDX1 does (Kd = 41.7 ± 2.6 μM) (Figure 8).
NMR chemical shift changes and peak broadenings allowed us to identify sites on ox-FDX1 and ox-FDX2 that interact with the cysteine desulfurase complex. For both ox-FDX1 and ox-FDX2, most of these sites map to regions close to the Fe–S cluster (Figures 4 and 6) and include residues in helix α3 and strand β4, which are highly conserved among ferredoxins (Figure 1). Interestingly, helix α3 on FDX1 has also been shown to interact with ferredoxin reductase and cytochrome P450;37 thus, this conserved region appears to interact with multiple protein partners.38 This result suggests that the oxidized ferredoxins must dissociate from the cysteine desulfurase to be reduced by ferredoxin reductase. Although the regions on ox-FDX1 and ox-FDX2 affected by [Acp]2:[ISD11]2:[NFS1]2 binding are similar, differences exist, particularly with regard to residues in strand β2 and helices α1 and α2 (Figures 4 and 6). These regions are less conserved among ferredoxins (Figure 1), and they also exhibit the largest geometric deviation in the superimposed 3D structures of ox-FDX1 and ox-FDX2. Differences in these regions may explain the observed differences between FDX1 and FDX2 in their binding affinity for [Acp]2:[ISD11]2:[NFS1]2 and efficiency in electron donation.
Our in vitro Fe–S cluster assembly assays showed that both reduced FDX1 and FDX2 were capable of donating electrons to [Acp]2:[ISD11]2:[NFS1]2 (Figure 9) and that both facilitate Fe–S cluster assembly (Figure 10C).
In conclusion, our experimental results indicate that both human mitochondrial ferredoxins (FDX1 and FDX2) can donate electrons to [Acp]2:[ISD11]2:[NFS1]2 and assist Fe–S cluster assembly in vitro; however, FDX2 is more efficient than FDX1 in these processes. The situation in vivo may depend on other factors, including the relative concentrations of the two ferredoxins.
Acknowledgments
We thank members of Center of Eukaryotic Structural Genomics and Mitochondrial Protein Partnership for their support. NMR data were collected at the National Magnetic Resonance Facility at Madison.
Glossary
Abbreviations
- ACP
holo-form of human acyl carrier protein
- Acp
holo-form of E. coli acyl carrier protein
- apo-FDX
ferredoxin devoid of an Fe–S cluster
- ox-FDX
oxidized ferredoxin
- re-FDX
reduced ferredoxin
- CS
chemical shift
- CyaY
bacterial frataxin (E. coli)
- DTT
dithiothreitol
- Fdx
ferredoxin (E. coli)
- FDX1
ferredoxin 1 (human mitochondrial)
- FDX2
ferredoxin 2 (human mitochondrial)
- Fe–S
iron–sulfur
- HSC20
molecular cochaperone belonging to the heat shock protein 40 family (human mitochondrial)
- FXN
human frataxin
- HSP70
molecular chaperone belonging to the heat shock protein 70 family (human mitochondrial)
- HSQC
heteronuclear single-quantum correlation
- ISC
iron–sulfur cluster
- IscS
cysteine desulfurase (E. coli)
- IscU
scaffold protein for Fe–S cluster assembly (E. coli)
- ISCU
scaffold protein for Fe–S cluster assembly (human mitochondrial)
- ISD11
small protein that binds tightly to NFS1 and is required for its activity
- ITC
isothermal titration calorimetry
- NFS1
cysteine desulfurase (human mitochondrial)
- ox-FDX
FDX in its oxidized state
- re-FDX
FDX in its reduced state
- SEC
size exclusion chromatography
- TROSY
transverse relaxation optimized spectroscopy
- [U-15N]
uniform labeling with the stable isotope 15N
- Yah1
ferredoxin (yeast).
Supporting Information Available
The Supporting Information is available free of charge on the ACS Publications website at DOI: 10.1021/acs.biochem.6b00447.
Figures S1–S3 (PDF)
Supported by National Institutes of Health Grants U01GM94622 (in support of the Mitochondrial Protein Partnership) and P41GM103399 (in support of the National Magnetic Resonance Facility at Madison).
The authors declare no competing financial interest.
Supplementary Material
References
- Py B.; Barras F. (2010) Building Fe-S proteins: bacterial strategies. Nat. Rev. Microbiol. 8, 436–446. 10.1038/nrmicro2356. [DOI] [PubMed] [Google Scholar]
- Johnson D. C.; Dean D. R.; Smith A. D.; Johnson M. K. (2005) Structure, function, and formation of biological iron-sulfur clusters. Annu. Rev. Biochem. 74, 247–281. 10.1146/annurev.biochem.74.082803.133518. [DOI] [PubMed] [Google Scholar]
- Lill R. (2009) Function and biogenesis of iron-sulphur proteins. Nature 460, 831–838. 10.1038/nature08301. [DOI] [PubMed] [Google Scholar]
- Lill R.; Hoffmann B.; Molik S.; Pierik A. J.; Rietzschel N.; Stehling O.; Uzarska M. A.; Webert H.; Wilbrecht C.; Muhlenhoff U. (2012) The role of mitochondria in cellular iron-sulfur protein biogenesis and iron metabolism. Biochim. Biophys. Acta, Mol. Cell Res. 1823, 1491–1508. 10.1016/j.bbamcr.2012.05.009. [DOI] [PubMed] [Google Scholar]
- Lill R.; Muhlenhoff U. (2006) Iron-sulfur protein biogenesis in eukaryotes: components and mechanisms. Annu. Rev. Cell Dev. Biol. 22, 457–86. 10.1146/annurev.cellbio.22.010305.104538. [DOI] [PubMed] [Google Scholar]
- Kim J. H.; Bothe J. R.; Alderson T. R.; Markley J. L. (2015) Tangled web of interactions among proteins involved in iron-sulfur cluster assembly as unraveled by NMR, SAXS, chemical crosslinking, and functional studies. Biochim. Biophys. Acta, Mol. Cell Res. 1853, 1416–1428. 10.1016/j.bbamcr.2014.11.020. [DOI] [PMC free article] [PubMed] [Google Scholar]
- Stehling O.; Wilbrecht C.; Lill R. (2014) Mitochondrial iron-sulfur protein biogenesis and human disease. Biochimie 100, 61–77. 10.1016/j.biochi.2014.01.010. [DOI] [PubMed] [Google Scholar]
- Rouault T. A.; Tong W. H. (2008) Iron-sulfur cluster biogenesis and human disease. Trends Genet. 24, 398–407. 10.1016/j.tig.2008.05.008. [DOI] [PMC free article] [PubMed] [Google Scholar]
- Rouault T. A. (2015) Mammalian iron-sulphur proteins: novel insights into biogenesis and function. Nat. Rev. Mol. Cell Biol. 16, 45–55. 10.1038/nrm3909. [DOI] [PubMed] [Google Scholar]
- Adam A. C.; BornhÖvd C.; Prokisch H.; Neupert W.; Hell K. (2006) The Nfs1 interacting protein Isd11 has an essential role in Fe/S cluster biogenesis in mitochondria. EMBO J. 25, 174–183. 10.1038/sj.emboj.7600905. [DOI] [PMC free article] [PubMed] [Google Scholar]
- Shi Y.; Ghosh M. C.; Tong W. H.; Rouault T. A. (2009) Human ISD11 is essential for both iron-sulfur cluster assembly and maintenance of normal cellular iron homeostasis. Hum. Mol. Genet. 18, 3014–3025. 10.1093/hmg/ddp239. [DOI] [PMC free article] [PubMed] [Google Scholar]
- Tong W. H.; Rouault T. A. (2006) Functions of mitochondrial ISCU and cytosolic ISCU in mammalian iron-sulfur cluster biogenesis and iron homeostasis. Cell Metab. 3, 199–210. 10.1016/j.cmet.2006.02.003. [DOI] [PubMed] [Google Scholar]
- Van Vranken J. G.; Jeong M. Y.; Wei P.; Chen Y. C.; Gygi S. P.; Winge D. R.; Rutter J. (2016) The mitochondrial acyl carrier protein (ACP) coordinates mitochondrial fatty acid synthesis with iron sulfur cluster biogenesis. eLife 5, e17828. 10.7554/eLife.17828. [DOI] [PMC free article] [PubMed] [Google Scholar]
- Maio N.; Rouault T. A. (2015) Iron-sulfur cluster biogenesis in mammalian cells: New insights into the molecular mechanisms of cluster delivery. Biochim. Biophys. Acta, Mol. Cell Res. 1853, 1493–1512. 10.1016/j.bbamcr.2014.09.009. [DOI] [PMC free article] [PubMed] [Google Scholar]
- Kim J. H.; Frederick R. O.; Reinen N. M.; Troupis A. T.; Markley J. L. (2013) [2Fe-2S]-Ferredoxin binds directly to cysteine desulfurase and supplies an electron for iron-sulfur cluster assembly but is displaced by the scaffold protein or bacterial frataxin. J. Am. Chem. Soc. 135, 8117–8120. 10.1021/ja401950a. [DOI] [PMC free article] [PubMed] [Google Scholar]
- Vaubel R. A.; Isaya G. (2013) Iron-sulfur cluster synthesis, iron homeostasis and oxidative stress in Friedreich ataxia. Mol. Cell. Neurosci. 55, 50–61. 10.1016/j.mcn.2012.08.003. [DOI] [PMC free article] [PubMed] [Google Scholar]
- Tsai C. L.; Barondeau D. P. (2010) Human Frataxin Is an Allosteric Switch That Activates the Fe-S Cluster Biosynthetic Complex. Biochemistry 49, 9132–9139. 10.1021/bi1013062. [DOI] [PubMed] [Google Scholar]
- Yoon T.; Cowan J. A. (2003) Iron-sulfur cluster biosynthesis. Characterization of frataxin as an iron donor for assembly of [2Fe-2S] clusters in ISU-type proteins. J. Am. Chem. Soc. 125, 6078–6084. 10.1021/ja027967i. [DOI] [PubMed] [Google Scholar]
- Parent A.; Elduque X.; Cornu D.; Belot L.; Le Caer J. P.; Grandas A.; Toledano M. B.; D’Autreaux B. (2015) Mammalian frataxin directly enhances sulfur transfer of NFS1 persulfide to both ISCU and free thiols. Nat. Commun. 6, 5686. 10.1038/ncomms6686. [DOI] [PubMed] [Google Scholar]
- Adinolfi S.; Iannuzzi C.; Prischi F.; Pastore C.; Iametti S.; Martin S. R.; Bonomi F.; Pastore A. (2009) Bacterial frataxin CyaY is the gatekeeper of iron-sulfur cluster formation catalyzed by IscS. Nat. Struct. Mol. Biol. 16, 390–396. 10.1038/nsmb.1579. [DOI] [PubMed] [Google Scholar]
- Yan R.; Konarev P. V.; Iannuzzi C.; Adinolfi S.; Roche B.; Kelly G.; Simon L.; Martin S. R.; Py B.; Barras F.; Svergun D. I.; Pastore A. (2013) Ferredoxin competes with bacterial frataxin in binding to the desulfurase IscS. J. Biol. Chem. 288, 24777–24787. 10.1074/jbc.M113.480327. [DOI] [PMC free article] [PubMed] [Google Scholar]
- Roche B.; Huguenot A.; Barras F.; Py B. (2015) The iron-binding CyaY and IscX proteins assist the ISC-catalyzed Fe-S biogenesis in Escherichia coli. Mol. Microbiol. 95, 605–623. 10.1111/mmi.12888. [DOI] [PubMed] [Google Scholar]
- Cai K.; Frederick R. O.; Kim J. H.; Reinen N. M.; Tonelli M.; Markley J. L. (2013) Human Mitochondrial Chaperone (mtHSP70) and Cysteine Desulfurase (NFS1) Bind Preferentially to the Disordered Conformation whereas Co-chaperone (HSC20) Binds to the Structured Conformation of the Iron-Sulfur Cluster Scaffold Protein (ISCU). J. Biol. Chem. 288, 28755–28770. 10.1074/jbc.M113.482042. [DOI] [PMC free article] [PubMed] [Google Scholar]
- Uzarska M. A.; Dutkiewicz R.; Freibert S. A.; Lill R.; Muhlenhoff U. (2013) The mitochondrial Hsp70 chaperone Ssq1 facilitates Fe/S cluster transfer from Isu1 to Grx5 by complex formation. Mol. Biol. Cell 24, 1830–1841. 10.1091/mbc.E12-09-0644. [DOI] [PMC free article] [PubMed] [Google Scholar]
- Maio N.; Singh A.; Uhrigshardt H.; Saxena N.; Tong W. H.; Rouault T. A. (2014) Cochaperone binding to LYR motifs confers specificity of iron sulfur cluster delivery. Cell Metab. 19, 445–457. 10.1016/j.cmet.2014.01.015. [DOI] [PMC free article] [PubMed] [Google Scholar]
- Takahashi Y.; Nakamura M. (1999) Functional assignment of the ORF2-iscS-iscU-iscA-hscB-hscA-fdx-ORF3 gene cluster involved in the assembly of Fe-S clusters in Escherichia coli. J. Biochem. 126, 917–926. 10.1093/oxfordjournals.jbchem.a022535. [DOI] [PubMed] [Google Scholar]
- Webert H.; Freibert S. A.; Gallo A.; Heidenreich T.; Linne U.; Amlacher S.; Hurt E.; Muhlenhoff U.; Banci L.; Lill R. (2014) Functional reconstitution of mitochondrial Fe/S cluster synthesis on Isu1 reveals the involvement of ferredoxin. Nat. Commun. 5, 5013. 10.1038/ncomms6013. [DOI] [PubMed] [Google Scholar]
- Sheftel A. D.; Stehling O.; Pierik A. J.; Elsasser H. P.; Muhlenhoff U.; Webert H.; Hobler A.; Hannemann F.; Bernhardt R.; Lill R. (2010) Humans possess two mitochondrial ferredoxins, Fdx1 and Fdx2, with distinct roles in steroidogenesis, heme, and Fe/S cluster biosynthesis. Proc. Natl. Acad. Sci. U. S. A. 107, 11775–11780. 10.1073/pnas.1004250107. [DOI] [PMC free article] [PubMed] [Google Scholar]
- Ewen K. M.; Ringle M.; Bernhardt R. (2012) Adrenodoxin--a versatile ferredoxin. IUBMB Life 64, 506–512. 10.1002/iub.1029. [DOI] [PubMed] [Google Scholar]
- Spiegel R.; Saada A.; Halvardson J.; Soiferman D.; Shaag A.; Edvardson S.; Horovitz Y.; Khayat M.; Shalev S. A.; Feuk L.; Elpeleg O. (2014) Deleterious mutation in FDX1L gene is associated with a novel mitochondrial muscle myopathy. Eur. J. Hum. Genet. 22, 902–906. 10.1038/ejhg.2013.269. [DOI] [PMC free article] [PubMed] [Google Scholar]
- Shi Y.; Ghosh M.; Kovtunovych G.; Crooks D. R.; Rouault T. A. (2012) Both human ferredoxins 1 and 2 and ferredoxin reductase are important for iron-sulfur cluster biogenesis. Biochim. Biophys. Acta, Mol. Cell Res. 1823, 484–492. 10.1016/j.bbamcr.2011.11.002. [DOI] [PMC free article] [PubMed] [Google Scholar]
- Qi W.; Li J.; Cowan J. A. (2013) Human ferredoxin-2 displays a unique conformational change. Dalton Transactions 42, 3088–3091. 10.1039/C2DT32018E. [DOI] [PMC free article] [PubMed] [Google Scholar]
- Delaglio F.; Grzesiek S.; Vuister G. W.; Zhu G.; Pfeifer J.; Bax A. (1995) NMRPIPE - A Multidimensional Spectral Processing System Based on UNIX Pipes. J. Biomol. NMR 6, 277–293. 10.1007/BF00197809. [DOI] [PubMed] [Google Scholar]
- Lee W.; Tonelli M.; Markley J. L. (2015) NMRFAM-SPARKY: enhanced software for biomolecular NMR spectroscopy. Bioinformatics 31, 1325–1327. 10.1093/bioinformatics/btu830. [DOI] [PMC free article] [PubMed] [Google Scholar]
- Sun S.; Gill M.; Li Y.; Huang M.; Byrd R. A. (2015) Efficient and generalized processing of multidimensional NUS NMR data: the NESTA algorithm and comparison of regularization terms. J. Biomol. NMR 62, 105–117. 10.1007/s10858-015-9923-x. [DOI] [PMC free article] [PubMed] [Google Scholar]
- Lee W.; Westler W. M.; Bahrami A.; Eghbalnia H. R.; Markley J. L. (2009) PINE-SPARKY: graphical interface for evaluating automated probabilistic peak assignments in protein NMR spectroscopy. Bioinformatics 25, 2085–2087. 10.1093/bioinformatics/btp345. [DOI] [PMC free article] [PubMed] [Google Scholar]
- Coghlan V. M.; Vickery L. E. (1991) Site-Specific Mutations in Human Ferredoxin that Affect Binding to Ferredoxin Reductase and Cytochrome P450scc. J. Biol. Chem. 266, 18606–18612. [PubMed] [Google Scholar]
- Grinberg A. V.; Hannemann F.; Schiffler B.; Muller J.; Heinemann U.; Bernhardt R. (2000) Adrenodoxin: structure, stability, and electron transfer properties. Proteins: Struct., Funct., Genet. 40, 590–612. . [DOI] [PubMed] [Google Scholar]
Associated Data
This section collects any data citations, data availability statements, or supplementary materials included in this article.