

Abstract
Free intracellular calcium ([Ca2+]i), in addition to being an important second messenger, is a key regulator of many cellular processes including cell membrane potential, proliferation, and apoptosis. In many cases, the mobilization of [Ca2+]i is controlled by intracellular store activation and calcium influx. We have investigated the effect of several ion channel modulators, which have been used to treat a range of human diseases, on [Ca2+]i release, by ratiometric calcium imaging. We show that six such modulators [amiodarone (Ami), dofetilide, furosemide (Fur), minoxidil (Min), loxapine (Lox), and Nicorandil] initiate release of [Ca2+]i in prostate and breast cancer cell lines, PC3 and MCF7, respectively. Whole-cell currents in PC3 cells were inhibited by the compounds tested in patch-clamp experiments in a concentration-dependent manner. In all cases [Ca2+]i was increased by modulator concentrations comparable to those used clinically. The increase in [Ca2+]i in response to Ami, Fur, Lox, and Min was reduced significantly (P < 0.01) when the external calcium was reduced to nM concentration by chelation with EGTA. The data suggest that many ion channel regulators mobilize [Ca2+]i. We suggest a mechanism whereby calcium-induced calcium release is implicated; such a mechanism may be important for understanding the action of these compounds.
Introduction
A number of ion channel modulators are used for the treatment of diseases ranging from cardiac arrhythmia to psychosis (Delisle et al., 2004). Although many modulators have been studied for their pharmacological properties, surprisingly little information is available on the role they may play in the availability of free intracellular calcium ([Ca2+]i), which is critical for cell function (e.g., proliferation, apoptosis, and gene regulation) (Berridge et al., 2000). [Ca2+]i also acts as an intracellular transducer for extracellularly activated signaling (e.g., the Wnt signaling pathway) (Thrasivoulou et al., 2013). [Ca2+]i release due to the action of commonly used drugs in different cell types may provide clues regarding some side effects of these compounds. For example, antihypertensive drugs lower the levels of [Ca2+]i in erythrocytes (Baumgart et al., 1986). Epidemiologic studies indicate that patients on antihypertensive drugs have a lower incidence of cancer progression and mortality for breast, skin, and prostate cancers (Barron et al., 2011; Lemeshow et al., 2011; Melhem-Bertrandt et al., 2011; Grytli et al., 2013).
In this work, we decided to concentrate on six commonly used clinical compounds, namely, amiodarone (Ami), dofetilide (Dof), furosemide (Fur), minoxidil (Min), loxapine (Lox), and nicorandil (Nic) to investigate their role in [Ca2+]i release in prostate and breast cancer cells. These drugs act as antihypertensives, antiarrhythmic, vasodilator, and diuretic, by modulating ion channels and transporters.
We performed a series of experiments to investigate the role of these modulators as inhibitors of cellular pathways. By using electrophysiology and live cell calcium imaging we discovered that Ami, Dof, Fur, Min, Lox, and Nic alter whole-cell currents and activate [Ca2+]i stores in cancer cells (PC3, prostate cancer cell line; MCF7, breast cancer cell line). Most of these compounds increase [Ca2+]i release with distinct kinetics via calcium-induced calcium release (CICR) (Bootman et al., 2002) dependent and independent mechanisms. Our results reveal a novel mechanism of action of numerous ion channel modulators that have the potential of manipulating the magnitude and duration of free [Ca2+]i changes in mammalian cells in vitro.
Materials and Methods
Compounds.
Stock solutions were prepared in phosphate-buffered saline (without Ca2+ or Mg2+ pH 7.4, Gibco ThermoFisher: Loughborough, UK). All compounds used in live [Ca2+]i experiments (Ami hydrochloride, Dof, Fur, Min, Lox succinate salt, and Nic) were purchased from Sigma-Aldrich (Dorset, UK) and dissolved in dimethylsulfoxide (DMSO) ReagentPlus (Sigma-Aldrich). The systematic names of the compounds are as follows: Ami hydrochloride: 2-butyl-3-benzofuranyl)[4-[2-(diethylamino)ethoxy]-3,5-diiodophenyl]methanone hydrochloride; Dof: N-[4-[2-[Methyl[2-[4-[(methylsulfonyl)amino]phenoxy]ethyl]amino]ethyl]phenyl]methanesulfonamide; Fur: 4-chloro-N-furfuryl-5-sulfamoylanthranilic acid; Min: 6-(1-Piperidinyl)-2,4-pyrimidinediamine 3-oxide; Lox succinate salt: 2-Chloro-11-(4-methyl-1-piperazinyl)dibenzo[b,f][1,4]oxazepine and 1,4-Butanedioic acid; and Nic: 2-(Pyridine-3-carbonylamino)ethyl nitrate (also see the Supplemental Material for the structures).
Cell Culturing.
The cell lines used (PC3, prostate cancer; MCF7, breast cancer) were obtained from ATCC (American Type Culture Collection, Middlesex, UK). The protocols used to culture these have been described elsewhere (Thrasivoulou et al., 2013). Briefly, cells were cultured in RPMI Medium 1640 (Gibco) supplemented with 5 mM L-glutamine and fetal bovine serum (10%). Dissociated cells were plated in filtered, 25-cm2 Nunc EasYFlask (Thermo Scientific: Loughborough, UK) at a plating density of 105 cells/flask. Dissociation of cells was achieved by treating the cells for 3 minutes with 1 ml of trypsin (2.5%)/versene (ratio 1:9, Gibco) incubated at 37°C. Cells were maintained at 37°C in a humidified 5% CO2 atmosphere and 21% O2.
High-Throughput Electrophysiology.
Experiments were performed using the QPatch single-hole and QPatch multihole technologies with QPlate (Biolin-Sophion: Ballerup, Denmark). The QPlate contains 16 or 48 individual patch-clamp sites that are operated asynchronously and in parallel. PC3 were cultured and harvested using Detachin and kept in the QStirrer (Biolin-Sophion) on the QPatch prior to the automatic preparation. The intracellular solution contained (in mM concentrations): CaCl2 5.3, MgCl2 1.7, EGTA 10; HEPES 10; KCl 120 and Na2-ATP 4; pH 7.2 with osmolarity of 295 mOsm. The intracellular solution is thus calculated to contain 680 nM free calcium. The extracellular solution contained CaCl2 2, MgCl2 1, HEPES 10, KCl 4, and NaCl 145; pH 7.4 with osmolarity adjusted to 285–295 mOsm.
Subsequent to the cell suspension being transferred from the QStirrer to the QPlate, a pressure of −70 mBar was applied to obtain positioning and sealing of the cells. A whole-cell protocol with pressure pulses at −150 mBar was used to obtain whole-cell formation. Thereafter, the membrane was clamped at −90 mV between executions of the voltage protocols.
The intracellular solutions and compounds were applied by eight pipettes. PC3 cells were kept in culture medium in the QStirrer for up to 4 hours. Prior to testing, the cells were transferred to the QFuge (Biolin-Sophion), spun down, and washed in Ringer’s solution twice before being applied to the measuring site in the QPlate. Gigaseals were formed upon execution of a combined suction/voltage protocol. Further suction led to establishment of the whole-cell configuration. Solutions and compounds were applied through the glass-coated flow channels in the QPlate. Currents were recorded using a command ramp from −120 to +120 mV at 0.5 mV/ms every 3 seconds. Data were sampled at 5 kHz and filtered using a fourth-order Bessel filter.
The IC50 values were calculated using a Hill equation fit to the average currents (Ic) in a single experiment as the concentrations were increased. Thus
 |
where Ib and If is the baseline and final response current levels, respectively; iec50 is the IC50 or EC50 value; h is the Hill coefficient; and c is the compound concentration. A Levenberg-Marquardt minimization was used to fit the parameters.
Intracellular Calcium Imaging.
[Ca2+]i imaging was performed as described elsewhere (Thrasivoulou et al., 2013). Cells were grown as a monolayer in 35-mm FluoroDish (World Precision Instruments: Hertfordshire, UK) in 3 ml of culture medium for 60–80 hours prior to imaging. Fluorescent Ca2+ indicators FuraRed and Fluo-4 (Invitrogen ThermoFisher: Loughborough, UK) were loaded in the FluoroDish 30 minutes before imaging and incubated at 37°C. Both fluorescent indicators were added at 1 μg/ml (∼1.3 μM) after removing 2 ml out of 3 ml of medium in the FluoroDish. Prior to imaging, the FluoroDish was washed with phosphate-buffered saline (2×) and replaced with 1 ml of fresh phosphate-buffered saline. Live [Ca2+]i imaging was performed on an Olympus FluoView 1000 confocal microscope using a 20× dry objective (numerical aperture 0.75) at 37°C. Fluorescent Ca2+ indicators were excited with an argon laser line (488 nm), and emissions were recorded in the green channel (500–560 nm) for Fluo-4 and in the red channel (600–700 nm) for FuraRed. Image and data acquisition was performed using FluoView 1000 software (Olympus: Essex, UK). Fluorescent intensity was measured and data exported as a tab-delimited file and in an Excel file format for further analysis using Wolfram (Oxfordshire, UK) Mathematica 10.3 (Supplemental Fig. 1), MedCalc (version 13.1.2 Ostend, Belgium), and OriginPro 2015 (OriginLab Northampton, MA) software.
Free Calcium Measurements in Solutions.
Since imaging experiments were carried out in nominally zero calcium solutions, calcium ion measurements were made using a B-751 LAQUAtwin compact calcium ion meter (Horiba Kyoto, Japan), calibrated using standard calcium solutions (provided by the manufacturer) in the one-point calibration in low concentration mode. The experiments were repeated with different batches of solutions over different days. When chelated by EGTA, free calcium was reduced to <10 nM at 37°C.
Data Analysis and Statistics.
The kinetics of free [Ca2+]i (e.g., time constants for rise, dwell, and fall times) were calculated using analysis described previously (Thrasivoulou et al., 2013). Briefly, from the baseline of the signal to the highest point of the peak, two parallel lines were placed on the 10% and 90% y-axis of the peak. This creates four interception points on the waveform. The rise time is defined as the time from the first point to the second point, the dwell time is similarly defined as the time from the second point to the third point, and the fall time is defined as the time from the third point to the fourth point. The data acquired from the FuraRed and Fluo-4 channels were exported from the FluoView 1000 software and the Fluo-4/FuraRed ratio was calculated. Fluo-4 is not fluorescent unless bound to Ca2+ and used as an indicator for ([Ca2+]i; FuraRed fluorescence decreases once bound to Ca2+. The two indicators have reciprocal shifts in intensity due to calcium binding and are used together in a ratiometric probe strategy. The time-series data were then plotted using Origin 2015 software (OriginLab) and used as the basis for measurements on the kinetics of calcium mobilization. The rise, dwell, and fall times were calculated as described elsewhere (Wang et al., 2010; Thrasivoulou et al., 2013). Statistical analysis was performed using the Mann-Whitney U test using the MedCalc software (version 15.8). For some experiments, Wolfram Mathematica 10.3 (used for Supplemental Fig. 1) was programmed to analyze the data automatically using the same methods for the peak analysis and time-constant calculations as were used with Origin.
Results
Electrophysiological Properties of Compounds on Whole-Cell Currents in PC3 Cells.
The electropharmacology of a number of compounds has been described with IC50 concentrations in the micromolar range for the modulation of endogenous currents, largely for antiarrhythmic function in cardiac cells (Leblanc et al., 1989; Rasmussen et al., 1992; Satoh, 1993; Kodama et al., 1997; Desai et al., 2000; Thümmler et al., 2007; Biton et al., 2012) but also for some other cell types (Desai et al., 2000) including cell lines overexpressing specific ion channel proteins (Thümmler et al., 2007) (summarized in Supplemental Table 1). We first established a concentration dependence for the inhibition of endogenous currents in PC3 cells using a multipatch system (QPatch, see Materials and Methods) using five different concentrations of the compounds.
Figure 1 shows currents at a range of potentials elicited in whole-cell clamped PC3 cells using a ramp command potential (from −120 to +120 mV). All compounds inhibited whole-cell endogenous currents in PC3 cells by 25%–70%. The mean inward current at −100 mV was inhibited by 69% by 33 µM Lox (n = 5), by 57% by 50 µM Dof (n = 4), by 30% by 50 µM Min (n = 3), and by 61% by 50 µM Nic (n = 3). At positive potentials (e.g., +100 mV) the inhibition of the whole-cell current was relatively less (between 24% and 50%). The results indicate that there exists an inhibitable inward movement of cations at more negative potentials.
Fig. 1.

Representative current-voltage (I-V) curve of 3–6 independent cells is shown. Single cells were placed in a QPatch plate (see Materials and Methods) and recorded in a whole-cell configuration. A voltage ramp of −120 to +120 mV was executed every 3 seconds. Current-voltage characteristics of control (gray lines) and with drugs (colored lines). (A) Lox (orange) at 33 µM, (B) Dof (blue) at 50 µM, (C) Nic (green) at 50 µM, and (D) Min (red) at 50 µM (similar experiments were performed for Ami and Fur, data not shown). All compounds tested inhibited the whole-cell current at negative and positive potentials by 25%–70% of the control.
The data show no indication of pronounced voltage dependence to the inhibition. To establish the concentration dependence of inhibition, the endogenous currents were measured at +120 mV (Fig. 2) and at −70 mV. The IC50 values for the six compounds used ranged between 10 and 300 µM. These results indicate that endogenous currents in PC3 cells are modulated by the six compounds tested. Based on these experiments we used 50 µM as the concentration for most of the compounds tested for [Ca2+]i release experiments.
Fig. 2.

Concentration dependence of the inhibition of endogenous currents using QPatch in PC3 cells by compounds used in this study. A voltage ramp was employed to measure currents in PC3 cells using the QPatch system (see Materials and Methods). Peak currents with and without the compounds at 120 mV were used to construct concentration dependence of the inhibition of the currents. Each graph represents a single cell; IC50 values were calculated using the data represented previously. The x-axis for each compound is found below each condition’s graphs as a scale bar (µM).
[Ca2+]i Release in Response to Ion Channel Activity Modulating Compounds.
Addition of the tested compounds to the extracellular solution caused a change in the ratio of Fluo-4/FuraRed in PC3 cells (Fig. 3; Supplemental Material). When the ratio of Fluo-4/FuraRed was plotted against time, the free [Ca2+]i rise induced by all compounds can be described as having a distinct rise from the baseline, dwelling in the plateau phase, and returning back to the baseline (Fig. 4). This waveform was used to measure the amplitude and kinetics of the activation of [Ca2+]i in PC3 cells in response to Ami, Dof, Fur, Min, Lox, and Nic. The amplitude of the calcium signal varied between the compounds with Min, Ami, and Lox demonstrating the highest amplitude and Fur, Nic, and Dof demonstrating relatively low amplitude (Fig. 5). The amplitude of calcium release in PC3 cells for Ami, Dof, Fur, Lox, Min, and Nic were 2 ± 0.2, 1 ± 0.1, 1.2 ± 0.1, 1.5 ± 0.2, 1.7 ± 0.2, and 1.2 ± 0.1 (mean ± S.E.M., n = 30–78 cells from 4 to 10 individual experiments), respectively, relative to a baseline of 1.0. The [Ca2+]i release in response to these compounds was also concentration dependent (Fig. 6). In addition, all compounds induced a [Ca2+]i rise in MCF7 cells, a breast cancer cell line (Supplemental Fig. 2; Supplemental Material). Thus, the phenomenon was not specific to the PC3 cell line only.
Fig. 3.

Snapshots of PC3 cells labeled with calcium indicators Fluo-4 (green) and FuraRed (red), of four time points (A–D) at t = 0, 281, 288, and 492 seconds. At t = 0 seconds (A), steady state, baseline; at t = 281 seconds (B) approximately 50% of cells undergoing a calcium release; at t = 288 seconds (C) calcium signal during the peak of the response; and at t = 492 seconds (D) after the calcium response has ended the signal returns to baseline. The diffusion constant has been previously measured as 0.21 µm/second. Scale bar = 10 μm.
Fig. 4.

Representative traces of intracellular calcium release in PC3 cells in response to addition of 50 μM concentration of compounds (green, Ami; orange, Min; red, Lox; pink, Fur; gray, Dof; blue, Nic; and black, DMSO). The y-axis is the ratio of Fluo-4/FuraRed channels (unbound calcium/bound calcium, respectively) in arbitrary units. The mean amplitude and time constants of each compound were used to select a representative trace with similar characteristics. Number of independent experiments n = 5–8 per compound; 30–80 single cell measurements per compound.
Fig. 5.

Concentration dependence of the intracellular calcium release using live calcium imaging. Box plots of Lox, Min, and Fur. The x-axis is the concentration (µM) and the y-axis is the amplitude of the waveforms in arbitrary units (A.U.).
Fig. 6.

Box plots of the amplitude of the calcium waveform. Amplitude measurements at the peak of the response with the addition of each compound (50 μM) to PC3 cells (n = 30–78 cells per compound). Statistical significance was calculated using a Mann-Whitney U test. The amplitude is measured in arbitrary units (A.U.). Number of independent experiments n = 5–8 per compound; 30–80 single cell measurements per compound.
We have previously observed that DMSO, the vehicle used to dissolve organic compounds such as thapsigargin (Thastrup et al., 1990) or those used in this study, can induce [Ca2+]i release in PC3 cells (Thrasivoulou et al., 2013) in addition to other cell types (Morley and Whitfield, 1993). This was the case here (Fig. 4; Supplemental Fig. 2). To limit the contamination of the [Ca2+]i signal by the effects of DMSO two strategies were adopted:
The [Ca2+]i release by experimental compound dissolved in DMSO was investigated in the same cell following exposure to DMSO alone [similar to Thrasivoulou et al. (2013) and Morley and Whitfield (1993)]. When this control was used, there was a relatively small [Ca2+]i release after exposure to DMSO alone (e.g., Ami, Supplemental Fig. 3).
Ethanol and methanol were used as the solvent instead of DMSO. For example, when Lox or Fur were dissolved in ethanol or methanol (Supplemental Figs. 4 and 5), the [Ca2+]i release was similar to that observed when these compounds were resuspended in DMSO. Such controls indicate that [Ca2+]i release is induced by the compounds with minimal, if any, contribution from the effects of DMSO and that the DMSO-induced [Ca2+]i occurs by a different mechanism than those induced by the compounds used in this study.
Kinetics of [Ca2+]i Release: Rise, Dwell, and Fall Times.
The waveform was characterized by three constants: rise time (the time needed to reach maximum amplitude), dwell time (the time the signal stays at the peak), and fall time (the time needed for the signal to fall from the peak back to the baseline), according to criteria described previously (Thrasivoulou et al., 2013). The time constants indicate that the [Ca2+]i release characteristics varied significantly between the compounds tested (Fig. 7, A–C). For example, the free [Ca2+]i release by Dof demonstrates a relatively low amplitude and long duration (Figs. 4, 6, and 7B). Min and Dof displayed the slowest rise and fall times, as well as the longest dwell time (Fig. 7, A–C). A principal component analysis of the compounds based on the dwell time characteristics of [Ca2+]i indicated that these drugs showed three components with most drugs segregating into two components (Fig. 7D). These results indicate that Min and Dof induce slow exhaustion and replenishments of the free [Ca2+]i stores. Dof had the slowest rise, dwell, and fall times.
Fig. 7.

Box plots for time constants of the calcium waveform. The time constants [(A) rise, (B) dwell, and (C) fall times] were calculated from the calcium waveform generated by the addition of each compound (50 μM) to PC3 cells. Min, Ami, Nic, Dof, Lox, and Fur labels indicated. A principal component analysis was performed on the dwell time constants and a loading plot (D) is shown. On the basis of this, three components are identified with a majority of drugs segregate into two components. For (A–C) the number of independent experiments was n = 5–8 per compound; 30–80 single cell measurements per compound.
The characteristics of rise, dwell, and fall times seemed to follow a specific pattern for any given compound, e.g., a reagent that has a fast rise time, would also have a short dwell time and fast fall time or vice versa. Unlike the other compounds used, Nic is an activator of K+ channels (Kukovetz et al., 1992). The [Ca2+]i waveform for Nic was relatively small and similar to that of DMSO, both in amplitude and duration (Figs. 4 and 7B). In some experiments, Nic-induced [Ca2+]i release was measured soon after application of DMSO in the same cells and the results were similar to those found in Fig. 4, indicating that it is distinguishable from that of DMSO. The dwell times could be categorized into short (Ami and Lox), long (Min and Fur), and very long (Dof). Time constants and amplitude were also calculated for MCF7 cells (Supplemental Fig. 6).
Control of Drug-Induced [Ca2+]i by Extracellular Calcium.
In the majority of our live calcium imaging experiments, we used nominally calcium free extracellular solution to investigate [Ca2+]i release; the external calcium was estimated to exceed 70 µM due to impurity contamination from other salts. The measured Ca2+ in the extracellular solution, in the so-called Ca2+-free solutions, was found to be 62.3 ± 8.2 µM (n = 30 from three batches).
It is known that in certain circumstances [Ca2+]i release can be triggered by entry of very small amounts of Ca2+ from outside, via the opening of calcium channels, to initiate a much larger increase of free [Ca2+]i by a CICR mechanism (Bootman et al., 2002). CICR has been described in many cell types including striated muscle (Endo et al., 1970; Fabiato, 1983; Endo, 2007) and nonmuscle cells (Verkhratsky and Shmigol, 1996). Even entry from submicromolar levels of extracellular calcium can be sufficient to activate CICR pathways (Berridge et al., 2003; Endo, 2009).
Therefore, we hypothesized that at least one pathway through which the present drugs activated intracellular stores was via CICR. To test this hypothesis we reduced free calcium in the extracellular solution with 5 mM EGTA. The resulting calculated level of calcium was then less than <10 nM. The amplitude of the [Ca2+]i signal in the presence of EGTA was significantly reduced in most of our compounds (Fig. 8). These results indicate that a CICR mechanism may be operating to activate intracellular Ca2+ stores in response to the application of drugs. Live calcium imaging was also performed on PC3 cells, pretreated with the calcium channel blocker nifedipine prior to addition of compound Min or Lox. The drug-induced [Ca2+]i release was inhibited by nifedipine (Supplemental Fig. 7). The results are similar to those observed when EGTA was added to the extracellular solution, further indicating that the drug-induced [Ca2+]i release is facilitated by extracellular calcium.
Fig. 8.

Effect of reducing extracellular calcium with EGTA. When EGTA reduced the external calcium to <10 nM [in phosphate-buffered saline (PBS)] the response was reduced. Control solution, PBS; [Ca2+] = 62.3 µM ± 8.2); y-axis amplitude in arbitrary units (A.U.). Number of independent experiments per compound: n = 3 to 4; 55–205 single cell measurements per compound.
Discussion
In this study, we demonstrated that Ami, Dof, Fur, Min, Lox, and Nic (see Supplemental Fig. 8 for the molecular structures of the compounds) give rise to a [Ca2+]i signal in PC3 prostate cancer cell lines and in MCF7 breast cancer cell lines. To our knowledge this is the first report of these compounds acting on [Ca2+]i in cancer cells.
Ami (a benzofuran derivative, class III anti-arrythmic, and K+ channel blocker) has been used to treat tachycardias (Kodama et al., 1997); it is known to induce intracellular calcium alterations in fungi (Gupta et al., 2003; Courchesne et al., 2009). Dof, another antiarrhythmic, selectively inhibits the rapid component of hERG/IKr K+ current (Rasmussen et al., 1992). Fur, a sulfamoylanthranilic acid derivative and diuretic inhibits Na-K-Cl cotransporter (Haas, 1989). Both Nic and Min act on adenosine triphosphate–sensitive K+ (KATP) channels (Taira, 1989; Edwards and Weston, 1990) and are used as vasodilators; Min is further used to stimulate hair growth and induces intracellular calcium release in dermal papilla cells (Li et al., 2001). Lox, an antipsychotic drug, activates Slack channels (Biton et al., 2012) and inhibits mechanosensitive ion channels (e.g., KCNK2) (Thümmler et al., 2007) (see Supplemental Table 1). The role of calcium in cell proliferation and apoptosis in both cancer and immune cells (Schwarz et al., 2013) indicates that modulation of intracellular calcium processes may present a potential therapeutic action of the compounds used in this study and would be a useful tool in cancer research.
Since the measured signal was sensitive to the external level of free calcium we propose that a novel mechanism for [Ca2+]i release by Ami, Fur, Min, and Lox is a CICR-facilitated mechanism as evidenced by the live calcium imaging results (Fig. 8). The compounds tested have a variety of clinical applications, including vasodilation, antiarrhythmics, and diuretics. They exert their therapeutic actions by interacting mainly with potassium channels and other ion transporters. The current literature describes a number of receptor interactions for each compound individually but fails to make any connection with any [Ca2+]i release (Edwards and Weston, 1990; Nattel et al., 1992; Rasmussen et al., 1992; Yamada et al., 1997; Lee et al., 2007; Biton et al., 2012). A general feature of calcium signaling is how different calcium signals can be translated into specific cell functions depending on their amplitude and duration; the type of signal may result in different functions such as proliferation, apoptosis, and tolerance (Bandyopadhyay et al., 2007; Qu et al., 2011).
The electropharmacology of the compounds tested indicates that there is an inhibition of currents evoked at both negative and positive potentials (Figs. 1 and 2). Most of these compounds have been investigated for their electrophysiological properties either in cells overexpressing ion channels (Yamada et al., 1997; Thümmler et al., 2007) or in neurons and cardiac cells (Leblanc et al., 1989; Rasmussen et al., 1992; Satoh, 1993; Kodama et al., 1997; Desai et al., 2000; Thümmler et al., 2007; Biton et al., 2012). Very little is known about how these drugs influence the electrical properties of the cell membrane in prostate or other cancer cell lines. Our primary motivation in investigating the electrophysiological properties of the modulation of whole-cell currents by the high-throughput approach was to set a baseline and identify a range of concentrations for [Ca2+]i assays in PC3 cells.
Intracellular cytosolic calcium concentration levels can increase from a variety of routes. Most routes involve membrane-bound ion channel transporters, which promote calcium influx. A key observation in our study is that the [Ca2+]i rise induced by the compounds tested here must be via release from internal stores via CICR once calcium enters the cell (Fig. 9) since chelation of external calcium significantly reduces the response (between 60% and 100%). Routes for calcium entry via the membrane include specific calcium channels as well as through nonspecific cation channels that have significant calcium permeability. Such channels include members of the transient receptor potential family, some of which are known to be expressed in cancer cell lines (Nilius and Owsianik, 2010).
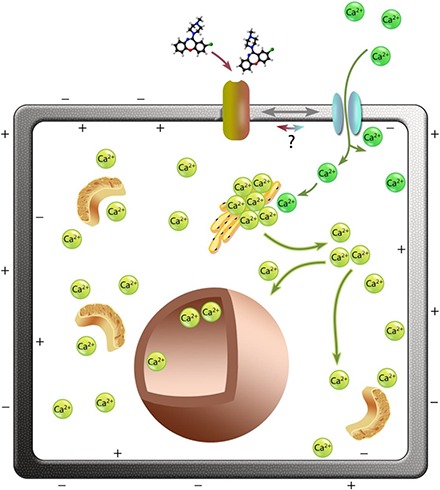
Fig. 9.

Model for drug-induced [Ca2+]i release via a CICR mechanism. We propose that binding of compounds such as Ami (shown), Fur, Lox, and Min bind to membrane protein receptors and initiate activation of the Ca2+ channel. Entry of external Ca2+ (dark green) into the cell depolarizes the cell electrical potential that activates intracellular Ca2+ (light green) stores (e.g., in the endoplasmic reticulum). This activates release of [Ca2+]i from the stores; Ca2+ release in the cytosol in response to the drugs can be seen in Fig. 3 and the Supplemental Material. The free cytosolic Ca2+ then enters the nucleus.
An estimate of the flux through such channels can be obtained from the I-V curves of Fig. 1. Although there is little sign of the potential dependence expected for a voltage-gated calcium channel, the inward currents measured at −100 mV in control cells suggest typical standing conductance of 2.7 nS (n = 15). This is equivalent to a cell input resistance of 380 MΩ, and the presence of about 100 cation-permeable transient receptor potential channels. Depending on the cell volume around the calcium stores into which external Ca2+ would flow, it is plausible that even such a number of calcium entry sites could lead to the CICR signal observed. However, it is also plausible, comparing the live calcium imaging and electrophysiology data (Figs. 8 and 1, respectively) that there may be independent inhibition of the whole-cell currents by the compounds tested as well as an interdependent CICR-mediated mechanism of [Ca2+]i.
Other possible contributory routes are the ones involving membrane-bound receptors that act on [Ca2+]i intracellular stores with the help of secondary messengers. The main calcium store in most nonstriated cells is the endoplasmic reticulum. The major calcium flux channels located on the endoplasmic reticulum are the ryanodine receptors (Otsu et al., 1990) and inositol 1,4,5-triphosphate receptors (Nixon et al., 1994). Calcium is also stored in the mitochondria, sarcoplasmic reticulum (muscle cells only), and nuclear envelop; they also have to be taken into consideration as a possible source of the Ca2+ signal observed. Calcium mobilization from intracellular stores has been known to occur due to elevation of inositol triphosphate (IP3) levels via the IP3/diacyglycerol pathway (Nakamura et al., 2000; Berridge, 2012). G protein-coupled receptors activate phospholipase C, which in turn hydrolyses PIP2 to form IP3 and diacyglycerol. IP3 then binds to the IP3 receptor (a calcium channel) on the endoplasmic reticulum, releasing calcium into the cytoplasm. Ami has been shown to be a direct activator of G protein-coupled receptors; thus, this is a plausible route of the signal induced by this compound, resulting in calcium release.
There is little evidence in the literature to suggest that the other compounds used in this study are linked to activation of G protein-coupled receptors. There are a large number of G protein-coupled receptors (Gαq, Gα11, Gα14, Gα15, and Gβγ) and protein tyrosine kinase receptors that are coupled to different phospholipase C isoforms (PLCβ1-4, PLCγ1-2, PLCδ1-4, and PLCε), which are able to generate [Ca2+]i mobilization through IP3 (Berridge, 2012). The duration, intensity, and type of calcium flux seen in different cell types may regulate different Ca2+-dependent cellular functions, such as proliferation and motility (Berridge et al., 2000). For example, studies in T cells show that different Ca2+ signals can be translated into specific transcription factor profiles, which may cause the cells to undergo apoptosis, to proliferate, or to increase their tolerance to environmental stress (Macián et al., 2002; Bandyopadhyay et al., 2007; Qu et al., 2011). The focus of our future studies will be to examine what effects these compounds have on the transcriptional profile of cancer cells and pinpoint the receptors and downstream pathways responsible for the Ca2+ flux we have observed in this study, with the aim of creating a set of biologic tools for manipulating intracellular calcium dynamics to selectively control cell proliferation or cell death.
In summary, we have shown for the first time that exposure to various ion channel activity regulators causes a release of [Ca2+]i with distinct characteristics of rise, dwell, and fall time constants. We further show that a possible mechanism for the drug-induced [Ca2+]i release is via CICR (Fig. 9). We believe that the data presented here show a novel cellular function for these known ion channel regulators and may have implications on the actions and side effects of these drugs that have been in clinical use for some time.
Acknowledgments
We are grateful to Jane Pendijky, University College London, for help with Fig. 9. We are also grateful to Professor Tony Davies, University of London, for discussions. We thank Stefan Kamrad, University College London, for help with data analysis.
Abbreviations
- Ami
amiodarone
- [Ca2+]i
free intracellular calcium
- CICR
calcium-induced calcium release
- DMSO
dimethylsulfoxide
- Dof
dofetilide
- Fur
furosemide
- IP3
inositol triphosphate
- Lox
loxapine
- Min
minoxidil
- Nic
nicorandil
Authorship Contributions
Participated in research design: Ahmed, Olsen.
Conducted experiments: Petrou, Thrasivoulou, Olsen.
Contributed new reagents or analytic tools: Masters, Ashmore, Thrasivoulou.
Performed data analysis: Petrou, Ahmed, Olsen, Ashmore.
Wrote or contributed to the writing of the manuscript: Petrou, Ashmore, Ahmed.
Footnotes
This work received financial support from the Prostate Cancer Research Centre Charity [U.K. Charity No. 1156027] and from a University College London Business Proof of Concept grant.
 This article has supplemental material available at jpet.aspetjournals.org.
References
- Bandyopadhyay S, Soto-Nieves N, Macián F. (2007) Transcriptional regulation of T cell tolerance. Semin Immunol 19:180–187. [DOI] [PMC free article] [PubMed] [Google Scholar]
- Barron TI, Connolly RM, Sharp L, Bennett K, Visvanathan K. (2011) Beta blockers and breast cancer mortality: a population-based study. J Clin Oncol 29:2635–2644. [DOI] [PubMed] [Google Scholar]
- Baumgart P, Zidek W, Schmidt W, Haecker W, Dorst KG, Vetter H. (1986) Intracellular calcium in hypertension: effect of treatment with beta-adrenoreceptor blockers. J Cardiovasc Pharmacol 8:559–561. [PubMed] [Google Scholar]
- Berridge MJ. (2012) Calcium signalling remodelling and disease. Biochem Soc Trans 40:297–309. [DOI] [PubMed] [Google Scholar]
- Berridge MJ, Bootman MD, Roderick HL. (2003) Calcium signalling: dynamics, homeostasis and remodelling. Nat Rev Mol Cell Biol 4:517–529. [DOI] [PubMed] [Google Scholar]
- Berridge MJ, Lipp P, Bootman MD. (2000) The versatility and universality of calcium signalling. Nat Rev Mol Cell Biol 1:11–21. [DOI] [PubMed] [Google Scholar]
- Biton B, Sethuramanujam S, Picchione KE, Bhattacharjee A, Khessibi N, Chesney F, Lanneau C, Curet O, Avenet P. (2012) The antipsychotic drug loxapine is an opener of the sodium-activated potassium channel slack (Slo2.2). J Pharmacol Exp Ther 340:706–715. [DOI] [PubMed] [Google Scholar]
- Bootman MD, Berridge MJ, Roderick HL. (2002) Calcium signalling: more messengers, more channels, more complexity. Curr Biol 12:R563–R565. [DOI] [PubMed] [Google Scholar]
- Champeroux P, Ouillé A, Martel E, Fowler JS, Maurin A, Richard S, Le Guennec JY. (2011) A step towards characterisation of electrophysiological profile of torsadogenic drugs. J Pharmacol Toxicol Methods 63:269–278. [DOI] [PubMed] [Google Scholar]
- Chatelain P, Meysmans L, Mattéazzi JR, Beaufort P, Clinet M. (1995) Interaction of the antiarrhythmic agents SR 33589 and amiodarone with the beta-adrenoceptor and adenylate cyclase in rat heart. Br J Pharmacol 116:1949–1956. [DOI] [PMC free article] [PubMed] [Google Scholar]
- Courchesne WE, Tunc M, Liao S. (2009) Amiodarone induces stress responses and calcium flux mediated by the cell wall in Saccharomyces cerevisiae. Can J Microbiol 55:288–303. [DOI] [PubMed] [Google Scholar]
- Delisle BP, Anson BD, Rajamani S, January CT. (2004) Biology of cardiac arrhythmias: ion channel protein trafficking. Circ Res 94:1418–1428. [DOI] [PubMed] [Google Scholar]
- Desai SA, Bezrukov SM, Zimmerberg J. (2000) A voltage-dependent channel involved in nutrient uptake by red blood cells infected with the malaria parasite. Nature 406:1001–1005. [DOI] [PubMed] [Google Scholar]
- Dorn A, Hermann F, Ebneth A, Bothmann H, Trube G, Christensen K, Apfel C. (2005) Evaluation of a high-throughput fluorescence assay method for hERG potassium channel inhibition. J Biomol Screen 10:339–347. [DOI] [PubMed] [Google Scholar]
- Edwards G, Weston AH. (1990) Potassium channel openers and vascular smooth muscle relaxation. Pharmacol Ther 48:237–258. [DOI] [PubMed] [Google Scholar]
- Endo M. (2007) Calcium-induced release of calcium from the sarcoplasmic reticulum. Adv Exp Med Biol 592:275–285. [DOI] [PubMed] [Google Scholar]
- Endo M. (2009) Calcium-induced calcium release in skeletal muscle. Physiol Rev 89:1153–1176. [DOI] [PubMed] [Google Scholar]
- Endo M, Tanaka M, Ogawa Y. (1970) Calcium induced release of calcium from the sarcoplasmic reticulum of skinned skeletal muscle fibres. Nature 228:34–36. [DOI] [PubMed] [Google Scholar]
- Fabiato A. (1983) Calcium-induced release of calcium from the cardiac sarcoplasmic reticulum. Am J Physiol 245:C1–C14. [DOI] [PubMed] [Google Scholar]
- Fulton A, Norman T, Burrows GD. (1982) Ligand binding and platelet uptake studies of loxapine, amoxapine and their 8-hydroxylated derivatives. J Affect Disord 4:113–119. [DOI] [PubMed] [Google Scholar]
- Grytli HH, Fagerland MW, Fosså SD, Taskén KA, Håheim LL. (2013) Use of β-blockers is associated with prostate cancer-specific survival in prostate cancer patients on androgen deprivation therapy. Prostate 73:250–260. [DOI] [PubMed] [Google Scholar]
- Gupta SS, Ton VK, Beaudry V, Rulli S, Cunningham K, Rao R. (2003) Antifungal activity of amiodarone is mediated by disruption of calcium homeostasis. J Biol Chem 278:28831–28839. [DOI] [PubMed] [Google Scholar]
- Haas M. (1989) Properties and diversity of (Na-K-Cl) cotransporters. Annu Rev Physiol 51:443–457. [DOI] [PubMed] [Google Scholar]
- Jurkiewicz NK, Sanguinetti MC. (1993) Rate-dependent prolongation of cardiac action potentials by a methanesulfonanilide class III antiarrhythmic agent. Specific block of rapidly activating delayed rectifier K+ current by dofetilide. Circ Res 72:75–83. [DOI] [PubMed] [Google Scholar]
- Kodama I, Kamiya K, Toyama J. (1997) Cellular electropharmacology of amiodarone. Cardiovasc Res 35:13–29. [DOI] [PubMed] [Google Scholar]
- Kolbaev SN, Sharonova IN, Vorobjev VS, Skrebitsky VG. (2002) Mechanisms of GABAA receptor blockade by millimolar concentrations of furosemide in isolated rat Purkinje cells. Neuropharmacology 42:913–921. [DOI] [PubMed] [Google Scholar]
- Kukovetz WR, Holzmann S, Pöch G. (1992) Molecular mechanism of action of nicorandil. J Cardiovasc Pharmacol 20 (Suppl 3):S1–S7. [DOI] [PubMed] [Google Scholar]
- Leblanc N, Wilde DW, Keef KD, Hume JR. (1989) Electrophysiological mechanisms of minoxidil sulfate-induced vasodilation of rabbit portal vein. Circ Res 65:1102–1111. [DOI] [PubMed] [Google Scholar]
- Lee CT, Chen HC, Lai LW, Yong KC, Lien YHH. (2007) Effects of furosemide on renal calcium handling. Am J Physiol Renal Physiol 293:F1231–F1237. [DOI] [PubMed] [Google Scholar]
- Lemeshow S, Sørensen HT, Phillips G, Yang EV, Antonsen S, Riis AH, Lesinski GB, Jackson R, Glaser R. (2011) β-Blockers and survival among Danish patients with malignant melanoma: a population-based cohort study. Cancer Epidemiol Biomarkers Prev 20:2273–2279. [DOI] [PMC free article] [PubMed] [Google Scholar]
- Li M, Marubayashi A, Nakaya Y, Fukui K, Arase S. (2001) Minoxidil-induced hair growth is mediated by adenosine in cultured dermal papilla cells: possible involvement of sulfonylurea receptor 2B as a target of minoxidil. J Invest Dermatol 117:1594–1600. [DOI] [PubMed] [Google Scholar]
- Macián F, García-Cózar F, Im SH, Horton HF, Byrne MC, Rao A. (2002) Transcriptional mechanisms underlying lymphocyte tolerance. Cell 109:719–731. [DOI] [PubMed] [Google Scholar]
- Meisheri KD, Cipkus-Dubray LA, Hosner JM, Khan SA. (1991) Nicorandil-induced vasorelaxation: functional evidence for K+ channel-dependent and cyclic GMP-dependent components in a single vascular preparation. J Cardiovasc Pharmacol 17:903–912. [PubMed] [Google Scholar]
- Melhem-Bertrandt A, Chavez-Macgregor M, Lei X, Brown EN, Lee RT, Meric-Bernstam F, Sood AK, Conzen SD, Hortobagyi GN, Gonzalez-Angulo AM. (2011) Beta-blocker use is associated with improved relapse-free survival in patients with triple-negative breast cancer. J Clin Oncol 29:2645–2652. [DOI] [PMC free article] [PubMed] [Google Scholar]
- Morley P, Whitfield JF. (1993) The differentiation inducer, dimethyl sulfoxide, transiently increases the intracellular calcium ion concentration in various cell types. J Cell Physiol 156:219–225. [DOI] [PubMed] [Google Scholar]
- Murakami K, Karaki H, Urakawa N. (1987) Comparison of the inhibitory effects of nicorandil, nitroglycerin and isosorbide dinitrate on vascular smooth muscle of rabbit aorta. Eur J Pharmacol 141:195–202. [DOI] [PubMed] [Google Scholar]
- Nakamura T, Nakamura K, Lasser-Ross N, Barbara JG, Sandler VM, Ross WN. (2000) Inositol 1,4,5-trisphosphate (IP3)-mediated Ca2+ release evoked by metabotropic agonists and backpropagating action potentials in hippocampal CA1 pyramidal neurons. J Neurosci 20:8365–8376. [DOI] [PMC free article] [PubMed] [Google Scholar]
- Nattel S, Talajic M, Fermini B, Roy D. (1992) Amiodarone: pharmacology, clinical actions, and relationships between them. J Cardiovasc Electrophysiol 3:266–280. [Google Scholar]
- Nilius B, Owsianik G. (2010) Transient receptor potential channelopathies. Pflugers Arch 460:437–450. [DOI] [PubMed] [Google Scholar]
- Nixon GF, Mignery GA, Somlyo AV. (1994) Immunogold localization of inositol 1,4,5-trisphosphate receptors and characterization of ultrastructural features of the sarcoplasmic reticulum in phasic and tonic smooth muscle. J Muscle Res Cell Motil 15:682–700. [DOI] [PubMed] [Google Scholar]
- Otsu K, Willard HF, Khanna VK, Zorzato F, Green NM, MacLennan DH. (1990) Molecular cloning of cDNA encoding the Ca2+ release channel (ryanodine receptor) of rabbit cardiac muscle sarcoplasmic reticulum. J Biol Chem 265:13472–13483. [PubMed] [Google Scholar]
- Qu B, Al-Ansary D, Kummerow C, Hoth M, Schwarz EC. (2011) ORAI-mediated calcium influx in T cell proliferation, apoptosis and tolerance. Cell Calcium 50:261–269. [DOI] [PubMed] [Google Scholar]
- Rasmussen HS, Allen MJ, Blackburn KJ, Butrous GS, Dalrymple HW. (1992) Dofetilide, a novel class III antiarrhythmic agent. J Cardiovasc Pharmacol 20 (Suppl 2):S96–S105. [PubMed] [Google Scholar]
- Reed A, Huie K, Perloff ES, Cassella JV, Takahashi LH. (2012) Loxapine P-glycoprotein interactions in vitro. Drug Metab Lett 6:26–32. [DOI] [PubMed] [Google Scholar]
- Satoh H. (1993) Comparative electrophysiological and mechanical actions of ATP-sensitive potassium channel openers in canine Purkinje fibers. Gen Pharmacol 24:565–575. [DOI] [PubMed] [Google Scholar]
- Schwarz EC, Qu B, Hoth M. (2013) Calcium, cancer and killing: the role of calcium in killing cancer cells by cytotoxic T lymphocytes and natural killer cells. Biochim Biophys Acta 1833:1603–1611. [DOI] [PubMed] [Google Scholar]
- Sheldon RS, Hill RJ, Cannon NJ, Duff HJ. (1989) Amiodarone: biochemical evidence for binding to a receptor for class I drugs associated with the rat cardiac sodium channel. Circ Res 65:477–482. [DOI] [PubMed] [Google Scholar]
- Stoica S, Magoulas GE, Antoniou AI, Suleiman S, Cassar A, Gatt L, Papaioannou D, Athanassopoulos CM, Schembri-Wismayer P. (2016) Synthesis of minoxidil conjugates and their evaluation as HL-60 differentiation agents. Bioorg Med Chem Lett 26:1145–1150. [DOI] [PubMed] [Google Scholar]
- Taira N. (1989) Nicorandil as a hybrid between nitrates and potassium channel activators. Am J Cardiol 63:18J–24J. [DOI] [PubMed] [Google Scholar]
- Thastrup O, Cullen PJ, Drøbak BK, Hanley MR, Dawson AP. (1990) Thapsigargin, a tumor promoter, discharges intracellular Ca2+ stores by specific inhibition of the endoplasmic reticulum Ca2+-ATPase. Proc Natl Acad Sci USA 87:2466–2470. [DOI] [PMC free article] [PubMed] [Google Scholar]
- Thrasivoulou C, Millar M, Ahmed A. (2013) Activation of intracellular calcium by multiple Wnt ligands and translocation of β-catenin into the nucleus: a convergent model of Wnt/Ca2+ and Wnt/β-catenin pathways. J Biol Chem 288:35651–35659. [DOI] [PMC free article] [PubMed] [Google Scholar]
- Thümmler S, Duprat F, Lazdunski M. (2007) Antipsychotics inhibit TREK but not TRAAK channels. Biochem Biophys Res Commun 354:284–289. [DOI] [PubMed] [Google Scholar]
- Verkhratsky A, Shmigol A. (1996) Calcium-induced calcium release in neurones. Cell Calcium 19:1–14. [DOI] [PubMed] [Google Scholar]
- Vietri M, Pietrabissa A, Spisni R, Mosca F, Pacifici GM. (2000) Differential inhibition of hepatic and duodenal sulfation of (−)-salbutamol and minoxidil by mefenamic acid. Eur J Clin Pharmacol 56:477–479. [DOI] [PubMed] [Google Scholar]
- Wafford KA, Thompson SA, Thomas D, Sikela J, Wilcox AS, Whiting PJ. (1996) Functional characterization of human gamma-aminobutyric acidA receptors containing the alpha 4 subunit. Mol Pharmacol 50:670–678. [PubMed] [Google Scholar]
- Wang Q, Symes AJ, Kane CA, Freeman A, Nariculam J, Munson P, Thrasivoulou C, Masters JR, Ahmed A. (2010) A novel role for Wnt/Ca2+ signaling in actin cytoskeleton remodeling and cell motility in prostate cancer. PLoS One 5:e10456. [DOI] [PMC free article] [PubMed] [Google Scholar]
- Watanabe Y, Koide Y, Kimura J. (2006) Topics on the Na+/Ca2+ exchanger: pharmacological characterization of Na+/Ca2+ exchanger inhibitors. J Pharmacol Sci 102:7–16. [DOI] [PubMed] [Google Scholar]
- Wei WL, He H, Guan YY. (2003) Characteristic of Cl− current induced by ATP in bovine aortic endothelial cells. Drug Dev Res 58:53–56. [Google Scholar]
- Wilson C, Coldwell MC, Howlett DR, Cooper SM, Hamilton TC. (1988) Comparative effects of K+ channel blockade on the vasorelaxant activity of cromakalim, pinacidil and nicorandil. Eur J Pharmacol 152:331–339. [DOI] [PubMed] [Google Scholar]
- Winquist RJ, Heaney LA, Wallace AA, Baskin EP, Stein RB, Garcia ML, Kaczorowski GJ. (1989) Glyburide blocks the relaxation response to BRL 34915 (cromakalim), minoxidil sulfate and diazoxide in vascular smooth muscle. J Pharmacol Exp Ther 248:149–156. [PubMed] [Google Scholar]
- Yamada M, Isomoto S, Matsumoto S, Kondo C, Shindo T, Horio Y, Kurachi Y. (1997) Sulphonylurea receptor 2B and Kir6.1 form a sulphonylurea-sensitive but ATP-insensitive K+ channel. J Physiol 499:715–720. [DOI] [PMC free article] [PubMed] [Google Scholar]