Abstract
Aims/Hypothesis
Exercise benefits most, but not all, individuals with type 2 diabetes mellitus (T2DM). The aim of this study was to determine whether a proportion of individuals with T2DM would fail to demonstrate exercise-induced metabolic improvements. We hypothesized that this lack of response would be related to their skeletal muscle transcriptional profile.
Methods
42 participants with T2DM from the previously reported HART-D study underwent a 9-month supervised exercise intervention. We performed a principal components analysis to distinguish Responders from Non-Responders (n = 9 each) based on: decreases in (1) HbA1c, (2) %fat (3) BMI and (4) increase in skeletal muscle mtDNA. mRNA expression patterns in muscle tissue at baseline were assessed by microarray and qRT-PCR analysis in both groups.
Results
Of 186 genes identified by microarray analysis, 70% were up-regulated in Responders and down-regulated in Non-Responders. Several genes involved in substrate metabolism and mitochondrial biogenesis were significantly different (fold-change > 1.5, p < 0.05) between the groups at baseline, indicating a blunted oxidative capacity at baseline in Non-Responders.
Conclusions/Interpretations
These data suggest that a unique baseline expression pattern of genes involved in muscle fuel metabolism may predict an individual’s lack of exercise response in metabolic outcomes, thus allowing exercise interventions to be targeted to these individuals and aid in the identification of novel approaches to treat Non-Responders in the future.
Keywords: Exercise resistance, Type 2 diabetes mellitus, Human skeletal muscle, Gene expression
1. Introduction
As many as 40% of Americans will have T2DM within their lifetime [1]. Exercise benefits most individuals with T2DM; however, some people derive significantly less metabolic benefit. We and others have found that ~ 15–20% of individuals fail to increase muscle mitochondrial density and improve their glucose homeostasis and insulin sensitivity after supervised exercise interventions [2–4]. Recent findings have shown that a genetic predisposition to diabetes can modify ATP flux responses, whereby a single nucleotide polymorphism in a mitochondrial Complex I subunit gene reduces the ability to improve in vivo mitochondrial function with exercise [5]. Furthermore, VO2max responses to endurance exercise training can be predicted by a 29-gene RNA expression signature in the pre-trained muscle [6], while transcriptional data have demonstrated that individuals with insulin resistance have a reduced response of nuclear-encoded mitochondrial genes to acute exercise [7]. These authors have termed this phenomenon “exercise resistance”. We hypothesized that individuals with T2DM who did not significantly improve their metabolic status after nine months of supervised exercise would display a blunted response in the basal molecular signature of their skeletal muscle.
2. Research Design and Methods
2.1. Participants
Forty-two men and women from the previously reported HART- D [2] study completed (≥ 80% compliance) the present ancillary study that included the collection of muscle tissue samples at baseline. Details of the methods, inclusion/exclusion criteria and intervention are provided in the main outcomes papers [2,3]. The study was approved by the Pennington Biomedical Research Center IRB. Written informed consents were obtained.
2.2. Body Composition, Blood and Muscle Tissue Analyses
Body composition was measured by DXA (QDR 4500A, Hologic). Fasting blood samples [3] and muscle samples were obtained and assessed as previously described [2,3].
2.3. Mitochondrial DNA (mtDNA) Quantification
Total DNA was isolated from ~ 10 mg of skeletal muscle tissue and relative amounts of mtDNA and nuclear DNA were determined by Real Time qPCR as previously described [3].
2.4. RNA Isolation, Illumina Chips, qRT-PCR and Statistical Analysis
Total RNA was isolated from ~ 20 mg of skeletal muscle tissue using the RNeasy Fibrous Tissue kit (Qiagen). Near-whole-genome transcriptome analysis was performed using the Illumina bead-based technology and Sentrix Human-6 V2 Expression BeadChip (Illumina). One chip was used per participant. Quantile normalization, multiple imputation and log2-transformation were followed by gene differential analysis using the two-sample t-test. A heat-map was prepared using an unsupervised two-way cluster analysis.
2.5. Real-Time Quantitative RT-PCR (qRT-PCR)
Primer-probe sets were pre-designed Single Tube Taqman® gene expression assays. qRT-PCR reactions were performed using Taqman Fast Virus 1-step reaction mix Standard protocol (Life Technologies). Data were normalized by dividing the target gene by the geometric mean of internal control genes (Actin B and GAPDH).
Differences in gene expressions between Responders and Non-Responders were compared using a two-sample t-test. Statistical significance was set as type I error < 0.05.
3. Results and Discussion
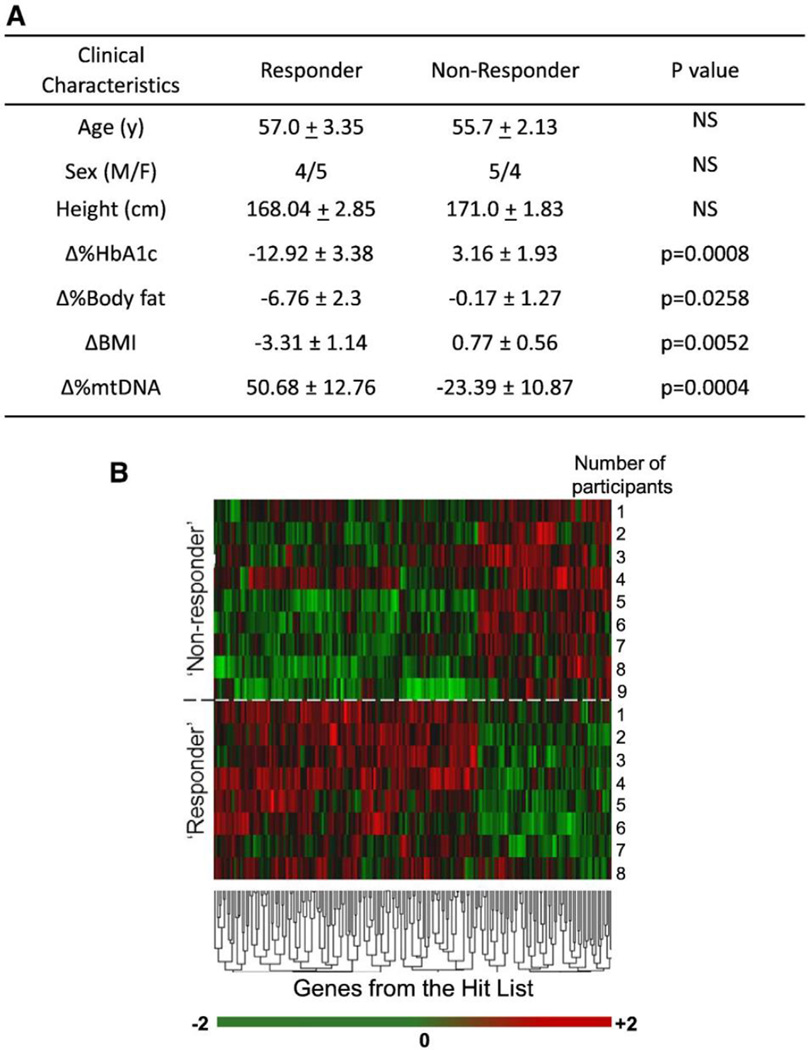
Participants were randomized to nine months of aerobic (AT), resistance (RT), combination training (ATRT), or a non-exercise control group. Since responses were similar across groups, the three exercise groups were collapsed. The control group was not evaluated for these analyses. In contrast to our findings, others report differences between AT and RT responses in obese adolescents [8], however this discrepancy may be due to cohort differences between the studies. Several primary metabolic parameters were used to determine the integrated response (or lack thereof) to exercise among study participants: (1) HbA1c, (2) muscle mtDNA content, (3) percent body fat and (4) BMI. We performed principal components analysis (PCA) based on these metabolic outcomes. Two distinct groups (n = 9 each) emerged from the PCA analysis and were categorized as ‘Non-Responders’ and ‘Responders’ based on Eigenvalue (data not shown). A Responder was defined a priori as having decreased HbA1c, percent body fat and BMI, and increased muscle mtDNA content.
In contrast to Responders, Non-Responders did not exhibit significant decreases in HbA1c levels, percent body fat or BMI. Intriguingly, Non-Responders decreased mtDNA content after exercise compared with Responders. There were no significant differences between the groups based on gender or age (Fig. 1A). These findings support the premise of “exercise resistance”, and validate the use of the metabolic panel examined herein as a means of defining “exercise resistance” in individuals with T2DM.
Fig. 1.
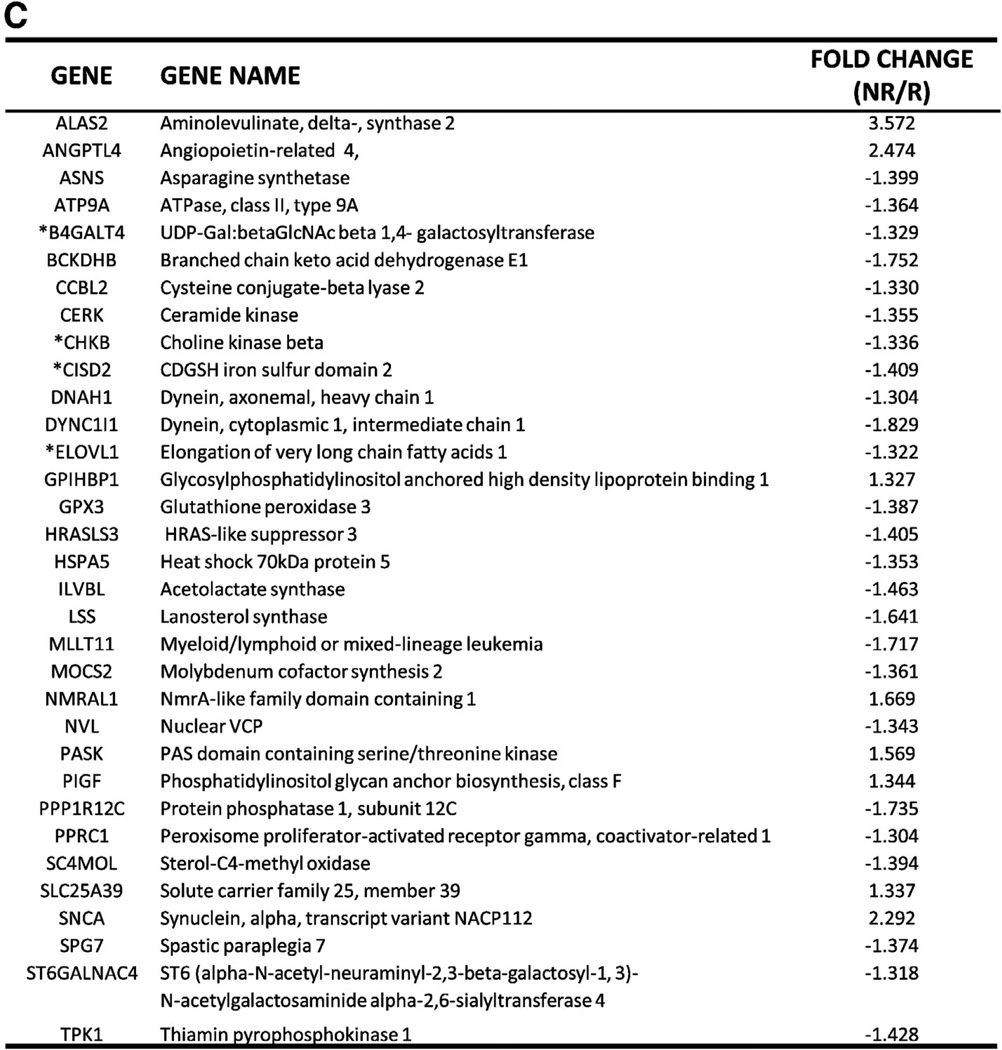
(A) Changes in metabolic parameters following nine months of supervised exercise and clinical characteristics. The changes (or lack thereof) in HbA1c, %body fat, BMI and mtDNA content were used in PCA analysis to distinguish Responders from Non-Responders. Data are presented as mean ± SEM. (B) Unsupervised cluster analysis of Illumina transcription arrays in muscle tissue mRNA at baseline generated a ‘hit list’ of 186 genes. Each color represents the log2 ratio of the (Responder gene expression/Non-Responder gene expression) of a particular gene in each participant. The fold change cut-off value was 1.3. False Discovery Rate (FDR) was 0.05. Each column shows data from a specific gene and each row shows data from a single participant. (Data from one Responder were not included due to poor quality.) Green indicates down-regulation and red indicates up-regulation. The values in the heat map range between −2 and +2. Expression ratios range from −2.3-fold in one direction to 3.6-fold in the other. The dendrogram reflects the degree of correlation of the genes assessed by the hierarchical clustering. (C) Subset of genes involved in substrate metabolism and mitochondrial function from the ‘hit list’. Functions were determined with Ingenuity Pathway Analysis (IPA) and available gene ontology. Of 186 genes, 48 genes were classified as hypothetical/pseudogenes or small nucleolar RNAs (data not shown). 33 genes from the ‘hit list’ were functionally classified as being involved in substrate metabolism and mitochondrial function. * indicates genes validated by qRT-PCR.
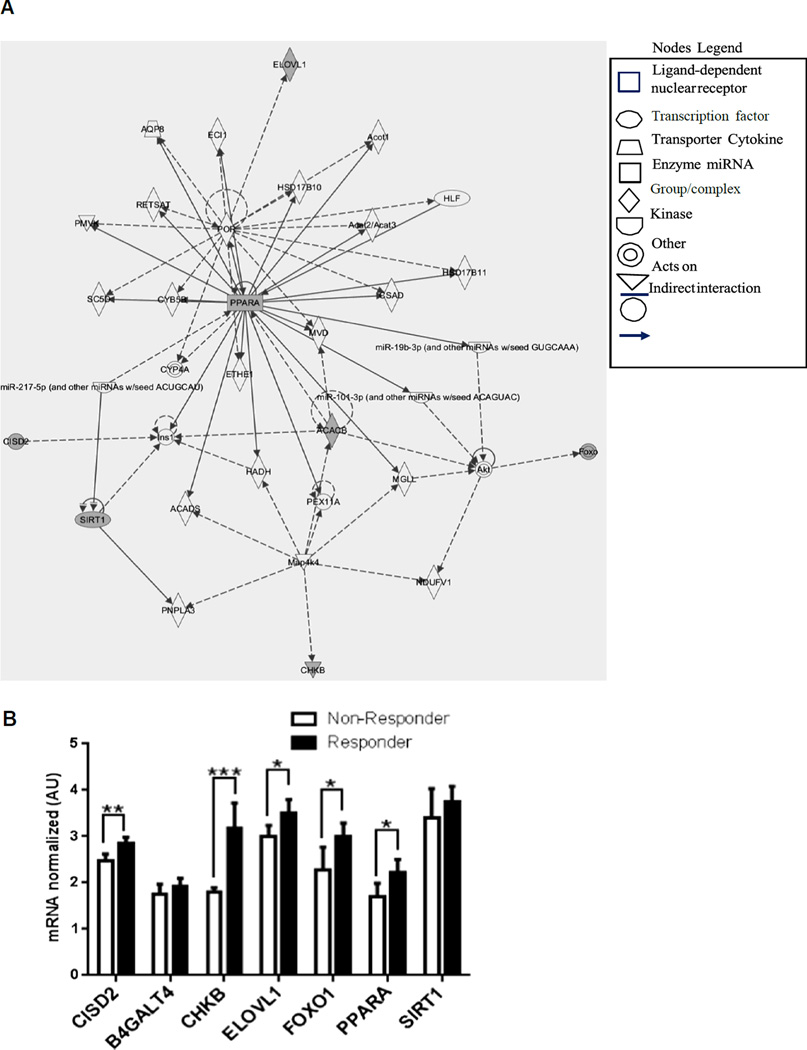
Microarray analysis of baseline gene expression in skeletal muscle confirmed the distinction between Non-Responders and Responders. A ‘hit list’ of 186 genes generated from this data showed differential mRNA expressions between the two groups, with down-regulation of ~ 70% of genes on the ‘hit list’ observed in Non-Responders (Fig. 1B). Even more compelling was the discovery that ~ 25% of these differentially expressed genes were involved in substrate metabolism and mitochondrial biogenesis/function (Fig. 1C). Admittedly, certain classes of low expression genes may be absent from this method of analysis due to detection limitations. Ingenuity Pathway Analysis (IPA) was used to define and depict these functional associations of genes from the ‘hit list’ and the literature, as well as pathways by which these genes are connected (Fig. 2A). Similar analyses by others have identified disparities in transcriptomes of pre-trained skeletal muscle, which suggested that heterogeneity of hypertrophic responses to resistance training was predetermined [9].
Fig. 2.
(A) Ingenuity Pathway Analysis (IPA) shows the relationships among genes expressed differentially between Responders and Non-Responders, from the microarray data and from the literature. Genes analyzed by qRT-PCR are shaded in gray and those from the literature are shown in white. The fold change cut-off value was 1.3. (B) A selection of genes that were verified in the literature as being involved in substrate metabolism and mitochondrial biogenesis were assessed by qRT-PCR for validation. Target genes for qRT-PCR analysis were selected based on known biological function according to the literature, as well as those found both in the ‘hit list’ and the IPA analysis. Other target genes were selected from the IPA analysis based on pathways associated with genes involved in substrate metabolism and mitochondrial function. qRT-PCR data are presented as mean ± SEM. *p < 0.05, **p < 0.01, ***p < 0.001. CISD2, CDGSH iron sulfur domain 2; B4GALT4, UDP-Gal:betaGlcNAcbeta1,4-galactosyltransferase, polypeptide 4; CHKB, choline kinase beta; ELOVL1, elongation of very long chain fatty acids; FOXO1, forkhead box protein O1; PPARα, peroxisome proliferator-activated receptor alpha; SIRT1, sirtuin 1.
qRT-PCR analyses of a selection of genes from both the ‘hit list’ and IPA, revealed five of seven genes analyzed were significantly down-regulated in Non-Responders compared with Responders (Fig. 2B). These data suggest that the lack of response in Non-Responders is linked to down-regulation of exercise-responsive genes. PPARα and ELOVL1, which play a role in lipid metabolism, as well as CHKB, CISD2 and FOXO1, which are involved in mitochondrial function, displayed decreased mRNA expressions in Non-Responders vs. Responders. Interestingly, FOXO1 which is up-regulated in skeletal muscle in response to contractile signals [10], was identified by IPA analysis and was also significantly down-regulated in Non-Responders.
The down-regulation of exercise- and substrate metabolism-linked genes in Non-Responders strongly suggests that the lack of response to exercise in these individuals is transcriptionally modulated. Barres et al. reported that a single, acute bout of exercise is sufficient to induce hypomethylation of the promoters of genes involved in mitochondrial function and fuel usage, resulting in increased mRNA expressions [11]. In support of this programmed response, McGee et al. reported increased histone acetylation associated with transcriptional elongation, immediately following acute exercise [12]. Furthermore, a six-month long exercise intervention resulted in differential DNA methylation profiles in skeletal muscle [13]. Thus, the disparate gene expressions observed between Non- Responders and Responders may be the result of differentially modified chromatin. Our current findings point toward a basal molecular signature of human skeletal muscle as a key factor in the ability to respond to exercise.
4. Conclusions
In this study of individuals with T2DM, we distinguished Non-Responders from Responders following a 9-month supervised exercise intervention based on changes in a pre-defined set of metabolic outcomes. The expressions of exercise-responsive genes reflected in quantifiable metabolic parameters suggest that identification and subsequent targeting of transcriptional biomarkers linked to “exercise resistance” could effectively translate into measurable physiological and metabolic responses.
While very little is known about the underlying mechanisms of “exercise resistance”, substantial evidence suggests that this phenomenon is heritable [5–7]. The particular strength of this study is the novelty of the discovery of differential basal muscle gene expressions linked to “exercise resistance”. These findings provide compelling insight into the molecular signature and potential predictability of the programmed failure to respond to exercise. With the gradual shift toward a more personalized approach to patient care, the elucidation of the mechanisms of “exercise resistance” may provide a pivotal step in revolutionizing the treatment of T2DM. Understanding the programmed lack of response to exercise in some individuals with T2DM will be critical to the development of therapeutics that will circumvent the “transcriptional block” to the benefits of exercise.
Acknowledgments
Funding
This work was partially funded by an ADA Junior Faculty Award #7-13-JF-53 (L.M.S.), an institutional grant to S.R.S., a NORC Center Grant (#2P30DK072476; PI-S.R.S.) and an unrestricted research funding grant from The Coca-Cola Company (T.S.C.). Further funding was contributed by Dr. Donna Ryan from the Pennington Biomedical Research Center Clinical and Translational Research Fund.
The authors would like to thank the volunteers from the study for their participation.
Abbreviations
- AT
aerobic training
- IPA
ingenuity pathway analysis
- PCA
principal components analysis
- RT
resistance training
- SEM
structural equation model
- T2DM
type 2 diabetes mellitus
Footnotes
Disclosure Statement: The authors have nothing to disclose.
Author Contributions
Dr. Lauren M. Sparks is the guarantor of this work and had full access to all data in the study and takes responsibility for the integrity of the data and the accuracy of data analysis.
N.A.S. researched data, contributed to analysis and interpretation of the data and wrote the manuscript; H.X. researched data, contributed to the study concept, design, analysis and interpretation of the data; N.M.J. researched data and reviewed and edited the manuscript; T.S.C. contributed to the study concept and design and reviewed and edited the manuscript; S.R.S. contributed to the study concept, design, analysis and interpretation of the data and reviewed and edited the manuscript; L.M.S. researched data, contributed to the study concept, design, analysis and interpretation of the data and wrote the manuscript.
Conflict of Interest
There are no conflicts of interest.
REFERENCES
- 1.Gregg EW, Zhuo X, Cheng YJ, Albright AL, Narayan KM, Thompson TJ. Trends in lifetime risk and years of life lost due to diabetes in the USA, 1985–2011: a modelling study. Lancet Diabetes Endocrinol. 2014;11:867–874. doi: 10.1016/S2213-8587(14)70161-5. [DOI] [PubMed] [Google Scholar]
- 2.Church TS, Blair SN, Cocreham S, Johannsen N, Johnson W, Kramer K, et al. Effects of aerobic and resistance training on hemoglobin A1c levels in patients with type 2 diabetes: a randomized controlled trial. JAMA. 2010;304:2253–2262. doi: 10.1001/jama.2010.1710. [DOI] [PMC free article] [PubMed] [Google Scholar]
- 3.Sparks LM, Johannsen NM, Church TS, Earnest CP, Moonen-Kornips E, Moro C, et al. Nine months of combined training improves ex vivo skeletal muscle metabolism in individuals with type 2 diabetes. J Clin Endocrinol Metab. 2013;98:1694–1702. doi: 10.1210/jc.2012-3874. [DOI] [PMC free article] [PubMed] [Google Scholar]
- 4.Bouchard C, Blair SN, Church TS, Earnest CP, Hagberg JM, Hakkinen K, et al. Adverse metabolic response to regular exercise: is it a rare or common occurrence? PLoS One. 2012;7:e37887. doi: 10.1371/journal.pone.0037887. [DOI] [PMC free article] [PubMed] [Google Scholar]
- 5.Kacerovsky-Bielesz G, Chmelik M, Ling C, Pokan R, Szendroedi J, Farukuoye M, et al. Short-term exercise training does not stimulate skeletal muscle ATP synthesis in relatives of humans with type 2 diabetes. Diabetes. 2009;58:1333–1341. doi: 10.2337/db08-1240. [DOI] [PMC free article] [PubMed] [Google Scholar]
- 6.Timmons JA, Knudsen S, Rankinen T, Koch LG, Sarzynski M, Jensen T, et al. Using molecular classification to predict gains in maximal aerobic capacity following endurance exercise training in humans. J Appl Physiol. 2010;108:1487–1496. doi: 10.1152/japplphysiol.01295.2009. [DOI] [PMC free article] [PubMed] [Google Scholar]
- 7.De Filippis E, Alvarez G, Berria R, Cusi K, Everman S, Meyer C, et al. Insulin-resistant muscle is exercise resistant: evidence for reduced response of nuclear-encoded mitochondrial genes to exercise. Am J Physiol Endocrinol Metab. 2008;294:E607–E614. doi: 10.1152/ajpendo.00729.2007. [DOI] [PubMed] [Google Scholar]
- 8.Sigal RJ, Alberga AS, Goldfield GS, Prud'homme D, Hadjiyannakis S, Gougeon R, et al. Effects of aerobic training, resistance training, or both on percentage body fat and cardiometabolic risk markers in obese adolescents: the healthy eating aerobic and resistance training in youth randomized clinical trial. JAMA Pediatr. 2014;168:1006–1014. doi: 10.1001/jamapediatrics.2014.1392. [DOI] [PubMed] [Google Scholar]
- 9.Thalacker-Mercer A, Stec M, Cui X, Cross J, Windham S, Bamman M. Cluster analysis reveals differential transcript profiles associated with resistance training-induced human skeletal muscle hypertrophy. Physiol Genomics. 2013;45:499–507. doi: 10.1152/physiolgenomics.00167.2012. [DOI] [PMC free article] [PubMed] [Google Scholar]
- 10.Russell AP, Hesselink MK, Lo SK, Schrauwen P. Regulation of metabolic transcriptional co-activators and transcription factors with acute exercise. FASEB J. 2005;19:986–988. doi: 10.1096/fj.04-3168fje. [DOI] [PubMed] [Google Scholar]
- 11.Barres R, Yan J, Egan B, Treebak JT, Rasmussen M, Fritz T, et al. Acute exercise remodels promoter methylation in human skeletal muscle. Cell Metab. 2012;15:405–411. doi: 10.1016/j.cmet.2012.01.001. [DOI] [PubMed] [Google Scholar]
- 12.McGee SL, Fairlie E, Garnham AP, Hargreaves M. Exercise-induced histone modifications in human skeletal muscle. J Physiol. 2009;587:5951–5958. doi: 10.1113/jphysiol.2009.181065. [DOI] [PMC free article] [PubMed] [Google Scholar]
- 13.Nitert MD, Dayeh T, Volkov P, Elgzyri T, Hall E, Nilsson E, et al. Impact of an exercise intervention on DNA methylation in skeletal muscle from first-degree relatives of patients with type 2 diabetes. Diabetes. 2012;61:3322–3332. doi: 10.2337/db11-1653. [DOI] [PMC free article] [PubMed] [Google Scholar]


