Abstract
The present animal study investigated whether oral intake of synthetic bone mineral (SBM) improves peri-implant bone formation and bone micro architecture (BMA). SBM was used as an intervention experimental diet and AIN-93M was used as a control. The SBM was prepared by mixing dicalcium phosphate dihydrate (CaHPO4·2H2O) and magnesium and zinc chlorides (MgCl2 and ZnCl2, respectively), and hydrolyzed in double-distilled water containing dissolved potassium carbonate and sodium fluoride. All rats were randomly allocated into one of two groups: a control group was fed without SBM (n = 18) or an experimental group was fed with SBM (n = 18), at seven weeks old. At 9 weeks old, all rats underwent implant surgery on their femurs under general anesthesia. The implant was inserted into the insertion socket prepared at rats’ femur to a depth of 2.5 mm by using a drill at 500 rpm. Nine rats in each group were randomly selected and euthanized at 2 weeks after implantation. The remaining nine rats in each group continued their diets, and were euthanized in the same manner at 4 weeks after implantation. The femur, including the implant, was removed from the body and implant was pulled out by an Instron universal testing machine. After the implant removal, BMA was evaluated by bone surface ratio (BS/BV), bone volume fraction (BV/TV), trabecular thickness (TbTh), trabecular number (TbN), trabecular star volume (Vtr), and micro-CT images. BS/BV, BV/TV, TbTh and Vtr were significantly greater in the rats were fed with SBM than those were fed without SBM at 2 and 4 weeks after implantation (P < 0.05). The present results revealed that SBM improves the peri-implant formation and BMA, prominent with trabecular bone structure. The effect of SBM to improve secondary stability of the implant, and shortening the treatment period should be investigated in the future study.
Keywords: Animal study, Implant, Dietary supplement, Bone quality
Introduction
It is estimated that over 10 million osteoporosis patients exist in Japan1, 2), and the prevalence of osteoporosis in 70s is approximately 30% in females, and 10% in males2, 3). Furthermore, the number of patients is predicted to increase as the aging of the society accelerates4, 5).
Osteoporosis is a disease that reduces bone strength due to decreasing bone metabolism6). Bone strength can be characterized by both bone mineral density (BMD) and bone quality (BQ), according to the National Institutes of Health consensus development project7, 8). BMD is the mineral content per bone volume (BV), and BQ includes bone micro architecture (BMA), bone turnover, damage accumulation, and mineralization7–9).
In osteoporosis patients, a decrease in bone metabolism adversely affects bone formation and strength of the peri-implant bone10, 11), resulting in a longer healing period12,13). This healing period poses several difficulties for individuals with a large edentulous area, and decreases their quality of life. Thus, shortening the healing period and accelerating final prosthesis placement after surgery is clinically very important.
One of the methods of shortening the healing period for dental implant treatment is increasing the secondary stability of the implant. To facilitate this, the BMA formed in the peri-implant area needs to be improved.
One method for improving BMA is by the oral intake of synthetic bone mineral (SBM)14). LeGeros developed a calcium phosphate-based supplement incorporating magnesium (Mg), zinc (Zn), fluoride (F), and carbonate to promote bone formation and inhibit bone resorption for osteoporosis15). We previously reported that SBM accelerates bone formation in normal rats both with and without implant placement16, 17). The present study investigated whether the oral intake of SBM improves peri-implant bone formation and BMA of the ovariectomized rat, by evaluating bone surface ratio (BS/BV), bone volume fraction (BV/TV), trabecular thickness (TbTh), trabecular number (TbN), trabecular star volume (Vtr), and micro-CT images.
Materials and methods
Animal diet
AIN-93M, developed by the American Institute of Nutrition Committee and prepared by the Oriental Yeast Co, Ltd. (Tokyo, Japan), was used as the control diet. The experimental diet consisted of AIN-93M and SBM. The SBM was prepared according to LeGeros’ protocol15). Briefly, a mixture of dicalcium phosphate dihydrate (CaHPO4·2H2O) and magnesium and zinc chlorides (MgCl2 and ZnCl2, respectively) were hydrolyzed in double-distilled water containing dissolved potassium carbonate and sodium fluoride. SBM was then added to AIN-93M, the mineral composition of which was adjusted by Mijares’ method14). The compositions of the diets with and without SBM are shown in Table 1.
Table 1.
Mineral compositions (wt.%) of diets with and without SBM
| Diet composition | With SBM | Without SBM |
|---|---|---|
| Calcium (Ca) | 0.74 | 0.51 |
| Phosphorus (P) | 0.48 | 0.30 |
| Magnesium (Mg) | 0.35 | 0.05 |
| Zinc (Zn) | 0.036 | 0.003 |
| Fluorine (F) | 0.005 | 0 |
| Carbonate (CO3) | 0.12 | 0 |
| Sodium (Na) | 0.13 | 0.10 |
| Potassium (K) | 0.75 | 0.35 |
| Chlorine (Cl) | 0.17 | 0.16 |
SBM: synthetic bone mineral
Animal experiment
The study protocol was approved by the Ethical Committee of Nihon University (AP14-MD018). Thirty-six 6-week-old female ovariectomized (OVX) Wistar rats (Sankyo Labo Service, Tokyo, Japan) were included in the study. After consuming a diet without SBM for 1 week to acclimate to the changes in their environment, 7-week-old rats were randomly allocated into one of two groups: a control group was fed without SBM (n = 18) or an experimental group was fed with SBM (n = 18). From each group, all rats were used for BS/BV, BV/TV, TbTh, TbN, and Vtr analyses. Rats were housed individually, food and water were given ad libitum, and temperature and relative humidity were maintained at 20 °C ± 1°C and 50 % ± 1 %, respectively. At 9 weeks old, all rats underwent implant surgery on their femurs while under general anesthesia administered via an intramuscular injection of medetomidine (0.15 mg/kg; Domitor®, Orion, Turku, Finland), midazolam (2.0 mg/kg; Midazolam Sandoz®, Sandoz Inc., Quebec, Canada), and butorphanol (2.5 mg/kg; Vetorphale®, Meiji Seika, Ltd., Tokyo, Japan). One operator prepared insertion socket in the femur 1.2 mm in diameter and 2.5-mm deep using a drill with a 1.2-mm diameter. Cylindrical implants 1.2 mm in diameter and 4.0-mm long were prepared from pure titanium (CLINE. Co., Ltd., Tokyo, Japan), sandblasted with 110-μm diameter AlO2, cleaned with an ultrasonic device, and autoclaved. The implants were then inserted into the insertion socket to a depth of 2.5 mm using a drill at a speed of 500 rpm18–20), and saline irrigation was used to avoid heating the bone. Nine rats in each group were randomly selected and euthanized at 2 weeks after implantation. The remaining nine rats in each group continued their diets, and were euthanized in the same manner at 4 weeks after implantation. The femur, including the implant, was removed from the body and the implant was pulled out by an Instron universal testing machine (TG-5k, Minebea Co., Kanagawa, Japan). After the implant was removed, the BS/BV (1/mm), BV/TV (%), TbTh (μm), TbN (1/mm), Vtr (mm3), and micro-CT image were assessed.
BMA measurement
After removal of the implant, the femur was subjected to micro-computed tomography (mCT) scanning. mCT was performed with an R_mCT2 device (Rigaku, Tokyo, Japan) using a 90-kV anode electrical current at a 30-μm resolution. The isotropic voxel resolution was 30 μm × 30 μm × 30 μm. To verify new bone formation around the implant, a 1.5-mm2 area surrounding the bone where the 1.2-mm implant had been placed was scanned from a depth of 0.5-mm to 1.0-mm depth from the inner cortical bone. Next, the trabecular structure of the 1.5 mm × 1.5 mm × 0.5 mm volume of peri-implant bone was assessed by the TRI/3D-BON image analyzer (Ratoc System Engineering, Tokyo, Japan) (Fig. 1). Analysis of BS/BV (1/mm), BV/TV (%), TbTh (μm), TbN (1/mm), Vtr (mm3), and micro-CT image was performed for each group containing nine rats (Fig. 2).
Figure 1.
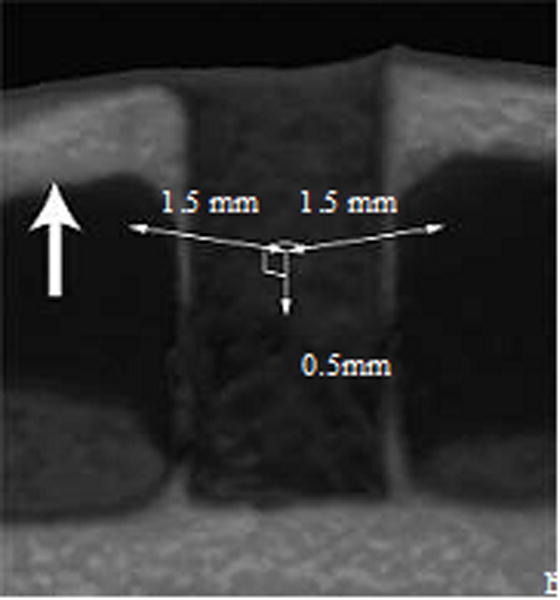
Scanning image of the peri-implant bone for BV/TV, BS/BV, TbTh, Vtr and TbN analyses. A 1.5-mm2 area surrounding the bone socket where a 1.2-mm implant had been placed was three-dimensionally scanned from a depth of 0.5-mm to 1.0-mm from the inner cortical bone, resulting in a 1.5 × 1.5 × 0.5-mm volume of bone scanned.
Figure 2.
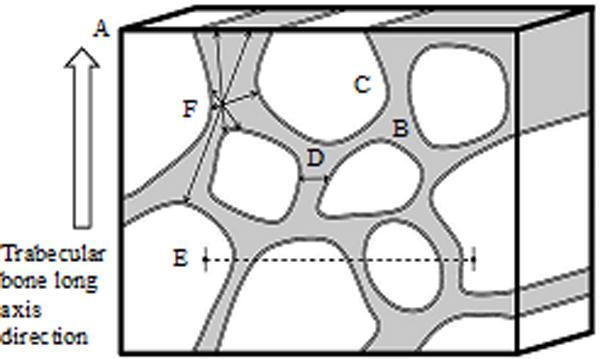
Bone quality measurement. A. Total volume (TV) is the volume of the entire figure, outlined by the bold black line; B. Bone volume (BV) is the volume of the grey area; C. Bone surface is the surface area within the double lines; D. Trabecular thickness (TbTh) is the distance between the two arrows; E. Trabecular number (TbN) is the number of trabecular structures in the dashed line; F. Trabecular star volume (Vtr) is indicated by the radial arrows.
Statistical analysis
Between- and within-group differences in BS/BV, BV/TV, TbTh, TbN, and Vtr at 2 and 4 weeks after implantation were analyzed by the Mann-Whitney U test. All statistical analyses were performed using the statistical package PASW Statistics (Version 18.0, SPSS, Chicago, IL, USA). P values < 0.05 were considered statistically significant.
Results
BV/TV
BV/TV results are shown in Fig. 3A. The BV/TV of the rats were fed with SBM was significantly higher than that of the rats were fed without SBM at 2 and 4 weeks after implantation (P < 0.05). The BV/TV of the SBM group at 2 weeks after implantation approached that of the non-SBM group at 4 weeks. Within both groups, the BV/TV significantly increased from 2 weeks to 4 weeks after implantation (P < 0.05).
Figure 3. Between- and within-group comparisons of BV/TV and BS/BV.
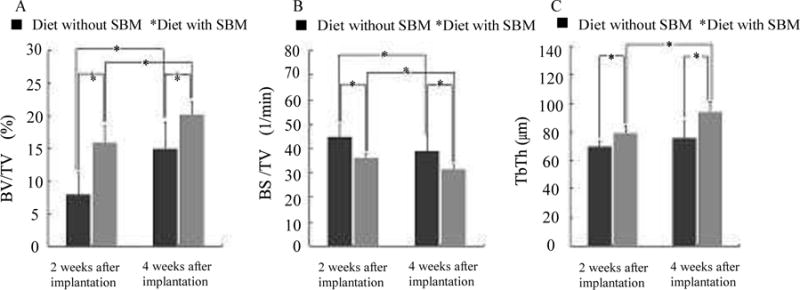
Results of BV/TV (A): BV/TV was significantly greater in the rats were fed SBM than in those were not fed SBM at 2 and 4 weeks after implantation (P < 0.05). BV/TV also significantly increased between 2 and 4 weeks after implantation in both groups (P < 0.05). Results of BS/BV (B): BS/BV was significantly greater in the rats were fed SBM than in those were not fed SBM at 2 and 4 weeks after implantation (P < 0.05). BS/BV also significantly increased between 2 and 4 weeks after implantation in both groups (P < 0.05). Results of TbTh(C): TbTh was significantly greater in the rats were fed SBM than in those were not fed SBM at 2 and 4 weeks after implantation (P < 0.05). In the SBM group, TbTh significantly increased from 2 to 4 weeks after implantation (P < 0.05). In the non-SBM group, the increase in TbTh from 2 to 4 weeks after implantation was not significant (P > 0.05).
BS/BV
BS/BV results are shown in Fig. 3B. The BS/BV of the rats were fed with SBM was significantly lower than that of the rats were fed without SBM at 2 and 4 weeks after implantation (P < 0.05). Within both groups, the BS/BV significantly decreased from 2 weeks to 4 weeks after implantation (P < 0.05).
TbTh
TbTh results are shown in Fig. 3C. The TbTh of the rats were fed with SBM was significantly higher than that of the rats were fed without SBM at 2 and 4 weeks after implantation (P < 0.05). In the rats were fed with SBM, TbTh significantly increased from 2 weeks to 4 weeks after implantation (P < 0.05); however, this increase was not significant in the rats were fed without SBM (P > 0.05).
Vtr
Vtr results are shown in Fig. 4A. The Vtr of the rats were fed with SBM was significantly higher than that of the rats were fed without SBM at 2 and 4 weeks after implantation (P < 0.05). There were no significant increases in Vtr from 2 to 4 weeks after implantation in either of the groups (P > 0.05).
Figure 4. Between- and within-group comparisons of Vtr and TbN.
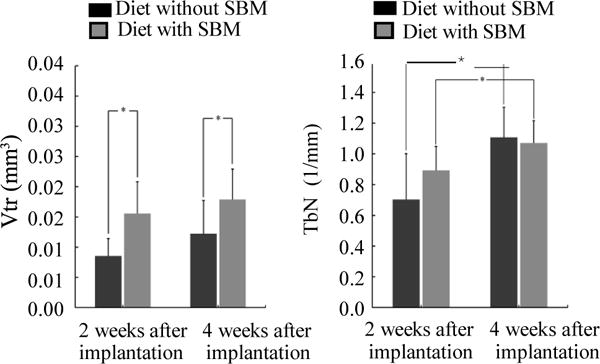
Results of Vtr(A): Vtr was significantly greater in the rats were fed SBM than in those were not fed SBM at 2 and 4 weeks after implantation (P < 0.05). There were no significant increases in Vtr from 2 to 4 weeks after implantation in either of the groups (P > 0.05). Results of TbN (B): TbN was not significantly greater in the rats were fed SBM than in those were not fed SBM at 2 and 4 weeks after implantation (P > 0.05). TbN also significantly increased between 2 and 4 weeks after implantation in both groups (P < 0.05).
TbN
TbN results are shown in Fig. 4B. The TbN of the rats were fed with SBM was no significant increases than that of the rats were fed without SBM at 2 and 4 weeks after implantation. Within both groups, the increase in TbN from 2 to 4 weeks after implantation was statistically significant (P > 0.05)
Micro-CT image
The micro-CT images of the rats were fed without SBM revealed no bone formation at 2 weeks after implantation (Fig. 5A). However, bone formation was clearly observed of the rats were fed with SBM at 2 and 4 weeks after implantation and of the rats were fed without SBM at 4 weeks after implantation (Fig. 5B, C and D), in irregular bands around the implants.
Figure 5.
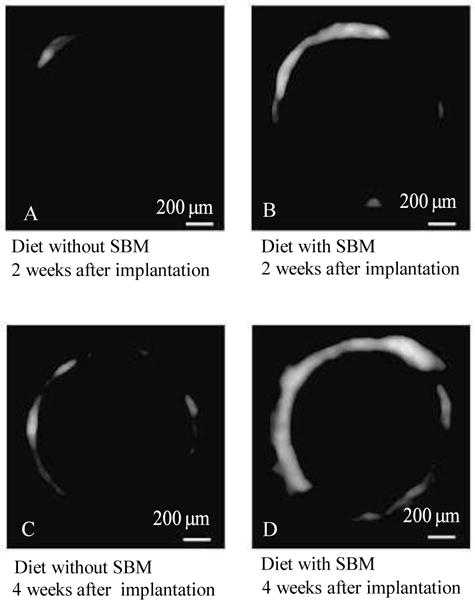
micro-CT image. The micro-CT images of the rats were fed without SBM revealed no bone formation at 2 weeks after implantation (A). However, bone formation was clearly observed of the rats were fed with SBM at 2 and 4 weeks after implantation and of the rats were fed without SBM at 4 weeks after implantation (B, C, and D), in irregular bands around the implants.
Discussion
The purpose of the present study was to investigate if the peri-implant BMA was improved after oral SBM intake.
Significant differences were observed in BV/TV (%), BS/BV (1 mm), TbTh (μm), and Vtr (mm3) in the rats were fed with SBM compared with those were fed without SBM, suggesting that SBM intake improves peri-implant BMA.
Because the only difference in intervention between the groups was the presence of SBM in the diet, the observed differences in peri-implant BV/TV may be due to the components of the SBM. The SBM-containing had 7 times the amount of Mg and 12 times the amount of Zn compared with the control diet. Furthermore, the SBM-containing diet contained F, which was absent from the control diet. Mg, Zn, and F play important roles in bone formation and resorption21–24). Mg deficiency results in bone loss25). Zn reduces cathepsin and carbonic anhydrase mRNA expression, inhibiting osteoclast development22). F promotes osteoblast differentiation by increasing total collagen content and ALP activity23,24). Mijares et al. reported that the mechanism underlying SBM’s effect may be explained in terms of the individual and combined effects of Mg, Zn, and F on bone cell activities, such as bone formation and resorption, when released from the SBM or when incorporated into newly formed bone15). These reports may explain why the rats were fed the SBM-supplemented diet had greater BV/TV than the control rats. The BV/TV results showed a decrease in the trabecular space and an increase in BV, leading to a significantly lower BS/BV in the rats were fed SBM compared with those were not fed SBM; in addition, significant differences in BV/TV and BS/BV were observed at 4 weeks after implantation compared with 2 weeks. This is thought to be due to the growth of trabecular bone structure over time. This finding could be partially explained by the results micro-CT image, which reveals the dynamics of bone formation. The BV/TV and BS/BV results demonstrated that the trabecular bone structure was denser in the rats were fed with SBM, resulting in higher TbTh. The within-group comparison showed that the TbTh of the rats were fed SBM was higher at 4 weeks after implantation than 2 weeks, but no significant difference was observed in the rats were not fed SBM, despite an increasing trend. This increase in TbTh may be due to the effect of SBM on trabecular bone structure growth, as observed in the SBM group. The BV/TV, BS/BV, and TbTh results suggested an improvement in trabecular bone structure continuity in the rats were fed SBM. Thus, Vtr was higher in the rats were fed SBM compared with those were not fed SBM. Although the within-group comparison at 2 and 4 weeks after implantation showed an increasing trend of Vtr, no significant differences were observed in this period. This may be due to the small number of samples included, and further investigation with more samples may be required. There was no significant difference in TbN between the two groups. This may be because SBM exerted its effect on the trabecular bone structure, and not on an increase of number of trabeculae. Within-group comparison of TbN showed that TbN was higher at 4 weeks after implantation than 2 weeks, in both groups, likely due to the increase in the number of trabeculae during growth. Taken together, the present results revealed that SBM improves the peri-implant formation and BMA, prominent with trabecular bone structure. The effect of SBM to improve the secondary stability of the implant, and shortening of the required treatment period should be investigated in the future study.
Acknowledgments
This work was supported in part by KAKENHI (15H06645) from the Japan Society for the Promotion of science and NIH NIAMS 5R01 AR056208 (Y. Zhang).
Footnotes
Conflict of interest statement
The authors have declared that no COI exists.
References
- 1.Yoshimura N, Muraki S, Oka H, Mabuchi A, En-Yo Y, Yoshida M, Saika A, Yoshida H, Suzuki T, Yamamoto S, Ishibashi H, Kawaguchi H, Nakamura K, Akune T. Prevalence of knee osteoarthritis, lumbar spondylosis, and osteoporosis in Japanese men and women: the research on osteoarthritis/osteoporosis against disability study. J Bone Miner Metab. 2009;27:620–628. doi: 10.1007/s00774-009-0080-8. [DOI] [PubMed] [Google Scholar]
- 2.Orimo H, Nakamura T, Hosoi T, Iki M, Uenishi K, Endo N, Ohta H, Shiraki M, Sugimoto T, Suzuki T, Soen S, Nishizawa Y, Hagino H, Fukunaga M, Fujiwara S. Japanese 2011 guidelines for prevention and treatment of osteoporosis–executive summary. Arch Osteoporos. 2012;7:3–20. doi: 10.1007/s11657-012-0109-9. [DOI] [PMC free article] [PubMed] [Google Scholar]
- 3.Yoshimura N, Muraki S, Oka H, Kawaguchi H, Nakamura K, Akune T. Cohort profile: research on Osteoarthritis/Osteoporosis Against Disability study. Int J Epidemiol. 2010;39:988–995. doi: 10.1093/ije/dyp276. [DOI] [PubMed] [Google Scholar]
- 4.Sakuma M, Endo N, Oinuma T, Miyasaka D, Oguma Y, Imao K, Koga H, Tanabe N. Incidence of osteoporotic fractures in Sado, Japan in 2010. J Bone Miner Metab. 2014;32:200–205. doi: 10.1007/s00774-013-0486-1. [DOI] [PubMed] [Google Scholar]
- 5.Nakamura T, Shiraki M, Fukunaga M, Tomomitsu T, Santora AC, Tsai R, Fujimoto G, Nakagomi M, Tsubouchi H, Rosenberg E, Uchida S. Effect of the cathepsin K inhibitor odanacatib administered once weekly on bone mineral density in Japanese patients with osteoporosis–a double-blind, randomized, dose-finding study. Osteoporos Int. 2014;25:367–376. doi: 10.1007/s00198-013-2398-2. [DOI] [PubMed] [Google Scholar]
- 6.Report of a WHO Study Group. Assessment of fracture risk and its application to screening for postmenopausal osteoporosis. World Health Organ Tech Rep Ser. 1994;843:1–129. [PubMed] [Google Scholar]
- 7.NIH Consens Statement. Osteoporosis prevention, diagnosis, and therapy. NIH Consens Statement. 2000;17:1–45. [PubMed] [Google Scholar]
- 8.NIH Consensus Development Panel on Osteoporosis Prevention, Diagnosis, and Therapy. Osteoporosis prevention, diagnosis, and therapy. JAMA. 2001;285:785–795. [Google Scholar]
- 9.McDonnell P, McHugh PE, O’Mahoney D. Vertebral osteoporosis and trabecular bone quality. Ann Biomed Eng. 2007;35:170–189. doi: 10.1007/s10439-006-9239-9. [DOI] [PubMed] [Google Scholar]
- 10.Pan J, Shirota T, Ohno K, Michi K. Effect of ovariectomy on bone remodeling adjacent to hydroxyapatite-coated implants in the tibia of mature rats. J Oral Maxillofac Surg. 2000;58:877–882. doi: 10.1053/joms.2000.8212. [DOI] [PubMed] [Google Scholar]
- 11.Duarte PM, Cesar Neto JB, Goncalves PF, Sallum EA, Nociti jF. Estrogen deficiency affects bone healing around titanium implants: a histometric study in rats. Implant Dent. 2003;12:340–346. doi: 10.1097/01.id.0000099750.26582.4b. [DOI] [PubMed] [Google Scholar]
- 12.Friberg B, Ekestubbe A, Mellstrom D, Sennerby L. Branemark implants and osteoporosis: a clinical exploratory study. Clin Implant Dent Relat Res. 2001;3:50–56. doi: 10.1111/j.1708-8208.2001.tb00128.x. [DOI] [PubMed] [Google Scholar]
- 13.Mori H, Manabe M, Kurachi Y, Nagumo M. Osseointegration of dental implants in rabbit bone with low mineral density. J Oral Maxillofac Surg. 1997;55:351–361. doi: 10.1016/s0278-2391(97)90124-5. discussion 362. [DOI] [PubMed] [Google Scholar]
- 14.Mijares D, Kulkarni A, Lewis K, Yao F, Xi Q, Tannous S, Dias R, LeGeros RZ. Oral bone loss induced by mineral deficiency in a rat model: effect of a synthetic bone mineral (SBM) preparation. Arch Oral Biol. 2012;57:1264–1273. doi: 10.1016/j.archoralbio.2012.02.021. [DOI] [PubMed] [Google Scholar]
- 15.LeGeros RZ. US 7,419,680,B2 (submitted 2004, issued September 2, 2008). US 2009/0068285A1 (CIP, March 12, 2009) Calcium phosphate-based biomaterials incorporating magnesium, zinc, fluoride and carbonate Patent. 2008
- 16.Watanabe T, Nakada H, Takahashi T, Fujita K, Tanimoto Y, Sakae T, Kimoto S, Kawai Y. Potential for acceleration of bone formation after implant surgery by using a dietary supplement: an animal study. J Oral Rehabil. 2015;42:447–453. doi: 10.1111/joor.12270. [DOI] [PubMed] [Google Scholar]
- 17.Watanabe T, Nakada H, Takahashi T, Fujita K, Tanimoto Y, Sakae T, Kimoto S, Kawai Y. The Influence of Synthetic Bone Mineral to Bone Formation. IJOMS. 2015;13:89–93. [Google Scholar]
- 18.Alghamdi HS, Cuijpers VM, Wolke JG, van den Beucken JJ, Jansen JA. Calcium-phosphate-coated oral implants promote osseointegration in osteoporosis. J Dent Res. 2013;92:982–988. doi: 10.1177/0022034513505769. [DOI] [PubMed] [Google Scholar]
- 19.Zacchetti G, Wiskott A, Cugnoni J, Botsis J, Ammann P. External mechanical microstimuli modulate the osseointegration of titanium implants in rat tibiae. Biomed Res Int. 2013;2013:234093. doi: 10.1155/2013/234093. [DOI] [PMC free article] [PubMed] [Google Scholar]
- 20.Aparicio C, Padros A, Gil FJ. In vivo evaluation of micro-rough and bioactive titanium dental implants using histometry and pull-out tests. J Mech Behav Biomed Mater. 2011;4:1672–1682. doi: 10.1016/j.jmbbm.2011.05.005. [DOI] [PubMed] [Google Scholar]
- 21.Rude RK, Gruber HE. Magnesium deficiency and osteoporosis: animal and human observations. J Nutr Biochem. 2004;15:710–716. doi: 10.1016/j.jnutbio.2004.08.001. [DOI] [PubMed] [Google Scholar]
- 22.Yamada Y, Ito A, Kojima H, Sakane M, Miyakawa S, Uemura T, LeGeros RZ. Inhibitory effect of Zn2+ in zinc-containing beta-tricalcium phosphate on resorbing activity of mature osteoclasts. J Biomed Mater Res A. 2008;84:344–352. doi: 10.1002/jbm.a.31265. [DOI] [PubMed] [Google Scholar]
- 23.Inoue M, LeGeros RZ, Inoue M, Tsujigiwa H, Nagatsuka H, Yamamoto T, Nagai N. In vitro response of osteoblast-like and odontoblast-like cells to unsubstituted and substituted apatites. J Biomed Mater Res A. 2004;70:585–593. doi: 10.1002/jbm.a.30116. [DOI] [PubMed] [Google Scholar]
- 24.Miyagi M, Tsuruda K, Kawamura M, Morishita M, Iwamoto Y. Effects of fluoride intake on the mineral content, acid solubility and resorption caused by experimental periodontitis of rat alveolar bone. Arch Oral Biol. 1994;39:163–166. doi: 10.1016/0003-9969(94)90112-0. [DOI] [PubMed] [Google Scholar]
- 25.Rude RK, Gruber HE, Norton HJ, Wei LY, Frausto A, Kilburn J. Dietary magnesium reduction to 25% of nutrient requirement disrupts bone and mineral metabolism in the rat. Bone. 2005;37:211–219. doi: 10.1016/j.bone.2005.04.005. [DOI] [PubMed] [Google Scholar]


