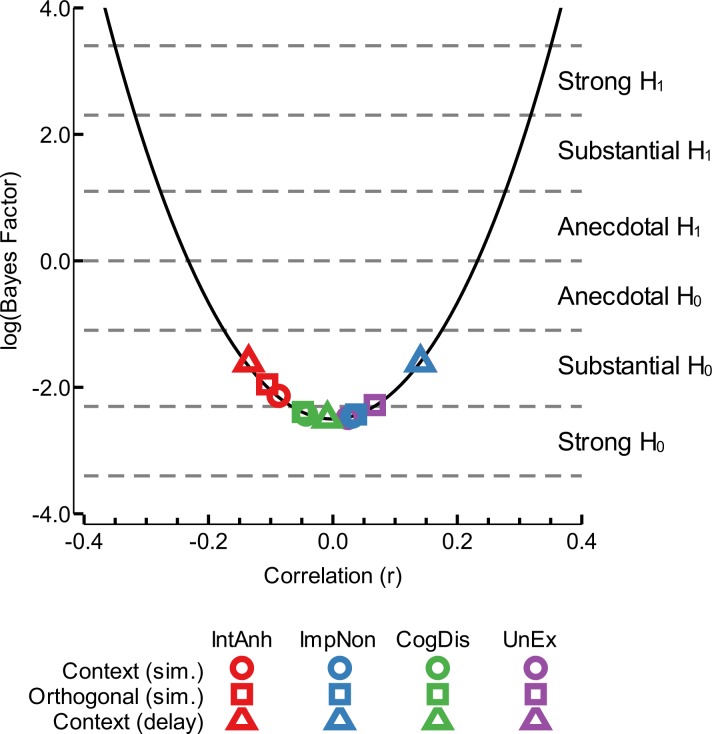
Figure 5. Bayesian analysis of correlation coefficients.
We used the approach of Wetzels & Wagenmakers (2012) to determine the relationship between a given correlation coefficient and its Bayes factor, with a fixed sample size of 93, as depicted by the solid black line. The points show the positioning on this curve of the analyses conducted in this study; different colours depict the dimensions of the schizotypy scale (red: introvertive anhedonia (IntAnh); blue: impulsive nonconformity (ImpNon); green: cognitive disorganisation (CogDis); purple: unusual experiences (UnEx)) and different shapes depict the class of analysis (circles: context effect with simultaneous presentation; squares: orthogonal threshold with simultaneous presentation; triangles: context effect with delayed target presentation). Dashed grey lines denote the Bayes factor interpretation categories, following Wetzels & Wagenmakers (2012).

