

Abstract
Recently, it has been found that high level of serum uric acid (SUA) is causally related to sudden cardiac death (SCD). We examined the sex-specific associations of SUA with prolonged heart rate-corrected QT (QTc) interval in a general Chinese population.
A large sample of 11,206 Chinese research participants aged 35 years and older was recruited from rural areas of Liaoning Province during 2012 to 2013. SUA were divided into quartiles separated for males and females. Prolonged QTc interval, assessed by the Bazett formula, was defined as cut points of 460 ms or longer in females and 450 ms or longer in males. Mean (+/− standard deviation) QTc intervals were 422.1 ± 24.2 ms among 5104 males and 436.1 ± 23.5 ms among 6102 females, respectively. In both sexes, SUA showed significant correlations with QTc interval (both P < 0.001). Among male participants, the highest quartile of SUA (>379 μmol/L) was related to an increased risk for prolonged QTc interval (odds ratios: 1.402, 95% confidence interval: 1.073–1.831) compared to the lowest quartile (≤276 μmol/L) after fully adjustment. However, there were no significant relationships between SUA and prolonged QTc interval among females in all the models.
Males with high SUA are prone to a higher risk for prolonged QTc interval. This study provides novel explanation for population-based findings on SUA and SCD, as well as important implications for management strategies for hyperuricemic patients in clinical practice.
Keywords: population, QT interval electrocardiography, risk factors, sex-specific, uric acid
1. Introduction
The QT interval on electrocardiography (ECG) mainly represents cardiac ventricular repolarization. Since it highly depends on heart rate, the utilization of QT interval requires adjustment for heart rate. The prolongation of heart rate-corrected QT (QTc) interval has been shown as a marker of sudden cardiac death (SCD), cardiovascular disease (CVD) death, and all-cause mortality in both general and high-risk populations.[1–4] Identifying risk factors for prolonged QTc interval could help improve population-based strategies for the management of the serious health problem.
Uric acid (UA) is the end product of purine metabolism in humans. A great many studies have reported the positive associations between increased serum UA (SUA) and many adverse outcomes, such as hypertension, metabolic syndrome, heart failure, CVD, and all-cause mortality.[5–9] Recently, it has been found that high SUA is causally related to SCD,[10] leading us to consider there might be a link between SUA and ECG abnormalities, especially prolonged QTc interval, which could contribute to this association. However, little is known about the impact of SUA on ECG profiles. In a cohort of general population, Cicero et al[11] found that SUA was a significant middle-term predictor of myocardial infarction, left ventricular hypertrophy, and tachyarrhythmias based on ECG. Also, a study with small sample size reported SUA was an independent marker for predicting ventricular arrhythmia in patients with left ventricular hypertrophy.[12] In a hospital-based study including 38 patients with liver cirrhosis, SUA was found to be correlated with QTc interval in lead II and maximum QTc interval in all 12 leads from linear regression analysis.[13] As far as we know, there is no evidence on the association between SUA and prolonged QTc interval among general population in the literature. To address this issue, we used ECGs and clinical data at the baseline examination of a large cohort study based in Liaoning Province in Northeast China to evaluate the sex-specific impact of SUA on prolonged QTc interval. We aim to provide a mechanistic context for the links between SUA and SCD in the literature as well as evidence for the management strategies for individuals with high SUA from clinical perspective.
2. Methods
2.1. Study population
Liaoning Province is located in Northeast China. From January 2012 to August 2013, a representative sample aged 35 years and older was selected to describe the prevalence, incidence, and natural history of cardiovascular risk factors in rural areas of Liaoning Province. The study adopted a multistage, stratified randomly cluster-sampling scheme. In the 1st stage, 3 counties (Dawa, Zhangwu, and Liaoyang County) were selected from the eastern, southern, and northern region of Liaoning province. In the 2nd stage, 1 town was randomly selected from each county (a total of 3 towns). In the 3rd stage, 8 to 10 rural villages from each town were randomly selected (a total of 26 rural villages). Participants with pregnancy, malignant tumor, and mental disorder were excluded from the present study. All the eligible permanent residents aged ≥35 years from each village were invited to attend the study (a total of 14,016 participants). Of those, 11,956 participants agreed and completed the present study and the response rate was 85.3%. The study was approved by the Ethics Committee of China Medical University (Shenyang, China). All procedures were performed in accordance with the ethical standards. Written consent was obtained in all participants after they had been informed of the objectives, benefits, medical items, and confidentiality agreement of personal information. If the participants were illiterate, we obtained the written informed consents from their proxies. Detailed processes on study population and data collection were described in our previous studies.[14–19] In this report, we used data of baseline and only participants with a complete set of data regarding the variables analyzed in the study were included, making a final sample size of 11,206 (5104 males and 6102 females).
2.2. Data collection and measurements
Data were collected during a single baseline clinic visit by cardiologists and trained nurses under the supervision of a Steering Committee and with quality control procedures in place. Before the survey was performed, we invited all eligible investigators to attend the organized training. The training contents included the purpose of this study, how to administer the questionnaire, the standard method of measurement, the importance of standardization, and the study procedures. A strict test was evaluated after this training, only those who scored perfectly on the test could become investigators. During data collection, our inspectors had further instructions and support.
Data on demographic characteristics, lifestyle risk factors, dietary habits, family income, history of heart disease, and any medicine used in the past 2 weeks were obtained by interview with a standardized questionnaire. Smoking and drinking status, educational level, family income, and self-reported sleep duration (including nocturnal and nap duration) were obtained from the questionnaire. Physical activity included occupational and leisure-time physical activity. A detailed description of the methods has been presented elsewhere.[20] The dietary pattern was assessed using recall of foods eaten in the previous year. The questionnaire included questions on the average consumption of several food items per week. The reported consumption was quantified approximately in terms of grams per week. A special diet score (vegetable consumption score plus meat consumption score) was calculated for each participant (range 0–6).
According to American Heart Association protocol, blood pressure (BP) was measured 3 times at 2-minute intervals after at least 5 minutes of rest using a standardized automatic electronic sphygmomanometer (HEM-907; Omron), which had already been validated according to the British Hypertension Society protocol.[21] Measurements were performed in the morning following the same protocol for all the participants. They were advised to avoid caffeinated beverages and exercise for at least 30 minutes before the measurement. During the measurement, the participants were seated with the arm supported at the level of the heart. The mean of 3 BP measures was calculated and used in all analyses.
Weight and height were measured to the nearest 0.1 kg and 0.1 cm respectively with the participants in light weight clothing and without shoes. Waist circumference was measured at the umbilicus using a nonelastic tape (to the nearest 0.1 cm), with the participants standing at the end of normal expiration. Body mass index (BMI) was calculated as weight in kilograms divided by the square of the height in meters.
Fasting blood samples were collected in the morning after at least 12 hours of fasting for all participants. Blood samples were obtained from an antecubital vein using BD Vacutainer tubes containing EDTA (Becton, Dickinson and Co., Franklin Lakes, NJ). Serum was subsequently isolated from whole blood, and all serum samples were frozen at −20 °C for testing at a central, certified laboratory. Fasting plasma glucose (FPG), total cholesterol (TC), low-density lipoprotein cholesterol (LDL-C), high-density lipoprotein cholesterol, triglyceride (TG), SUA, serum calcium, potassium, and magnesium, and other routine blood biochemical indexes were analyzed enzymatically on an auto-analyzer (Olympus AU640 Auto-Analyzer; Olympus Corp., Kobe, Japan). All laboratory equipment was calibrated and blinded duplicate samples were used.
Hypertension was defined as systolic BP ≥ 140 mm Hg and/or diastolic BP ≥ 90 mm Hg and/or use of antihypertensive medications.[22] Obesity was defined as BMI ≥ 28 kg/m2, according to the recommendation for Asians.[23] Dyslipidemia was defined as the presence of either abnormality of the following elements according to the National Cholesterol Education Program-Third Adult Treatment Panel (ATP III) criteria[24]: TC ≥ 6.21 mmol/L (240 mg/dL); high-density lipoprotein cholesterol < 1.03 mmol/L (40 mg/dL); LDL-C ≥ 4.16 mmol/L (160 mg/dL); and TG ≥ 2.26 mmol/L (200 mg/dL). Diabetes mellitus was diagnosed according to the WHO criteria: FPG ≥ 7 mmol/L (126 mg/dL) and/or being on treatment for diabetes.[25]
Twelve-lead ECGs (resting, 10 seconds) were performed on all participants by well-trained cardiologists using a MAC 5500 (GE Healthcare; Little Chalfont, Buckinghamshire, UK). All ECGs were standard resting ECGs (25 mm/second paper speed and 10 mm/mV amplitude). After capturing images, QTc intervals were calculated and recorded automatically by the MUSE Cardiology Information System, version 7.0.0 (GE Healthcare) using Bazett formula.[26] Prolonged QTc was defined according to a scientific statement, which recommend cut points of 460 milliseconds or longer in females and 450 milliseconds or longer in males.[27]
2.3. Statistical analysis
Descriptive statistics were calculated for all the variables, including continuous variables (expressed as mean values and standard deviations) and categorical variables (expressed as numbers and proportions). Differences among categories were evaluated using nonparameter test or the χ2-test as appropriate. SUA were divided into quartiles (males: ≤276, 276–323, 323–379, and >379 μmol/L; females: ≤209, 209–247, 247–294, and >294 μmol/L). Spearman rank correlation analysis was performed to investigate the relationship between SUA and QTc interval by sex and different conditions. Multivariate logistic regression analyses were used to identify independent associations between SUA and prolonged QTc with sequential adjustment for potential confounders and mediators. Odds ratios (ORs) and corresponding 95% confidence intervals (CIs) were calculated. All the statistical analyses were performed using SPSS version 19.0 (IBM Corp), and P values less than 0.05 were considered to be statistically significant.
3. Results
Of the original 11,956 participants, 750 had incomplete data and were excluded from the analysis, leading to a total of 11,206 participants (5104 males and 6102 females) for the final analyses. Mean (+/− standard deviation) QTc intervals were 422.1 ± 24.2 ms among males and 436.1 ± 23.5 ms among females, respectively.
Table 1 presents the sex-specific baseline characteristics of the study population according to QTc interval. For both sexes, participants with prolonged QTc interval were more likely to be older and have worse metabolic profiles with higher BMI, waist circumference, systolic BP, diastolic BP, FPG, TC, TG, and LDL-C (All P < 0.05). The group of prolonged QTc interval also had higher proportions of heart disease history and self-reported medication use (all P < 0.001). For females, there were more current smokers among the participants with QTc interval prolongation.
Table 1.
Baseline characteristics of study population according to QTc interval in males and females (N = 11,206).
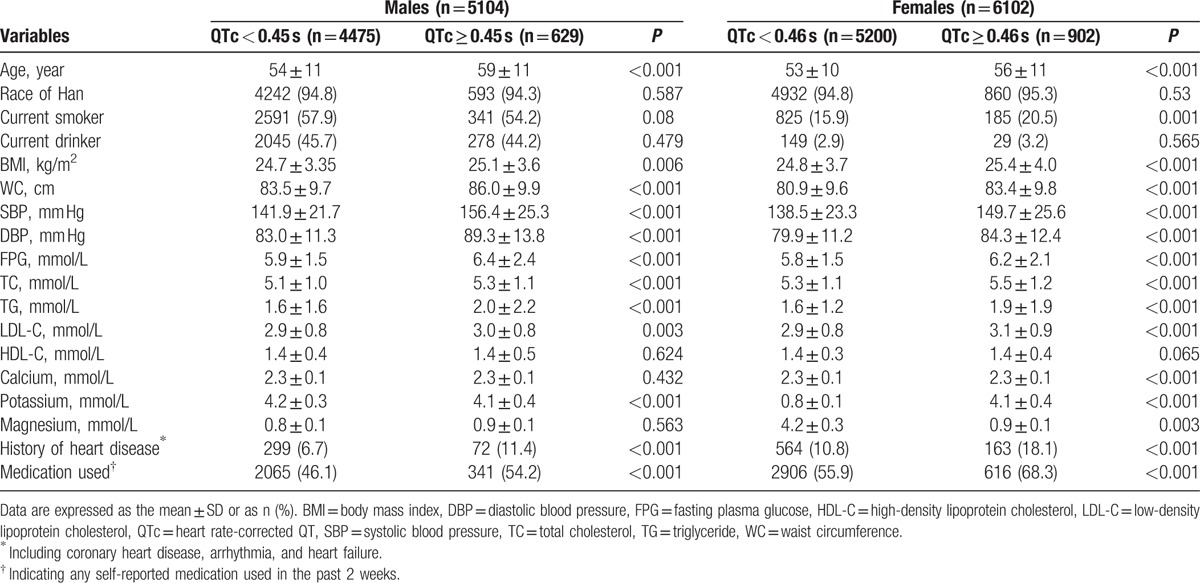
Figure 1 presents the sex-specific distribution of QTc interval among SUA quartiles. For both sexes, participants in the 4th quartile had higher QTc interval compared with the 1st quartile (males: 425.3 vs 420.9 μmol/L; females: 439 vs 434.2 μmol/L). The prevalence of prolonged QTc interval in the 4th quartile was significantly higher than the 1st quartile in both males (14.8% vs 11.2%) and females (17.1% vs 13.5%), as shown in Fig. 2.
Figure 1.
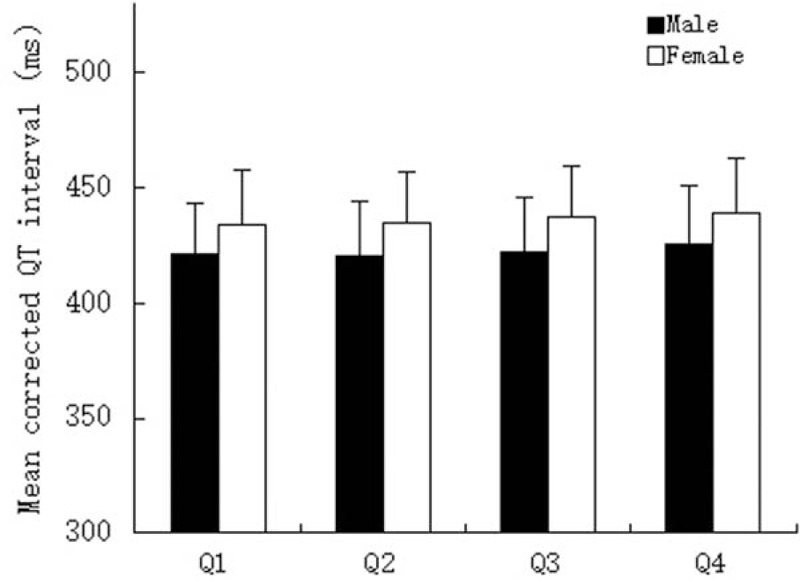
Sex-specific distribution of corrected QT interval according to quartiles of serum uric acid. Quartiles for males: ≤276, 276 to 323, 323 to 379, and >379 μmol/L; quartiles for females: ≤209, 209 to 247, 247 to 294, and >294 μmol/L.
Figure 2.
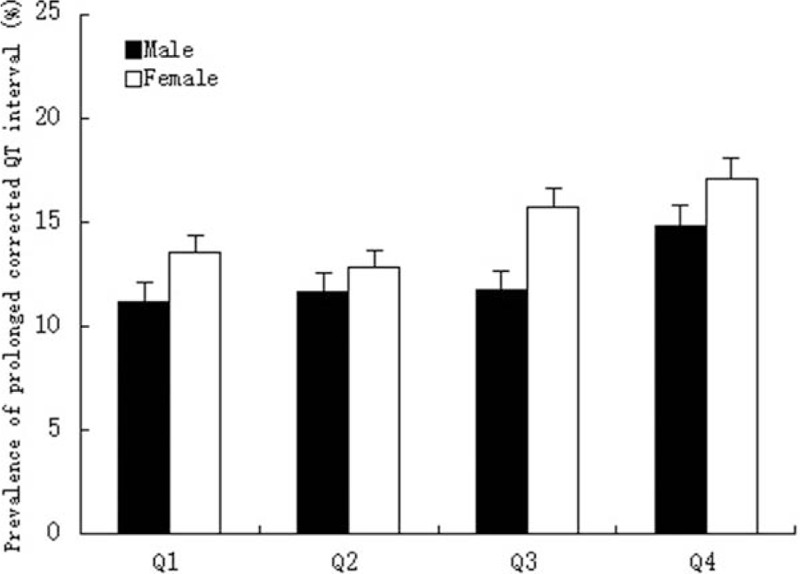
Sex-specific prevalence of prolonged corrected QT interval according to quartiles of serum uric acid. Quartiles for males: ≤276, 276 to 323, 323 to 379, and >379 μmol/L; quartiles for females: ≤209, 209 to 247, 247 to 294, and >294 μmol/L.
Table 2 presents the spearman correlation between SUA and QTc interval. In both sexes, SUA showed weak but significant correlations with QTc interval (both P < 0.001). Correlation coefficient varied according to different medical conditions. SUA correlated positively with QTc interval in males with hypertension and without obesity and diabetes; while for females, SUA correlated positively with QTc interval in all conditions except for diabetes.
Table 2.
Spearman rank correlation between serum uric acid quartiles and heart rate-corrected QT (QTc) interval.
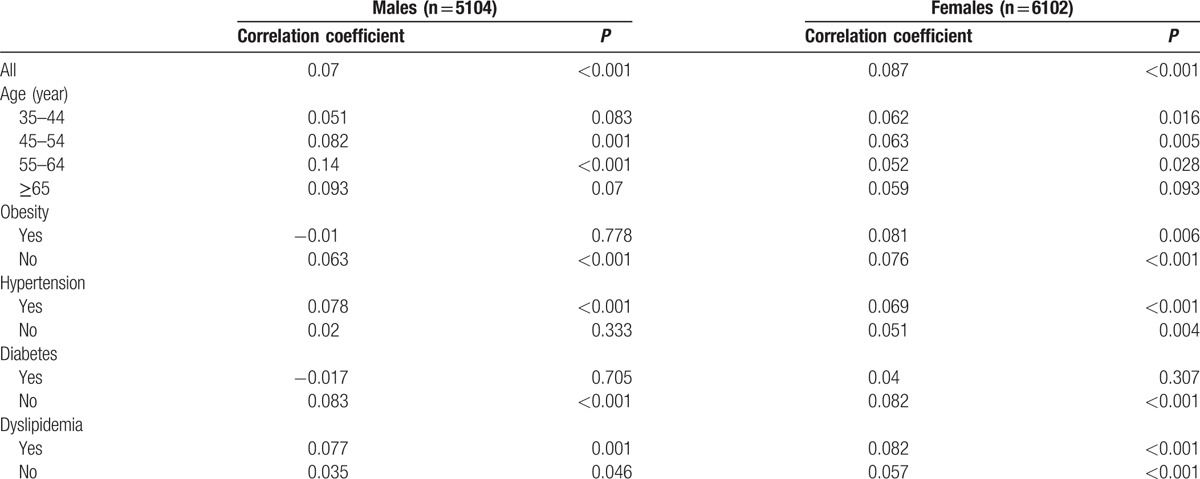
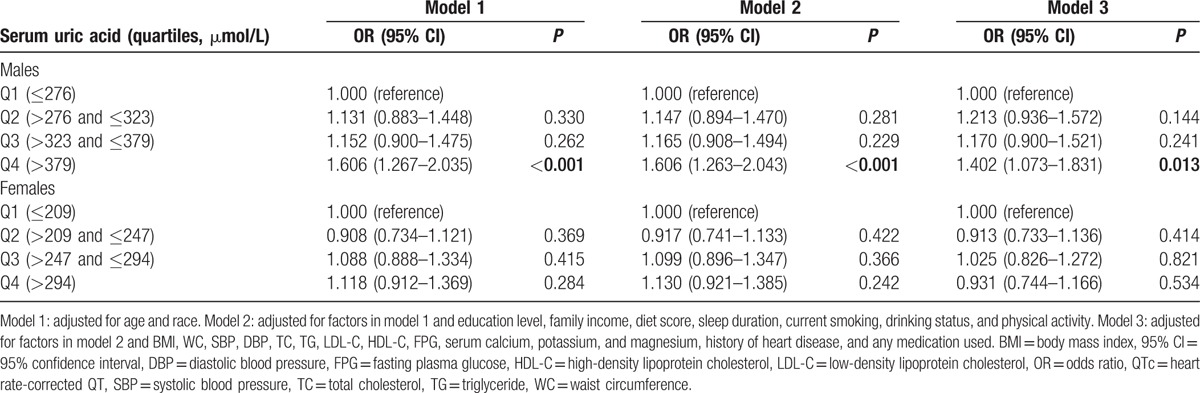
Table 3 presents sex-specific logistic regression analyses for the association between SUA and QTc interval prolongation. After multivariable adjustment, male participants in the highest quartile of SUA (>379 μmol/L) had an increased risk for prolonged QTc interval with OR of 1.402 (95% CI: 1.073–1.831, P = 0.013) compared to the lowest quartile (≤276 μmol/L). However, there were no significant relationships between SUA and prolonged QTc interval among females in all 3 models.
Table 3.
Sex-specific multivariable logistic regression analyses for association between serum uric acid and prolonged QTc interval.
4. Discussion
In this large sample of community members in Northeast China, we found male participants with SUA level of >379 μmol/L was associated with a 1.4-fold higher risk of prolonged QTc interval compared with the ones with SUA level of ≤276 μmol/L. In contrast, we found a negative association between SUA and QTc interval prolongation in females.
Prolonged QTc interval is an important predictor for SCD and CVD mortality.[3,4,28,29] Since ECG is an convenient test, QTc prolongation could be utilized as a rapid objective method to target patients who are at higher CVD risk in clinical practice. Identification of patients who might potentially have prolonged QTc intervals is the first step to take for healthcare providers. Traditional risk factors of prolonged QTc interval included age, sex, BP, serum glucose, obesity, serum electrolytes, and QT-prolonging medications.[30–32] However, there still are some other factors that have not been revealed. Lin et al observed a longer Tp-e interval and a greater Tp-e/QT ratio in the highest quartile of UA in a population of ethnic minority in South China,[33] indicating SUA might play a role in the process of repolarization. In addition, in a hospital-based study conducted in liver cirrhosis patients, SUA was correlated to QTc interval from multiple linear regression analysis.[13] Our study for the first time found that SUA was associated with an increased risk of prolonged QTc interval in males, but not in females, adding sex-specific evidence for management strategies among patients with hyperuricemia.
Although a number of studies have found that SUA is predictive for high incidence of SCD,[10,34] the mechanism is not yet clear. Since left ventricular hypertrophy has been shown as a major predictor for SCD,[35,36] SUA might serve as one of the triggers, possibly through its association with left ventricular hypertrophy.[37,38] Our study provided another novel insight for the explanation. SUA might also increase the incidence of SCD by prolonging QTc interval. As the debate going on, it is useful to confirm this association and investigate potential mechanisms of the sex-specific differences.
The positive relationship of SUA and prolonged QTc interval we observed might be possibly due to the triggering of inflammation by UA to some extent. An association has been observed between SUA and inflammatory markers in asymptomatic humans.[39] High concentrations of UA could influence inflammatory responses by facilitating IL-1beta production.[40,41] Previous studies have shown that TNF-alpha and IL-1beta could augment Ca2+ leak from the sarcoplasmic reticulum and thus increase susceptibility to arrhythmia in isolated rat ventricular myocytes.[42] Another possible explanation could be oxidative stress. It has been suggested that SUA is associated with process of oxidative stress.[43] Growing evidence also reveals the relationship between impaired oxidative metabolism and changes in the structure of myocardial tissue,[44,45] which can affect myocardial electrophysiological properties and increase incidence of arrhythmic events.[46] Although the exact mechanism by which SUA increases the risk of QTc prolongation is unclear, it is plausible that high SUA levels might adversely affect depolarization and repolarization of the heart by causing subclinical endomyocardial changes. More researches are expected for further investigation.
Our study had some limitations that need to be considered. First, SUA was only measured once. Hence, we were not able to control for intraindividual variability. Second, although we adjusted most crucial confounders, such as serum electrolytes, there were still other factors, including cardiomyopathy, cirrhosis, and genetic determinants. Moreover, we could not obtain the specific information on the use of antiarrhythmic agents. However, the medication used in the past 2 weeks we collected included QT-prolonging drugs as well as many other drugs that could also cause prolonged QTc interval, such as antibiotics and some Chinese traditional medicines. Also, some other information, such as device implantation, was not included. Although the proportion of device use in rural China is extremely low given the poverty, this still might compromise the results to some extent. In addition, our results were based on a cross-sectional design, thus no cause-and-effect relationships could be established.
In conclusion, high SUA was associated with a higher risk of prolonged QTc interval in males. Different impacts of SUA on QTc interval were observed between sexes. This finding helps provide novel insight into the positive link between SUA and SCD observed in population-based studies, and also has important implications for management of hyperuricemic patients in clinical practice.
Footnotes
Abbreviations: BMI = body mass index, BP = blood pressure, CVD = cardiovascular disease, ECG = electrocardiography, FPG = fasting plasma glucose, LDL-C = low-density lipoprotein cholesterol, QTc = heart rate-corrected QT, SCD = sudden cardiac death, SUA = serum UA, TC = total cholesterol, TG = triglyceride, UA = uric acid.
Funding/support: This work was supported by the National Science and Technology Support Program of China (grant number 2012BAJ18B02).
The authors have no conflicts of interest to disclose.
References
- [1].de Bruyne MC, Hoes AW, Kors JA, et al. Prolonged QT interval predicts cardiac and all-cause mortality in the elderly. The Rotterdam Study. Eur Heart J 1999;20:278–84. [DOI] [PubMed] [Google Scholar]
- [2].Zhang Y, Post WS, Dalal D, et al. QT-interval duration and mortality rate: results from the Third National Health and Nutrition Examination Survey. Arch Intern Med 2011;171:1727–33. [DOI] [PMC free article] [PubMed] [Google Scholar]
- [3].Straus SM, Kors JA, De Bruin ML, et al. Prolonged QTc interval and risk of sudden cardiac death in a population of older adults. J Am Coll Cardiol 2006;47:362–7. [DOI] [PubMed] [Google Scholar]
- [4].Zhang Y, Post WS, Blasco-Colmenares E, et al. Electrocardiographic QT interval and mortality: a meta-analysis. Epidemiology 2011;22:660–70. [DOI] [PMC free article] [PubMed] [Google Scholar]
- [5].Wu CY, Hu HY, Chou YJ, et al. High serum uric acid levels are associated with all-cause and cardiovascular, but not cancer, mortality in elderly adults. J Am Geriatr Soc 2015;63:1829–36. [DOI] [PubMed] [Google Scholar]
- [6].von Lueder TG, Girerd N, Atar D, et al. Serum uric acid is associated with mortality and heart failure hospitalizations in patients with complicated myocardial infarction: findings from the High-Risk Myocardial Infarction Database Initiative. Eur J Heart Fail 2015;17:1144–51. [DOI] [PubMed] [Google Scholar]
- [7].Sciacqua A, Perticone M, Tassone EJ, et al. Uric acid is an independent predictor of cardiovascular events in post-menopausal women. Int J Cardiol 2015;197:271–5. [DOI] [PubMed] [Google Scholar]
- [8].Huang H, Huang B, Li Y, et al. Uric acid and risk of heart failure: a systematic review and meta-analysis. Eur J Heart Fail 2014;16:15–24. [DOI] [PubMed] [Google Scholar]
- [9].Feig DI, Kang DH, Johnson RJ. Uric acid and cardiovascular risk. N Engl J Med 2008;359:1811–21. [DOI] [PMC free article] [PubMed] [Google Scholar]
- [10].Kleber ME, Delgado G, Grammer TB, et al. Uric acid and cardiovascular events: a Mendelian randomization study. J Am Soc Nephrol 2015;26:2831–8. [DOI] [PMC free article] [PubMed] [Google Scholar]
- [11].Cicero AF, Rosticci M, Tocci G, et al. Serum uric acid and other short-term predictors of electrocardiographic alterations in the Brisighella Heart Study cohort. Eur J Intern Med 2015;26:255–8. [DOI] [PubMed] [Google Scholar]
- [12].Yamada S, Suzuki H, Kamioka M, et al. Uric acid increases the incidence of ventricular arrhythmia in patients with left ventricular hypertrophy. Fukushima J Med Sci 2012;58:101–6. [DOI] [PubMed] [Google Scholar]
- [13].Mozos I, Costea C, Serban C, et al. Factors associated with a prolonged QT interval in liver cirrhosis patients. J Electrocardiol 2011;44:105–8. [DOI] [PubMed] [Google Scholar]
- [14].Yu S, Guo X, Yang H, et al. Soybeans or soybean products consumption and depressive symptoms in older residents in Rural Northeast China: a cross-sectional study. J Nutr Health Aging 2015;19:884–93. [DOI] [PubMed] [Google Scholar]
- [15].Guo X, Li Z, Guo L, et al. An update on overweight and obesity in rural Northeast China: from lifestyle risk factors to cardiometabolic comorbidities. BMC Public Health 2014;14:1046. [DOI] [PMC free article] [PubMed] [Google Scholar]
- [16].Yang H, Guo X, Zhang X, et al. The relationship between mean arterial pressure and decreased glomerular filtration rate in rural areas of Northeast China. BMC Nephrol 2015;16:137. [DOI] [PMC free article] [PubMed] [Google Scholar]
- [17].Yu S, Guo X, Yang H, et al. An update on the prevalence of metabolic syndrome and its associated factors in rural northeast China. BMC Public Health 2014;14:877. [DOI] [PMC free article] [PubMed] [Google Scholar]
- [18].Li Z, Bai Y, Guo X, et al. Alcohol consumption and cardiovascular diseases in rural China. Int J Cardiol 2016;215:257–62. [DOI] [PubMed] [Google Scholar]
- [19].Chen S, Guo X, Zhang X, et al. Association between elevated serum alanine aminotransferase and cardiometabolic risk factors in rural Chinese population: a cross-sectional study. BMC Cardiovasc Disord 2015;15:65. [DOI] [PMC free article] [PubMed] [Google Scholar]
- [20].Hu G, Tuomilehto J, Silventoinen K, et al. Joint effects of physical activity, body mass index, waist circumference and waist-to-hip ratio with the risk of cardiovascular disease among middle-aged Finnish men and women. Eur Heart J 2004;25:2212–9. [DOI] [PubMed] [Google Scholar]
- [21].O’Brien E, Petrie J, Littler W, et al. The British Hypertension Society protocol for the evaluation of automated and semi-automated blood pressure measuring devices with special reference to ambulatory systems. J Hypertens 1990;8:607–19. [DOI] [PubMed] [Google Scholar]
- [22].Chobanian AV, Bakris GL, Black HR, et al. The Seventh Report of the Joint National Committee on Prevention, Detection, Evaluation, and Treatment of High Blood Pressure: the JNC 7 report. JAMA 2003;289:2560–72. [DOI] [PubMed] [Google Scholar]
- [23].Steering Committee The Asia-Pacific Perspective: Redefining Obesity and Its Treatment. 2000;Melbourne:International Diabetes Institute, 11–12. [Google Scholar]
- [24].Expert Panel on Detection, Evaluation, and Treatment of High Blood Cholesterol in Adults Executive Summary of the Third Report of the National Cholesterol Education Program (NCEP) Expert Panel on Detection, Evaluation, And Treatment of High Blood Cholesterol In Adults (Adult Treatment Panel III). JAMA 2001;285:2486–97. [DOI] [PubMed] [Google Scholar]
- [25].World Health Organization and International Diabetes Fedaration Definition and Diagnosis of Diabetes Mellitus and Intermediate Hyperglycemia: Report of a WHO/IDF Consultation. Geneva, Switzerland:World Health Organization; 2006. [Google Scholar]
- [26].Bazett HC. An analysis of the time relations of electrocardiograms. Heart 1920;7:353–67. [Google Scholar]
- [27].Rautaharju PM, Surawicz B, Gettes LS, et al. AHA/ACCF/HRS recommendations for the standardization and interpretation of the electrocardiogram: part IV: the ST segment, T and U waves, and the QT interval: a scientific statement from the American Heart Association Electrocardiography and Arrhythmias Committee, Council on Clinical Cardiology; the American College of Cardiology Foundation; and the Heart Rhythm Society: endorsed by the International Society for Computerized Electrocardiology. Circulation 2009;119:e241–250. [DOI] [PubMed] [Google Scholar]
- [28].Goldberg RJ, Bengtson J, Chen ZY, et al. Duration of the QT interval and total and cardiovascular mortality in healthy persons (The Framingham Heart Study experience). Am J Cardiol 1991;67:55–8. [DOI] [PubMed] [Google Scholar]
- [29].Okin PM, Devereux RB, Howard BV, et al. Assessment of QT interval and QT dispersion for prediction of all-cause and cardiovascular mortality in American Indians: The Strong Heart Study. Circulation 2000;101:61–6. [DOI] [PubMed] [Google Scholar]
- [30].Benoit SR, Mendelsohn AB, Nourjah P, et al. Risk factors for prolonged QTc among US adults: Third National Health and Nutrition Examination Survey. Eur J Cardiovasc Prev Rehabil 2005;12:363–8. [DOI] [PubMed] [Google Scholar]
- [31].Grandinetti A, Seifried S, Mor J, et al. Prevalence and risk factors for prolonged QTc in a multiethnic cohort in rural Hawaii. Clin Biochem 2005;38:116–22. [DOI] [PubMed] [Google Scholar]
- [32].Brown DW, Giles WH, Greenlund KJ, et al. Impaired fasting glucose, diabetes mellitus, and cardiovascular disease risk factors are associated with prolonged QTc duration. Results from the Third National Health and Nutrition Examination Survey. J Cardiovasc Risk 2001;8:227–33. [DOI] [PubMed] [Google Scholar]
- [33].Lin Y, Lai X, Chen G, et al. Association among serum uric acid, cardiovascular risk, and arterial stiffness: a cross-sectional study in She ethnic minority group of Fujian Province in China. J Endocrinol Invest 2012;35:290–7. [DOI] [PubMed] [Google Scholar]
- [34].Silbernagel G, Hoffmann MM, Grammer TB, et al. Uric acid is predictive of cardiovascular mortality and sudden cardiac death in subjects referred for coronary angiography. Nutr Metab Cardiovasc Dis 2013;23:46–52. [DOI] [PubMed] [Google Scholar]
- [35].Haider AW, Larson MG, Benjamin EJ, et al. Increased left ventricular mass and hypertrophy are associated with increased risk for sudden death. J Am Coll Cardiol 1998;32:1454–9. [DOI] [PubMed] [Google Scholar]
- [36].Schatzkin A, Cupples LA, Heeren T, et al. Sudden death in the Framingham Heart Study. Differences in incidence and risk factors by sex and coronary disease status. Am J Epidemiol 1984;120:888–99. [DOI] [PubMed] [Google Scholar]
- [37].Mitsuhashi H, Yatsuya H, Matsushita K, et al. Uric acid and left ventricular hypertrophy in Japanese men. Circ J 2009;73:667–72. [DOI] [PubMed] [Google Scholar]
- [38].Fujita S, Okamoto Y, Shibata K, et al. Serum uric acid is associated with left ventricular hypertrophy independent of serum parathyroid hormone in male cardiac patients. PLoS One 2013;8:e82735. [DOI] [PMC free article] [PubMed] [Google Scholar]
- [39].Ruggiero C, Cherubini A, Ble A, et al. Uric acid and inflammatory markers. Eur Heart J 2006;27:1174–81. [DOI] [PMC free article] [PubMed] [Google Scholar]
- [40].Crisan TO, Cleophas MC, Oosting M, et al. Soluble uric acid primes TLR-induced proinflammatory cytokine production by human primary cells via inhibition of IL-1Ra. Ann Rheum Dis 2016;75:755–62. [DOI] [PubMed] [Google Scholar]
- [41].Rock KL, Kataoka H, Lai JJ. Uric acid as a danger signal in gout and its comorbidities. Nat Rev Rheumatol 2013;9:13–23. [DOI] [PMC free article] [PubMed] [Google Scholar]
- [42].Duncan DJ, Yang Z, Hopkins PM, et al. TNF-alpha and IL-1beta increase Ca2+ leak from the sarcoplasmic reticulum and susceptibility to arrhythmia in rat ventricular myocytes. Cell Calcium 2010;47:378–86. [DOI] [PMC free article] [PubMed] [Google Scholar]
- [43].Corry DB, Eslami P, Yamamoto K, et al. Uric acid stimulates vascular smooth muscle cell proliferation and oxidative stress via the vascular renin-angiotensin system. J Hypertens 2008;26:269–75. [DOI] [PubMed] [Google Scholar]
- [44].Bendall JK, Cave AC, Heymes C, et al. Pivotal role of a gp91(phox)-containing NADPH oxidase in angiotensin II-induced cardiac hypertrophy in mice. Circulation 2002;105:293–6. [DOI] [PubMed] [Google Scholar]
- [45].Leyva F, Anker SD, Godsland IF, et al. Uric acid in chronic heart failure: a marker of chronic inflammation. Eur Heart J 1998;19:1814–22. [DOI] [PubMed] [Google Scholar]
- [46].Spear JF, Michelson EL, Moore EN. Cellular electrophysiologic characteristics of chronically infarcted myocardium in dogs susceptible to sustained ventricular tachyarrhythmias. J Am Coll Cardiol 1983;1:1099–110. [DOI] [PubMed] [Google Scholar]