Abstract
Objective
Compare total percentage body fat (pfat) measurements between two densitometers, and visceral adipose tissue (VAT) estimates between iDXA and MRI from the same defined abdominal region.
Methods
Participants (N=93 (50m, 43f), BMI: 19.1–57.6 kg/m2) underwent dual-energy X-ray absorptiometry (DXA) scans on two DXA systems (iDXA and Lunar Prodigy), and a subgroup underwent abdominal MRI imaging for quantification of VAT.
Results
Pfat correlated strongly between both machines (r2=0.98, P<1.0E-14). Bland-Altman plots showed a bias with higher measured pfat on iDXA versus Lunar Prodigy in leaner subjects and the opposite in more overweight subjects. The R2, for regression of MRI on iDXA VAT-values was 0.948. Bland-Altman bias was +104.1 cm3 with 95% limits of agreement of −681.9 to 890.0 cm3. For both DXA methods, and iDXA v MRI determined VAT, comparison using rank regression demonstrated no order bias.
Conclusions
The total pfat measured by both machines were strongly, and linearly associated allowing for conversion (equations are provided) of iDXA for assessment of longitudinal body fat changes. Despite a bias of abdominal VAT measures of iDXA v MRI, the high rank correlation makes iDXA a good alternative to the more complicated and time consuming MRI for use in larger cross-sectional and longitudinal studies.
Keywords: Dual-energy X-ray densitometry, iDXA, body composition, visceral adipose tissue, magnetic resonance imaging, cross calibration study
Introduction
Dual-energy X-ray absorptiometry (DXA) provides accurate measurement of body composition, which is essential for the quantification of adipose and lean tissue, and their distribution during and after interventions in energy balance studies. DXA systems have replaced underwater weighing as a method to determine body composition in nearly all clinical- and research facilities. Technical innovations led to a transition from the early pencil-beam to modern fan-beam densitometers, which utilize multiple detectors in favor of faster scan times and near-radiographic image quality (1). Longitudinal studies with repeated body composition measurements require comparable assessments of the percentage body fat (pfat), fat mass, and fat free mass (FM, FFM). When baseline- and follow-up body composition measurements are not performed with the same DXA machine, e.g. due to system upgrades, cross-calibration studies are necessary to compare results from different DXA systems. Recent cross-calibration studies comparing precision of body composition measurements between different fan-beam systems report excellent (2) or good agreement (3) and propose the use of translational equations to ensure comparability of body composition measurements (3).
The recently introduced fan-beam iDXA (GE Healthcare Lunar) densitometer allows, for the first time, fully automated dedicated measurement of visceral adipose tissue (VAT), separately form subcutaneous adipose tissue (SAT). Adipose tissue distribution (in particular VAT vs. SAT) rather than total adiposity has been associated with adverse health events (4–7). Previous reports on the precision of VAT measurements done by iDXA in comparison to the time- and resource intense gold standard methods computed tomography (CT), and magnetic resonance imaging (MRI) report a strong correlation of VAT measured with the respective imaging modalities throughout a wide range of body sizes and different ethnicities (8–10). However, to our knowledge previous reports compared a fixed region of interest from CT or MRI scans, defined as 150 mm of the abdomen, beginning at the top of S1 and moving toward the head (8–10), while the CoreScan® software (iDXA) individually defines a region-of-interest whose caudal limit is the top of the iliac crest and in which the height is set to 20% of the distance from the top of the iliac crest to the base of the mandible to account for inter-individual differences in body size.
The aim of this study was to precisely compare total percentage body fat measurements between two fan beam densitometers (GE Lunar Prodigy and GE Lunar iDXA), and VAT estimates between iDXA and MRI from the same defined abdominal region.
Methods
Subjects
We recruited 100 subjects without reported health problems (50 women and 50 men, aged 18.6 to 64.7 years) from the greater Phoenix area with a broad range of BMI (19.1 – 57.6 kg/m2), who underwent DXA scans on both machines (Lunar Prodigy and iDXA), in random order. The only exclusion criteria were age <18 years, pregnancy or breastfeeding or weight >159 kg (weight limit for Lunar Prodigy). By design, we recruited approximately equal numbers of women and men in the following BMI groups < 25 kg/m2 (normal weight; 16 women, 16 men), ≥ 25 kg/m2 <30 kg/m2 (overweight; 16 women, 18 men), and ≥30kg/m2 (obese; 18 women, 16 men). Seven participants (all with BMI >30) were excluded from the analyses. These 7 scans were performed as half scans of the right side of the body, previously validated for calculation of total body fat on the same scanner (14). A limitation of available DXA systems is the size of the scanning area (~190 × 60 cm), meaning the body dimensions can exceed the scanning area. These 7 participants had been improperly positioned on the table during one of the scans. Thus, in the results section we report results of 93 participants (Table 1), whose demographic and anthropometric characteristics did not differ significantly from the initially recruited 100 subjects.
Table 1.
Demographic and anthropometric characteristics of the study population.
| Total study cohort with both DXA scans | Subgroup with both DXA scans,
and abdominal MRI scan |
|||||
|---|---|---|---|---|---|---|
| Total (N=93) |
Women (N=43) |
Men (N=50) |
Total (N=40) | Women (N=20) |
Men (N=20) |
|
| Race | B=1, H=2, NA=4 |
B=1, H=1, NA=3 |
B=7, H=8, NA=16, W=19 |
A=1,
B=5, H=5, NA=15, W=14 |
A=1,
B=2, H=1, NA=10, W=6 |
B=3, H=4, NA=5, W=8 |
| Age (years) | 38,6 ± 11.6 | 37.5 ± 11.4 | 39.7 ± 11.6 | 36.6 ± 10.7 | 37.4 ± 11.5 | 35.8 ± 9.9 |
| Height (cm) | 168,6 ± 9.6 | 161.2 ± 6.5*** | 175.3 ± 6.3*** | 168.3 ± 9.1 | 161.9 ± 7.3 | 174.7 ± 5.3*** |
| Body weight (kg) |
79,1 ± 17.7 | 73.4 ± 18.4** | 86.4 ± 17.4* | 82.1 ± 20.6 | 76.9 ± 21.7 | 87.3 ± 18.6 |
| BMI (kg/m2) | 27,8 ± 5.7 | 28.2 ± 6.5 | 28.2 ± 5.9 | 29.1 ± 7.5 | 29.5 ± 8.8 | 28.6 ± 6.1 |
| pfat Lunar DXA (%) |
34,2 ± 11.0 | 41.5 ± 8.5*** | 28.2 ± 9.2*** | 35.1 ± 12.0 | 42.9 ± 8.8 | 27.3 ± 9.5*** |
| pfat iDXA (%) | 34,1 ± 10.0 | 40.4 ± 8.3*** | 29.3 ± 8.8*** | 35.1 ± 11.3 | 41.7 ± 9.3 | 28.5 ± 9.1*** |
| FM Lunar DXA (kg) |
27,8 ± 12.5 | 31.6 ± 13.9** | 25.6 ± 12.4* | 29.8 ± 15.2 | 34.3 ± 16.0 | 25.2 ± 13.2 |
| FM iDXA (kg) | 27,7 ± 12.5 | 30.8 ± 13.8* | 26.5 ± 12.7* | 30.0 ± 15.9 | 33.6 ± 17.3 | 26.3 ± 13.7 |
| FFM Lunar DXA (kg) |
51,3 ± 11.4 | 41.8 ± 6.3*** | 60.8 ± 8.0*** | 52.4 ± 12.4 | 42.6 ± 7.1 | 62.1 ± 8.0*** |
| FFM iDXA (kg) | 51,4 ± 10.8 | 42.5 ± 6.1*** | 59.9 ± 7.5*** | 52.2 ± 11.1 | 43.3 ± 6.0 | 61.1 ± 7.1*** |
| VAT iDXA (cm3) |
. | . | . | 1210 ± 1245 | 997 ± 948 | 1423 ± 1480 |
| VAT MRI (cm3) | . | . | . | 1106 ± 930 | 893 ± 584 | 1318 ± 1157 |
Shown is the total study population N=93, and N=40 with both DXA scans, and abdominal MRI scan. Values are presented as mean ± SD.
Differences between men and women were assessed by two sample Student’s t-test (* = P<0.05; ** = <0.01; *** = P<0.0001.
Abbreviations: A = Asian; B = Black; H = Hispanic; NA = Native American; W = White; pfat = percentage body fat; BMI = Body mass index; FM = Fat mass; FFM = Fat free mass
From the initial 100 individuals, forty (20 women and 20 men) underwent additional abdominal magnetic resonance imaging (< 25 kg/m2 (6 women, 6 men), ≥ 25 kg/m2–<30 kg/m2 (7 women, 7 men), and ≥30kg/m2 (7 women, 7 men)). Female participants underwent a urine pregnancy test within 1 hour of the DXA scans. Volunteers were fully informed of the nature and purpose of the study they participated in, and written informed consent was obtained before admission. DXA measurements were done at the clinical research unit of the Obesity and Diabetes Clinical Research Section of the National Institute of Diabetes and Digestive and Kidney Diseases (NIDDK) in Phoenix, AZ. MRIs were performed at St. Joseph’s Hospital and Medical Center at the Kelly Center for Imaging Innovation, Phoenix, AZ. The protocol was approved by the Institutional Review Board of the NIDDK and by the St. Joseph’s Hospital and Medical Center at the Kelly Center for Imaging Innovation’s Institutional Review Board.
Dual-energy X-ray absorptiometry
All total body DXA scans were performed in the morning after an overnight fast (no caloric intake after 8pm the night before the scans). Consecutive whole body composition measurements were performed in random order on two fan beam DXA machines – one being the Lunar Prodigy (enCORE 2003 software version 7.53.002, GE Lunar, Madison, WI, USA) and the second being the iDXA (enCORE version 15, GE Lunar Healthcare). Subjects were scanned using standard imaging and positioning protocols. With both DXA systems, the operator remained in the room with the subject during the scan. For measuring VAT, a region of interest was automatically defined by the iDXA software algorithm, with the caudal limit at the top of the iliac crest and the height set to 20% of the distance from the top of the iliac crest to the base of the mandible. FM data (gram) from iDXA were transformed into MRI adipose tissue volume using a constant correction factor (0.94 g/cm3), assuming a constant density for adipose tissue (11).
Magnetic resonance imaging
Abdominal imaging was done with a 3.0T Philips Ingenia scanner (Philips, Amsterdam, Netherlands). Volunteers were examined in a supine position, using 2 dS anterior coils and a dS posterior coil. Images were obtained in transverse slice orientation (two-point mDixon sequence; 8 stacks containing 8–12 slices each; thickness 10 mm; and 0.1 mm interslice gap; TR shortest (3,7ms); TE 1.4 ms; flip angle 10°). VAT volume as measured by MRI was determined according to an individually sized regions of interest (ROI) based on the respective VAT ROI estimates from the automated iDXA software algorithm (see Subjects and Methods/ Dual-energy X-ray absorptiometry) and were quantified using OsiriX image processing software (version 6.5.2). All MRI – VAT volumes were quantified twice in random order by a single radiologist blinded to participant data (CV 2.8% ± 3.1 (SD)).
Sample size calculation
Based on previous studies (3, 12) comparing the Lunar Prodigy and iDXA, using total FM of 23027 ± 10167 grams for Prodigy and 24351 ± 9543 grams for iDXA with a correlation coefficient of 0.97 between the measurements at a 2-sided alpha of 0.05, we calculated that 50 participants would give us a power of 0.94 to detect a difference in pfat. An additional 50 subjects were recruited to validate the prediction equation calculated in the first 50 subjects (see below).
Previous studies of VAT comparisons using CT scans and iDXA demonstrated an r-squared for the univariate model of DXA visceral fat regressed on CT visceral fat equal to 0.96. For our power calculation, we used a more conservative r-squared of 0.80 for the univariate model of MRI visceral fat with iDXA visceral fat. Thus, 40 participants would give us power of >0.9 to detect a significant association between these two measurements.
Statistical Analysis
To compare body composition measurements between the GE Lunar Prodigy DXA and GE Lunar iDXA systems on the same individuals, linear regression models and paired Student’s t-test were used for each of the main variables of interest (pfat, FM, and FFM). An equation was used to convert the pfat values, measured by iDXA on the first n=50 (n=47, please see Methods/Subjects section for clarification) individuals, to values measured by Lunar Prodigy in the same individuals. The results of this prediction were then validated against the measurements of the second n=50 (n=46) individuals. To compare the measured pfat values of the second 46 subjects (iDXA) to the predicted Lunar Prodigy values obtained by using the regression equation calculated from the first 47 subjects’ values, we calculated the difference between measured minus predicted pfat values for each subject and then tested these differences against 0, using one-sample Student’s t-tests.
We used linear regression models to assess the association between pfat values acquired with the Lunar Prodigy versus iDXA, as well as between visceral fat measured by iDXA and MRI. For both comparisons, we assessed the agreement between different imaging techniques and evaluated any systematic (intercept) or proportional (slope) bias by two methods using: Bland-Altman diagrams and the 95% limits of agreement procedure (13), and the non-parametric Passing-Bablok regression (14) which is more robust to the presence of outliers. The Cusum test was used to evaluate the linearity of the relationship. Lastly, the coefficient of variation (CV), the intra-class correlation (ICC) and the Spearman's rank-order correlation (rho) between the measures of body fat on each machine were also calculated.
Results
Comparison analysis Lunar Prodigy DXA vs. iDXA
Demographic characteristics of the study population are presented in Table 1.
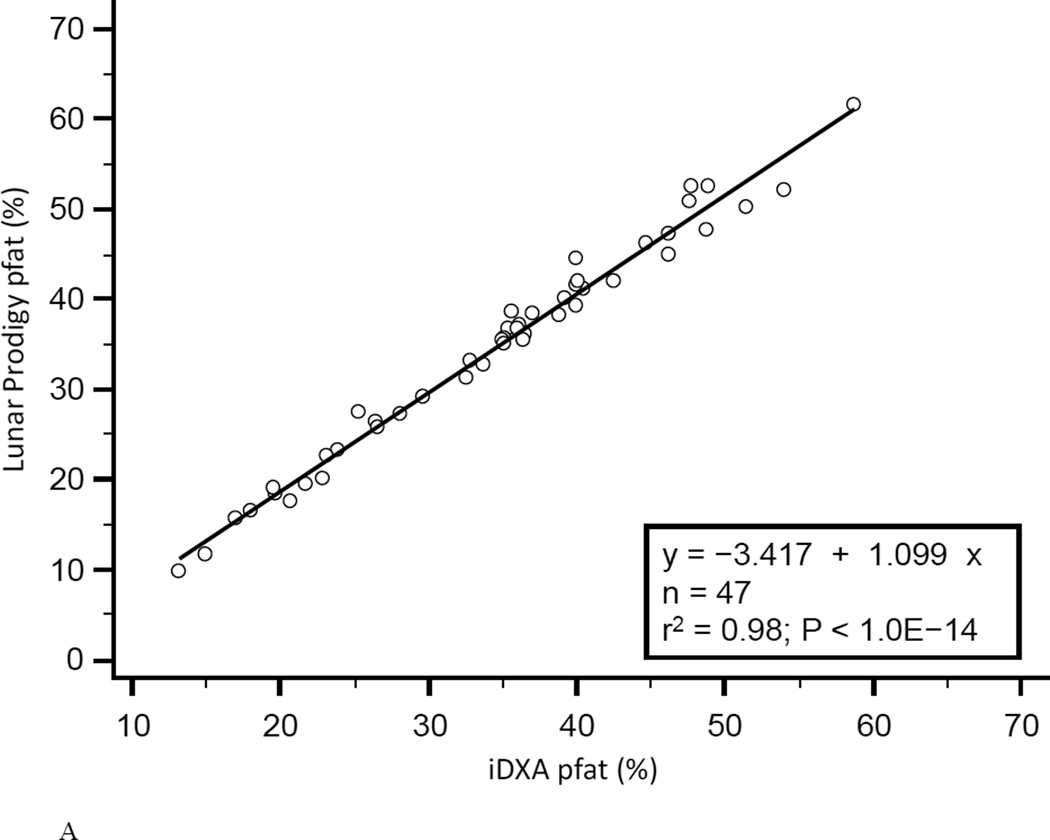
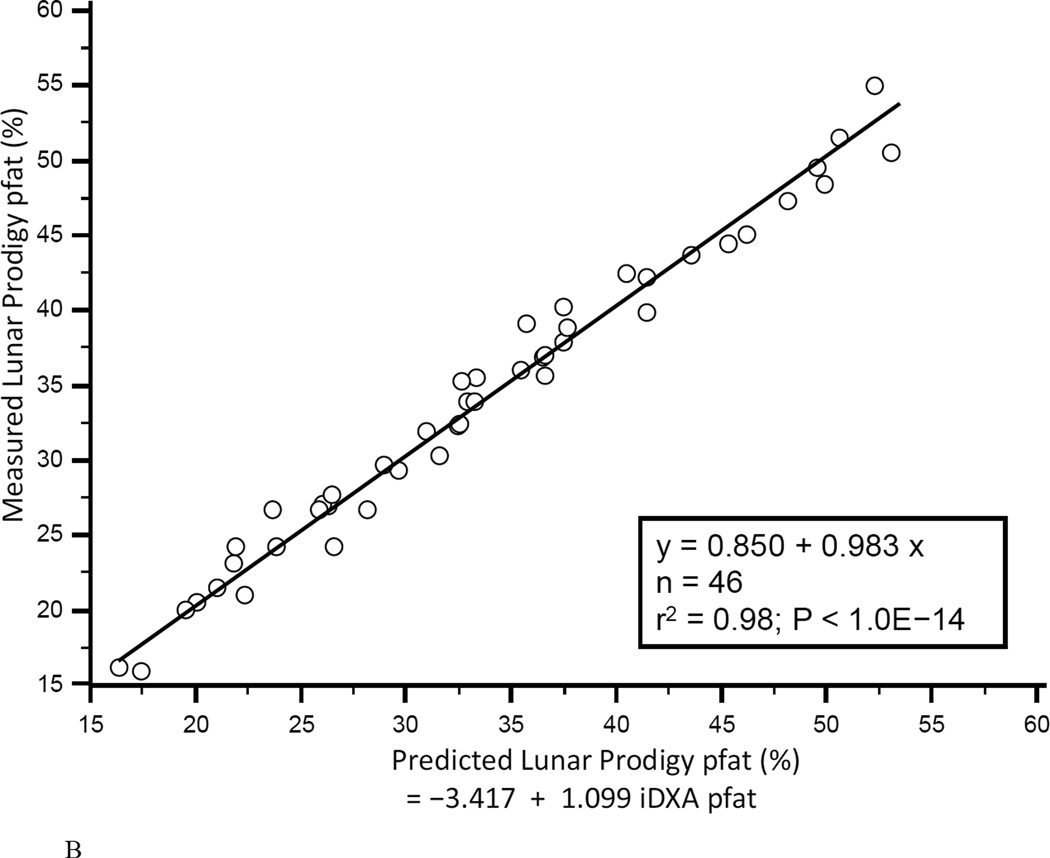
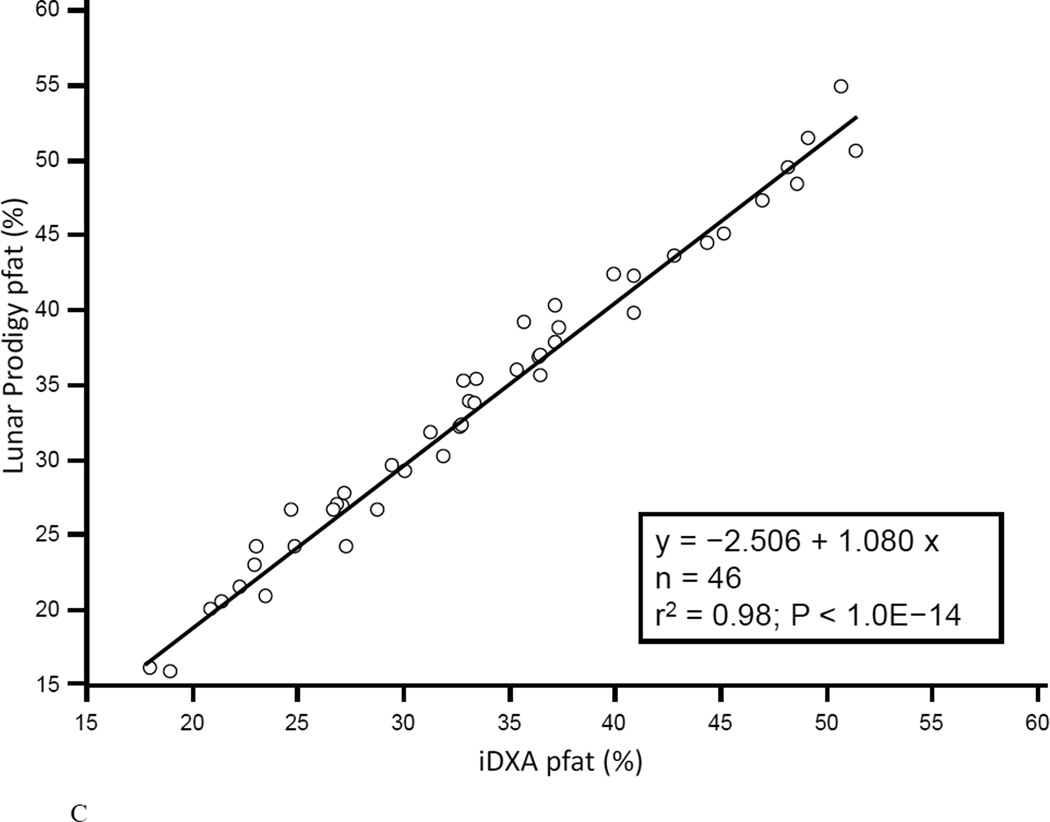
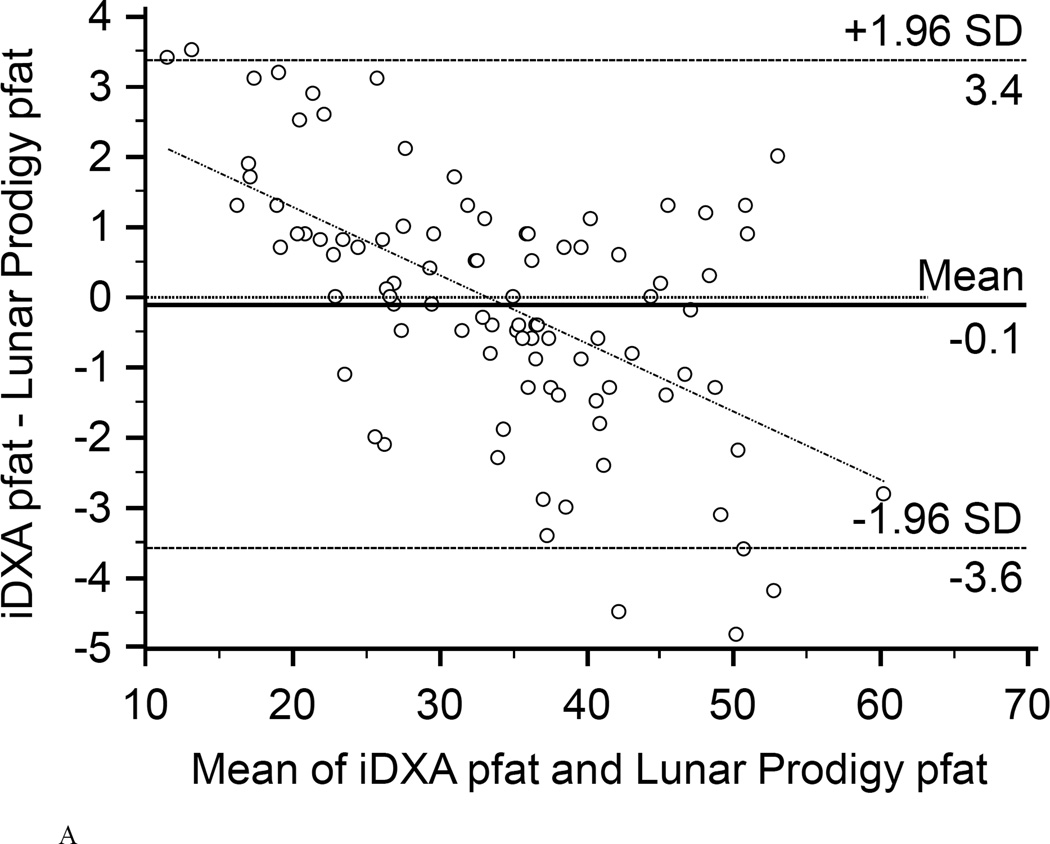
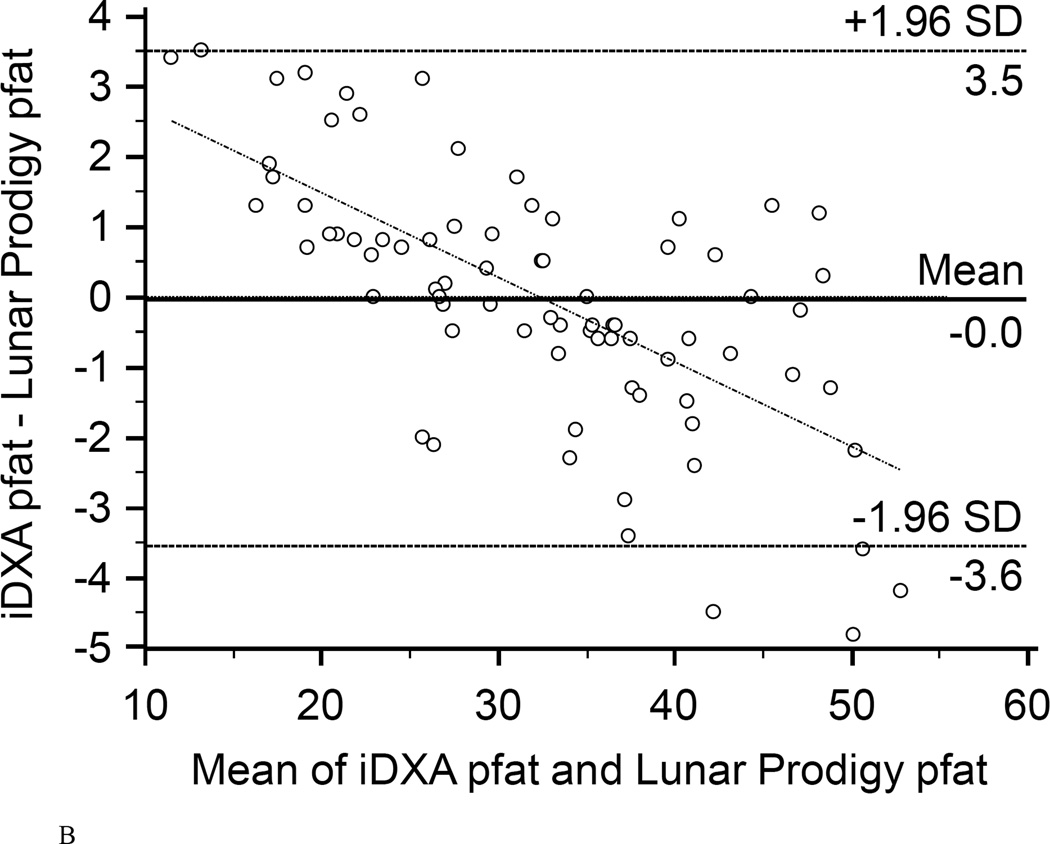
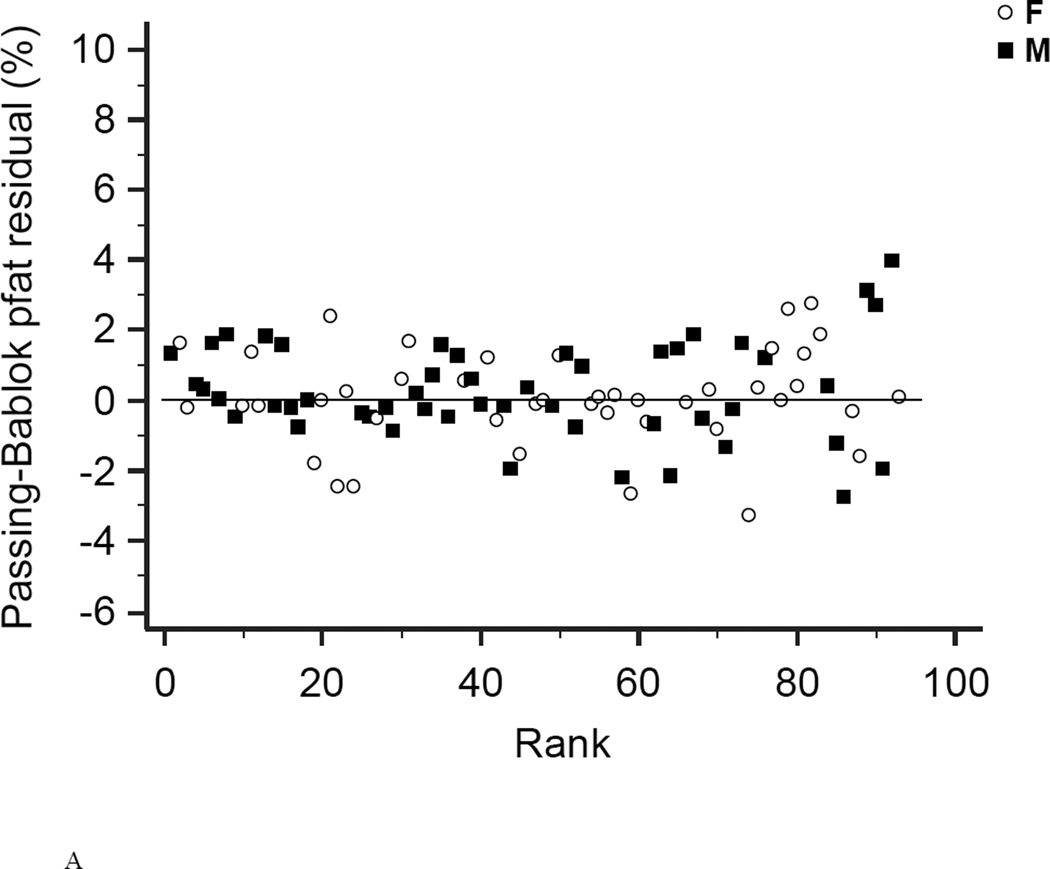
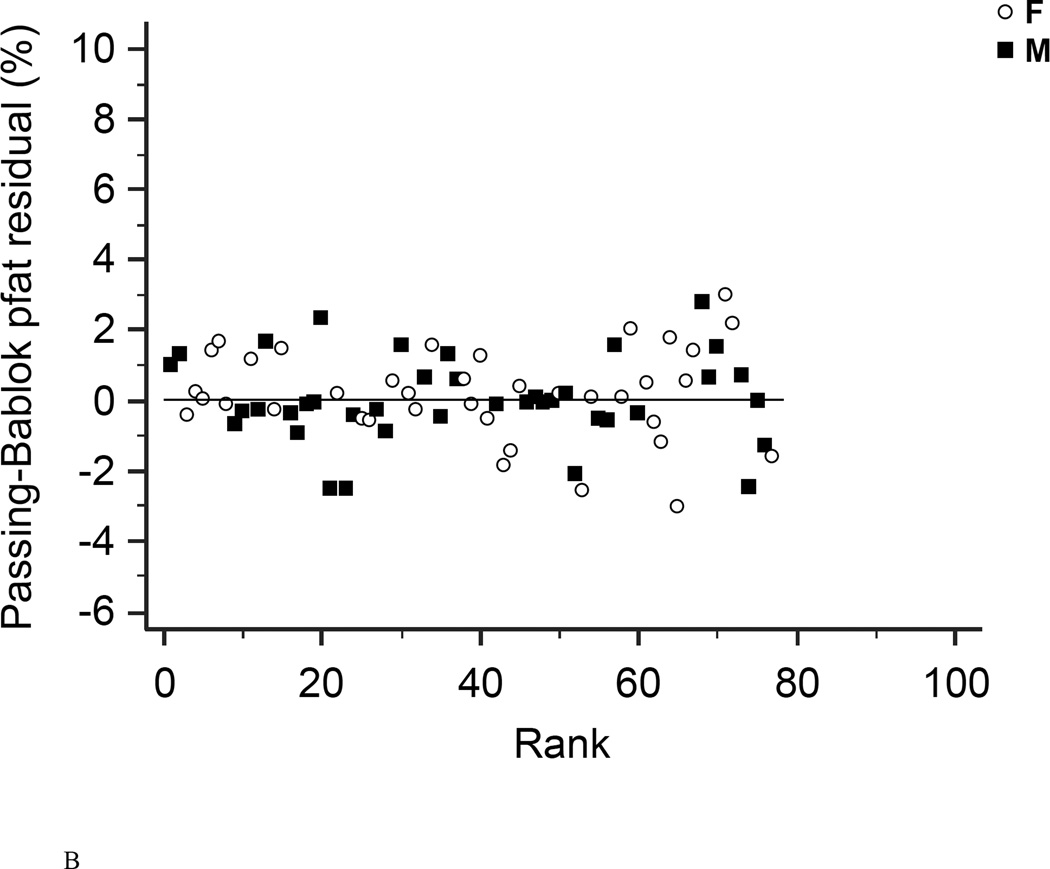
In the first 47 subjects, over a wide range of adiposity we found a strong correlation between the pfat values measured on both machines (r2=0.98, P<1.0E-14; Fig. 1A). We found an equally strong correlation when we used the regression equation obtained from the first 47 subjects (Lunar Prodigy DXA pfat = −3.417 + 1.099 × iDXA pfat) to calculate the predicted Lunar Prodigy DXA pfat values in the second cohort and compare them to measured values (r2=0.98, P<1.0E-14; Fig.1B). Furthermore, there was an equally strong correlation between the measured values of the second 46 subjects (r2=0.98, P<1.0E-14; Fig. 1C). The mean difference between the predicted Lunar Prodigy- versus measured (iDXA) pfat values was not significantly different from 0 (mean pfat difference = 0.27%, 95% confidence interval: −0.15 to 0.70, P=0.21). The mean absolute error (MAE) of the pfat prediction was 1.7%, ranging from 0.1% to 9.8%. The ICC for all 93 pfat measurements performed on both machines was 0.986 (95% CI: 0.979 to 0.991), the CV was 3.6%. In the entire group (n=93), pfat, FM, and FFM measurements were not significantly different between the two systems (paired t-test: P=0.59; P=0.58; P=0.58, respectively). The Bland-Altman plots (Fig 2A–B) demonstrated a bias with higher measured pfat on iDXA versus Lunar Prodigy DXA in leaner subjects and the opposite in more overweight subjects. As mentioned above, 7 participants with improperly positioned half-right body scans were excluded from all analyses. To assess the impact of excluding those half scans, we performed a sensitivity analysis with and without these 7 scans included, and then without all half-scans. Compared to the correlation between the two scans calculated in the whole cohort (N=100, r2=0.95, P<1.0E-14), excluding these scans did produce a marginal improvement in the correlation between the two DXA systems (N=93, r2=0.98, P<1.0E-14; N=77, r2=0.98, P<1.0E-14). For the half scans only (n=23), the ICC was 0.89 (95% CI: 0.76 to 0.95), and the CV was 6.5%. After removal of all 23 half-right scans, the Bland-Altman bias was more pronounced (Fig. 2A, and B). Linearity of relationships between methods was confirmed by the Cusum test for all N=100, N=93, and N=77 (P=0.70, P=0.64, P=0.71, Fig.3 A–B, respectively). Preservation of individual ranks was also confirmed by the Spearman's correlation (n=100: rho=0.98; n=77: rho=0.99, both P<0.0001). Non-parametric Passing-Bablok regression confirmed the bias seen in the Bland-Altman analyses with a significant proportional difference (slope=3.0, 95% CI: 2.24 to 3.85, N=93) and systematic difference (intercept=0.90, 95% CI: 0.88 to 0.93, N=93) between the two methods.
Figure 1. Correlation between Lunar Prodigy and iDXA total body percentage body fat measurements.
Figures 1A shows the correlation between pfat measured with the Lunar Prodigy and iDXA in the first 47 men and women (r2=0.98, P<1.0E-14). Figures 1B shows the predicted n=46 Lunar Prodigy pfat values based on iDXA measurements versus the actual measures for the second cohort (r2=0.98, P<1.0E-14, Lunar Prodigy = −3.417 + 1.099 × iDXA), and Figure 1C shows the correlation of second cohort (n=46) subjects’ percentage pfat measured by lunar DXA and iDXA (r2=0.98, P<1.0E-14; Lunar Prodigy = −2.506 + 1.080 × iDXA).
Figure 2. Bland-Altman plots.
Bland-Altman plots showing the limits of agreement (mean and 95% confidence interval) between paired values for pfat measured with the Lunar Prodigy and Lunar iDXA for all n=93 subjects (A), and after exclusion of all 23 half-right scans (B).
Figure 3. Residual diagrams.
Residual diagrams showing pfat values measured with the Lunar Prodigy and Lunar iDXA for all n=93 subjects (A), and after exclusion of all 23 half-right scans (B). Values are presented for men (squares) and women (circles) around the mean (solid line).
VAT measured with MRI vs. iDXA
Demographic characteristics of the 20 men and 20 women who also underwent a MRI scan are presented in table 1.
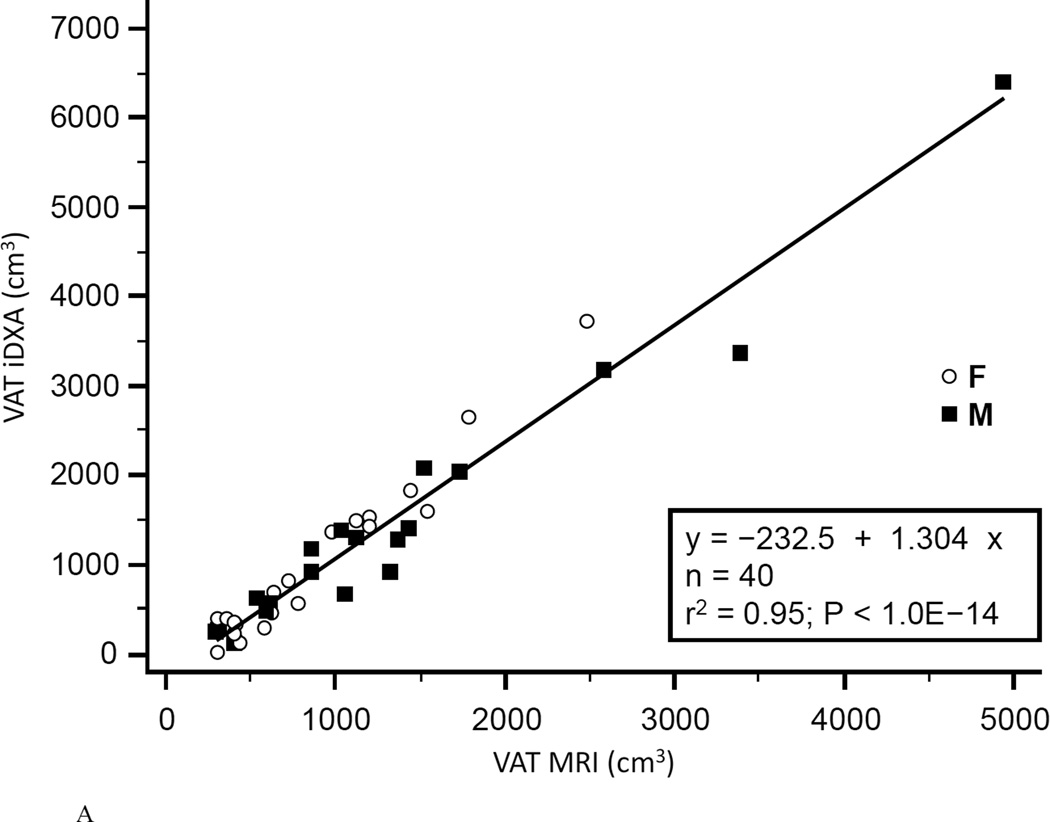
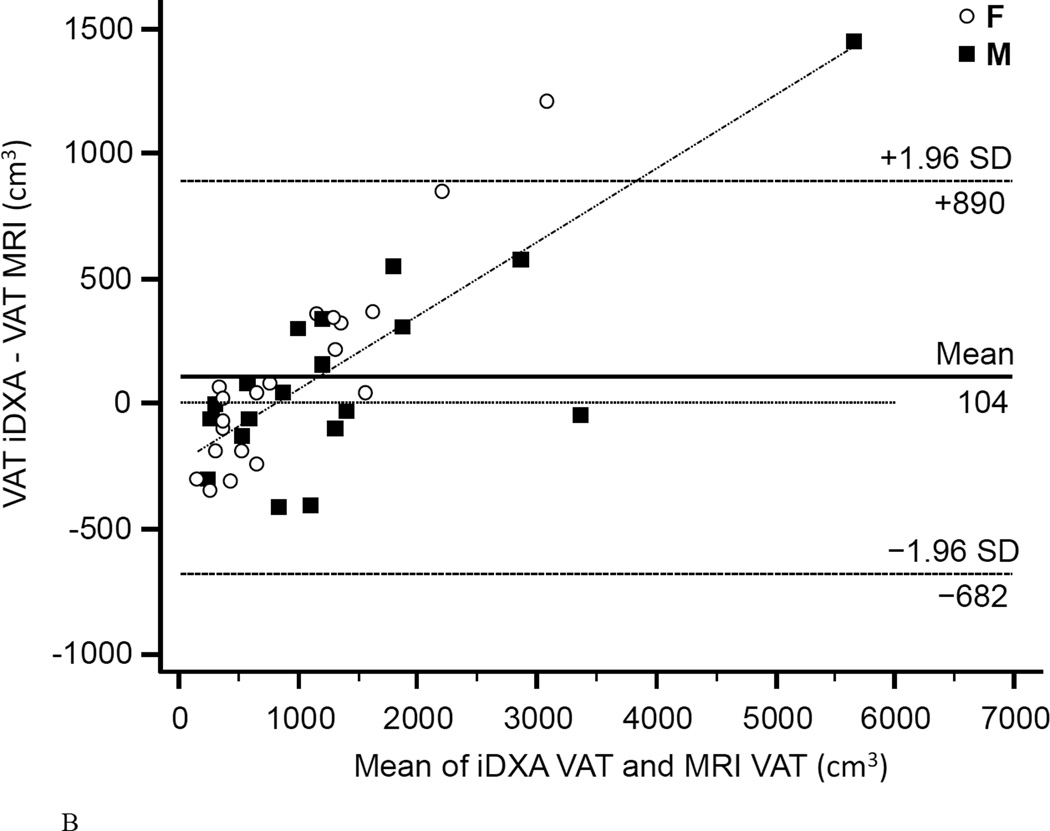
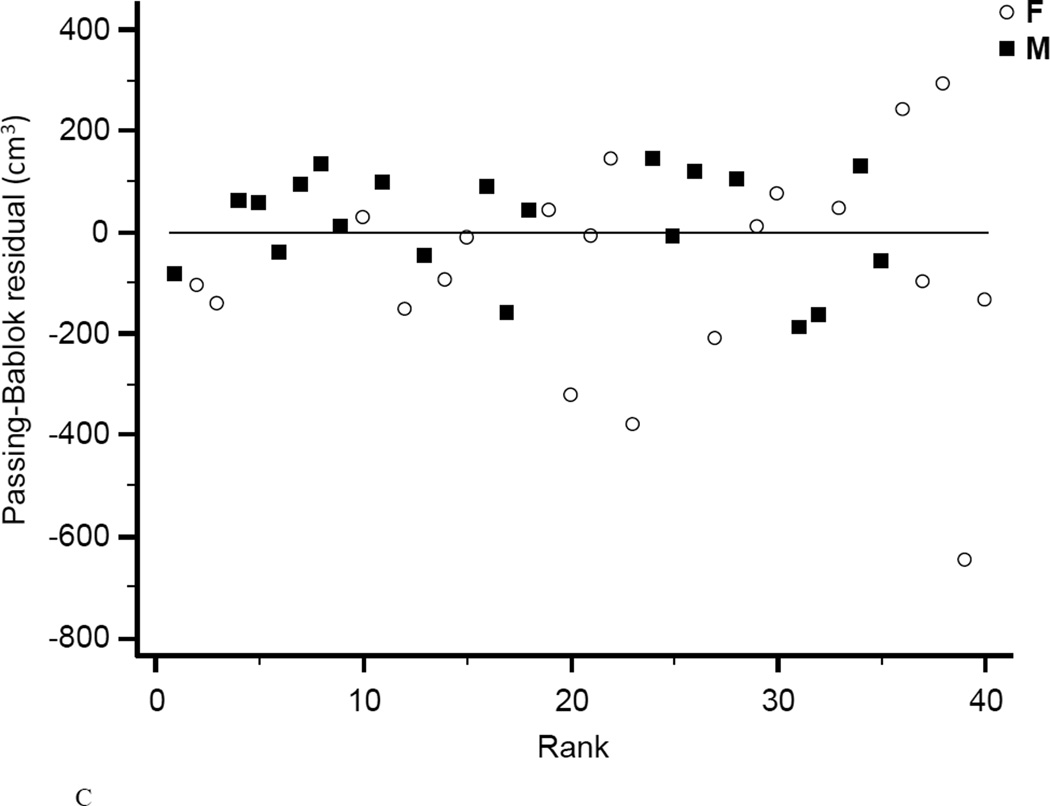
The coefficient of determination (r2) for regression of MRI on iDXA values was 0.958 for women, 0.959 for men, and 0.948 combined (Fig.4A). Bland-Altman bias was +103.6 cm3 for women and +104.6 cm3 for men. The 95% limits of agreement were −669.9 to +877.0 cm3 for women and −713.7 to +923.0 cm3 for men. Combined Bland-Altman bias was +104.1 cm3 with 95% limits of agreement of −681.9 to 890.0 cm3 (Fig.4B). Linearity of relationships between MRI and iDXA measurements of VAT was confirmed by the Cusum test (P=0.97). A significant proportional bias (slope=1.40, 95% CI: 1.28 to 1.57, n=40) between the two methods was confirmed by the Passing-Bablok non-parametric test (Fig.4C). A systematic difference over the total range of values (intercept) was estimated as 287 cm3 (95% CI: −442 to −159). The ICC of the VAT measurements performed by both methods was 0.93 (95% CI: 0.87 to 0.96), the CV was 25.0%.
Figure 4. Comparison of VAT mesaurement between iDXA and MRI methods.
Figure 4A shows the correlation between VAT measured with iDXA and MRI (r2=0.95, P<1.0E-14, N=40, VAT (iDXA) = −232.5 + 1.304 × VAT (MRI)). The Bland-Altman plot (B) shows the limits of agreement (mean and 95% confidence interval) between paired values for VAT measured with iDXA and MRI. The residual diagram (C) shows VAT volume values measured with the Lunar iDXA for all n=40 subjects. Values are presented for men (squares) and women (circles) around the mean (solid line).
Discussion
This study compared body composition from two fan-beam DXA systems and VAT volume of iDXA versus MRI. While the overall correlation between percentage body fat values measured on the two different machines was very high in the 93 subjects over a wide BMI range, we did find a trend towards an overestimation of pfat measured with iDXA compared to Lunar Prodigy in leaner individuals and a slight underestimation of pfat in those at the higher ranges of adiposity. We also found that VAT measured by iDXA showed a strong overall correlation with MRI but was slightly underestimated for lower VAT-volumes and overestimated for higher volumes, compared to MRI. For both methods comparison using rank regression did not demonstrate a bias in terms of order, indicated by the given linearity of the respective relationships.
Given the reported differences in pfat values measured by the two systems and in agreement with previous works (3, 12, 17) we recommend the employment of conversion equations derived from cross-calibration studies like ours. This procedure becomes crucial when upgrading DXA units during ongoing longitudinal data collection, e.g. in order to observe and quantify body composition changes during long-term weight gain or weight loss trials. However, albeit statistically significant, the small discrepancy between the two methods (pFAT error <1%) is not clinically relevant. The main component of the metabolic syndrome - visceral adipose tissue – seems to be strongly associated with cardio-metabolic risk factors, due to its metabolic activity (15). Furthermore, VAT has been shown to be predictive of all-cause mortality (16). Hence, precise estimation of VAT volume in both, cross sectional and longitudinal settings might be one of the important parameters in monitoring obesity.
With a population based overall rank correlation of r2=0.948, iDXA´s fully automated VAT estimation and MRI derived values are in strong agreement and consistent with previous studies (8, 10). However, we found an underestimation in leaner subjects and overestimation of VAT in subjects with greater adiposity in measuring VAT using iDXA versus MRI. This differs from prior studies, that found no significant BMI dependent variability (8), or the opposite directionality in the bias for measuring VAT (10). However, these studies compared body size-adjusted iDXA-VAT estimates with an arbitrarily standardized CT or MRI region of interest that was defined as 150 mm of the abdomen, starting at the top of S1 and moving toward the head. As noted in our methods, we were able to compare the same ROI designated by the iDXA software to the MRI. Thus, the strength of our study is that we compared that same estimated abdominal VAT from the same region of interest for both the iDXA and MRI. Given the demonstrated, clinically significant, systematic difference over the total range of VAT values between iDXA and the gold standard method MRI, we propose that iDXA-VAT measurements might be useful for relative VAT assessment in longitudinal studies, rather than for accurate absolute measurements.
This study did not include subjects under the age of 18 and over the age of 65, which limits the interpretation of our findings for these age groups. The conversion equations provided are tailored to our specific (though ethnically diverse and representative of a wide BMI range) study population, and might however not be perfectly suitable for any other study population. In addition, the half-body DXA scans used for some of the more obese subjects resulted in a greater difference between the measurements. The half scan has been validated on the same machine but not between machines. Given the automated algorithm for calculation of pfat, a slight difference in alignment on the table might account for these errors. We performed several sensitivity analyses to assess the impact of these scans, and still found an excellent agreement between the measurements.
In conclusion, the total percentage body fat measured by iDXA and Lunar Prodigy are strongly, and linearly associated and allow for conversion of iDXA for assessment of longitudinal body fat changes. Despite the under- and overestimation of pfat in subjects with very low and very high BMIs, the high rank correlation of abdominal visceral adipose tissue measures of iDXA with MRI which is considered the gold standard for this measurement makes iDXA a reliable, cost- and time effective alternative to MRI for use in cross-sectional and longitudinal studies.
What is already known about this subject?
Recent cross-calibration studies comparing precision of percentage (pfat) body fat measurements between different fan-beam DXA systems report excellent or good agreement between the systems and propose the use of translational equations to ensure comparability of body composition measurements.
Previous reports on the relationship of VAT measurements done by iDXA in comparison to CT or magnetic resonance imaging report a strong correlation of measured VAT between the iDXA and the other modalities across a wide range of body sizes and different ethnicities.
What does this study add?
As one of the few studies comparing the recently introduced iDXA (GE Healthcare) to older DXA systems (Lunar Prodigy) over a wide range of obesity, we found a strong correlation between measured pfat between the two machines, and a small bias with higher measured pfat on iDXA v Lunar Prodigy in leaner subjects and the opposite in more overweight subjects.
We also found excellent agreement of VAT estimates between iDXA and MRI, which were for the first time measured from the same defined abdominal region.
Acknowledgments
Funding: This research was supported by the Intramural Research Program of the National Institutes of Health, National Institute of Diabetes and Digestive and Kidney Diseases.
The authors thank the dietary, nursing, and technical staff of the National Institutes of Health Clinical Unit in Phoenix, AZ, for their assistance. We thank James G. Pipe and his team of the Barrow Neurological Institute/ Neuroimaging Research Section in Phoenix, AZ for providing excellent MR-imaging. Most of all, the authors thank the volunteers for their participation in the study.
Footnotes
Trial registration: clinicaltrials.gov Identifier: NCT02346474
Disclosure: The authors have nothing to disclose.
Authors Contributions: M.R. wrote the protocol and the manuscript. M.R., P.P., and J.K. analyzed the data. M.R., and J.K., designed the study. B.D, C.T. contributed to the study design and collected data. M.R., P.P., B.D, C.T. and J.K. contributed to the interpretations of findings and commented on and edited the drafts. J.K. is the guarantor of this work and, as such, had full access to all the data in the study and takes responsibility for the integrity of the data and the accuracy of the data analysis.
References
- 1.Soriano J-MP, Ioannidou E, Wang J, Thornton JC, Horlick MN, Gallagher D, et al. Pencil-Beam vs Fan-Beam Dual-Energy X-Ray Absorptiometry Comparisons Across Four Systems: Body Composition and Bone Mineral. J Clin Densitom. 2004;7(3):281–289. doi: 10.1385/jcd:7:3:281. [DOI] [PubMed] [Google Scholar]
- 2.Hind K, Oldroyd B, Truscott JG. In vivo precision of the GE Lunar iDXA densitometer for the measurement of total body composition and fat distribution in adults. Eur J Clin Nutr. 2011 Jan;65(1):140–142. doi: 10.1038/ejcn.2010.190. [DOI] [PubMed] [Google Scholar]
- 3.Malouf J, DiGregorio S, Del Rio L, Torres F, Marin AM, Farrerons J, et al. Fat tissue measurements by dual-energy x-ray absorptiometry: cross-calibration of 3 different fan-beam instruments. J Clin Densitom Off J Int Soc Clin Densitom. 2013 Jun;16(2):212–222. doi: 10.1016/j.jocd.2012.04.003. [DOI] [PubMed] [Google Scholar]
- 4.Després JP, Moorjani S, Lupien PJ, Tremblay A, Nadeau A, Bouchard C. Regional distribution of body fat plasma lipoproteins, and cardiovascular disease. Arterioscler Dallas Tex. 1990 Aug;10(4):497–511. doi: 10.1161/01.atv.10.4.497. [DOI] [PubMed] [Google Scholar]
- 5.Boyko EJ, Fujimoto WY, Leonetti DL, Newell-Morris L. Visceral adiposity and risk of type 2 diabetes: a prospective study among Japanese Americans. Diabetes Care. 2000 Apr;23(4):465–471. doi: 10.2337/diacare.23.4.465. [DOI] [PubMed] [Google Scholar]
- 6.Després J-P, Lemieux I. Abdominal obesity and metabolic syndrome. Nature. 2006 Dec 14;444(7121):881–887. doi: 10.1038/nature05488. [DOI] [PubMed] [Google Scholar]
- 7.Vega GL, Adams-Huet B, Peshock R, Willett D, Shah B, Grundy SM. Influence of body fat content and distribution on variation in metabolic risk. J Clin Endocrinol Metab. 2006 Nov;91(11):4459–4466. doi: 10.1210/jc.2006-0814. [DOI] [PubMed] [Google Scholar]
- 8.Kaul S, Rothney MP, Peters DM, Wacker WK, Davis CE, Shapiro MD, et al. Dual-energy X-ray absorptiometry for quantification of visceral fat. Obes Silver Spring Md. 2012 Jun;20(6):1313–1318. doi: 10.1038/oby.2011.393. [DOI] [PMC free article] [PubMed] [Google Scholar]
- 9.Lin H, Yan H, Rao S, Xia M, Zhou Q, Xu H, et al. Quantification of visceral adipose tissue using lunar dual-energy X-ray absorptiometry in Asian Chinese. Obesity. 2013 Oct 1;21(10):2112–2117. doi: 10.1002/oby.20325. [DOI] [PubMed] [Google Scholar]
- 10.Choi YJ, Seo YK, Lee EJ, Chung Y-S. Quantification of Visceral Fat Using Dual-Energy X-Ray Absorptiometry and Its Reliability According to the Amount of Visceral Fat in Korean Adults. J Clin Densitom. 2015 Apr;18(2):192–197. doi: 10.1016/j.jocd.2015.02.001. [DOI] [PubMed] [Google Scholar]
- 11.Martin AD, Daniel MZ, Drinkwater DT, Clarys JP. Adipose tissue density, estimated adipose lipid fraction and whole body adiposity in male cadavers. Int J Obes Relat Metab Disord J Int Assoc Study Obes. 1994 Feb;18(2):79–83. [PubMed] [Google Scholar]
- 12.Hull H, He Q, Thornton J, Javed F, Allen L, Wang J, et al. iDXA, Prodigy, and DPXL dual-energy X-ray absorptiometry whole-body scans: a cross-calibration study. J Clin Densitom Off J Int Soc Clin Densitom. 2009 Mar;12(1):95–102. doi: 10.1016/j.jocd.2008.09.004. [DOI] [PMC free article] [PubMed] [Google Scholar]
- 13.Bland JM, Altman DG. Statistical methods for assessing agreement between two methods of clinical measurement. Lancet. 1986 Feb 8;1(8476):307–310. [PubMed] [Google Scholar]
- 14.Passing H Bablok null. A new biometrical procedure for testing the equality of measurements from two different analytical methods. Application of linear regression procedures for method comparison studies in clinical chemistry, Part I. J Clin Chem Clin Biochem Z Für Klin Chem Klin Biochem. 1983 Nov;21(11):709–720. doi: 10.1515/cclm.1983.21.11.709. [DOI] [PubMed] [Google Scholar]
- 15.Fox CS, Massaro JM, Hoffmann U, Pou KM, Maurovich-Horvat P, et al. Abdominal visceral and subcutaneous adipose tissue compartments: association with metabolic risk factors in the Framingham Heart Study. Circulation. 2007;116:39–48. doi: 10.1161/CIRCULATIONAHA.106.675355. [DOI] [PubMed] [Google Scholar]
- 16.Katzmarzyk PT, Mire E, Bouchard C. Abdominal obesity and mortality: the Pennington Center Longitudinal Study. Nutr. Diabetes. 2012;2:e42. doi: 10.1038/nutd.2012.15. [DOI] [PMC free article] [PubMed] [Google Scholar]
- 17.Morrison SA, Petri RM, Hunter HL, Raju D, Gower B. Comparison of the Lunar Prodigy and iDXA Dual-Energy X-ray Absorptiometers for Assessing Total and Regional Body Compostion. J Clin Densitom. 2016 Jul-Sep;19(3):290–297. doi: 10.1016/j.jocd.2015.06.003. [DOI] [PMC free article] [PubMed] [Google Scholar]


