

Abstract
Prospective evaluation of youths with early psychotic‐like experiences can enrich our knowledge of clinical, biobehavioral and environmental risk and protective factors associated with the development of psychotic disorders. We aimed to investigate the predictors of persistence or worsening of psychosis spectrum features among US youth through the first large systematic study to evaluate subclinical symptoms in the community. Based on Time 1 screen of 9,498 youth (age 8‐21) from the Philadelphia Neurodevelopmental Cohort, a subsample of participants was enrolled based on the presence (N=249) or absence (N=254) of baseline psychosis spectrum symptoms, prior participation in neuroimaging, and current neuroimaging eligibility. They were invited to participate in a Time 2 assessment two years on average following Time 1. Participants were administered the Structured Interview for Prodromal Syndromes, conducted blind to initial screen status, along with the Schizotypal Personality Questionnaire and other clinical measures, computerized neurocognitive testing, and neuroimaging. Clinical and demographic predictors of symptom persistence were examined using logistic regression. At Time 2, psychosis spectrum features persisted or worsened in 51.4% of youths. Symptom persistence was predicted by higher severity of subclinical psychosis, lower global functioning, and prior psychiatric medication at baseline. Youths classified as having psychosis spectrum symptoms at baseline but not at follow‐up nonetheless exhibited comparatively higher symptom levels and lower functioning at both baseline and follow‐up than typically developing youths. In addition, psychosis spectrum features emerged in a small number of young people who previously had not reported significant symptoms but who had exhibited early clinical warning signs. Together, our findings indicate that varying courses of psychosis spectrum symptoms are evident early in US youth, supporting the importance of investigating psychosis risk as a dynamic developmental process. Neurocognition, brain structure and function, and genomics may be integrated with clinical data to provide early indices of symptom persistence and worsening in youths at risk for psychosis.
Keywords: Psychosis spectrum symptoms, psychotic‐like experiences, schizotypy, persistence, youth, follow‐up, predictors
Subclinical psychotic‐like experiences are relatively common in the general population of children and adolescents, occurring in as many as 22% of youths1, 2. Yet, they only develop into distressing and impairing psychotic disorders in a minority of them3. Increasing evidence supports psychosis as a continuum in the general population4, in which the experience and expression of multiple dimensions of symptoms can be detected in childhood or adolescence5. Examination of these early symptoms may enrich our knowledge of biobehavioral and environmental risk and protective factors associated with the psychotic disorder end of the continuum6. In turn, this line of research can inform early interventions and pathways to care for youths who are in the process of developing psychotic disorders.
Prospective studies in community youths suggest that 75‐90% of psychotic‐like experiences are transient1, 7. Some early psychotic‐like experiences may reflect vulnerability for psychotic disorders, with onset of sub‐threshold symptoms occurring as long as 7‐8 years prior to a first episode of psychosis8, 9. However, other early experiences may be “transdiagnostic” and “incidental” to other mental disorders such as depression and anxiety4. In other youths, early symptoms may reflect trait‐like characteristics that later manifest as schizotypy, consistent with a broadly defined risk state5. Finally, in some youths, symptoms may never be associated with a clinical disorder and thus never come to clinical attention, possibly due to their low severity and/or to protective factors10. The field has increasingly sought to explicate predictors and mechanisms of symptom course that may differentiate such varying developmental trajectories.
General population cohort studies conducted outside of the US have suggested that more severe and persistent sub‐threshold psychotic symptoms are associated with greater risk of conversion to psychotic disorders1, 11, 12, 13. In adolescents, the longer subclinical symptoms persist, the greater the likelihood of impairment1. Persistence of psychotic‐like experiences in youths has also been associated with other forms of psychopathology14, 15, cannabis use, childhood trauma, developmental problems, ethnic minority status, and mental health help seeking13. Such findings have been interpreted as supporting a proneness‐persistence‐impairment model of psychosis16, in which early expressions of psychotic‐like experiences may persist and subsequently become clinically impairing, depending on genetic vulnerability interacting with exposure to environmental risk factors and/or stressors. Evidence that varying trajectories of sub‐threshold positive and negative/disorganized symptom domains may differentially predict functional impairment and help‐seeking behavior has further supported the importance of a multi‐dimensional and developmental view of psychosis spectrum symptoms17.
In the US prospective investigations of psychosis spectrum symptoms in the general non‐help‐seeking youth population have been limited to schizotypal features among adolescent/early adult college students18 and young twins19. Though considerable research has centered on prospective investigations of help‐seeking clinical high‐risk youth20, there is a gap in our understanding of risk and resilience factors that influence psychosis outcomes among the general population of US youth. Moreover, as detection of psychosis spectrum experiences has continued to extend earlier in the lifespan, there is an increasing need to differentiate early stable traits from subclinical psychotic‐like states that may portend risk for psychosis5.
Through the Philadelphia Neurodevelopmental Cohort, we aimed to investigate the predictors of persistence or worsening of psychosis spectrum features in the first large systematic community sample of US youths. As previously reported21, we found that, among medically healthy youths aged 11‐21, 3.7% reported threshold psychotic symptoms (delusions and/or hallucinations). An additional 12.3% reported significant sub‐psychotic positive symptoms. Odd/unusual thoughts and auditory perceptions, followed by reality confusion, were the most discriminating and widely endorsed attenuated symptoms.
In a series of investigations, we have found baseline psychosis spectrum status to be associated with reduced global functioning, and increased odds of depression, anxiety, behavioral disorders, substance use and suicidal ideation21, as well as minority ethnic group membership22. Youths with psychosis spectrum symptoms had reduced accuracy across domains of neurocognitive function21 and were neurocognitively delayed across the age range compared to asymptomatic youths23.
Our neuroimaging studies have identified patterns of structural24, 25 and functional26 abnormalities in the psychosis spectrum group, including novel evidence for functional dysconnectivity27, similar to patterns observed in adults with psychotic disorders. Aspects of prefrontal executive system dysfunction and limbic hyperactivation to threat appear to be selectively associated with psychosis spectrum symptoms in comparison with other psychopathology dimensions28.
To date, few community cohorts have evaluated a wide array of biobehavioral predictors of the persistence of psychosis risk symptoms. The Philadelphia Neurodevelopmental Cohort is uniquely suited to widening the window of investigation of neurobehavioral risk and protective factors associated with varying psychosis spectrum trajectories and outcomes among US youth. Here we conducted a two‐year follow‐up of a large subsample (N=503) of youth from the cohort, selected on the basis of presence or absence of psychosis spectrum features at baseline and neuroimaging eligibility. The aim of this first report from the follow‐up study is to evaluate clinical patterns and predictors of symptom persistence.
METHODS
Participants
Participants were recruited for follow‐up based on Philadelphia Neurodevelopmental Cohort Time 1 (baseline) psychosis spectrum screening21, 29. Briefly, at Time 1, prospective participants (N=50,293) were recruited through the Children's Hospital of Philadelphia pediatric clinical health care network, extending to over 30 clinical community sites in the Philadelphia tri‐state area (Pennsylvania, New Jersey and Delaware). Participants were not recruited from psychiatric clinics. Initial review of electronic medical records for preliminary eligibility yielded a pool of 19,161 participants between the ages of 8 and 21, who had provided written informed consent/assent to be re‐contacted for future studies, were proficient in English, and did not appear to have significant developmental delays or physical conditions that would interfere with their ability to complete study procedures.
From the recruitment pool, 13,598 participants were invited, 9,498 were enrolled, and 9,421 completed the assessment. Time 1 assessment consisted of psychopathology screen, including screen for psychosis spectrum symptoms, and computerized neurocognitive testing for all participants21. A subset of 1,601 participants completed the imaging procedures.
From the cohort of 9,498 youths aged 8‐21 at Time 1, participants (N=1,486) were identified for follow‐up assessment if they screened either positive or negative for psychosis spectrum symptoms (as detailed below), were physically healthy at Time 1 (no moderate or severe physical conditions requiring multiple procedures and monitoring30), had completed the neuroimaging protocol ≥18 months previously, and had good quality neuroimaging data31. To maximize the number of subjects scanned at Time 2, a small subset of participants screening positive for psychosis spectrum symptoms who had not previously completed neuroimaging were also included in the recruitment pool.
From this pool, 61% (N=910) could be reached for further screen and invitation to participate. Among those invited, 56% (N=510) completed study procedures, 21% (N=182) declined (e.g., lived too far, away at school, not interested), 15% (N=118) were excluded due to conditions precluding imaging or cognitive testing (e.g., orthodontic braces, metal in body, pregnant, serious central nervous system disease), and 8% (N=55) had recurrent cancellations/no‐shows for scheduled appointments. The current investigation included the 503 participants with complete Time 2 clinical data at the time of our analyses.
After complete description of the study, written informed consent was obtained for participants aged at least 18, and written assent and parental permission were obtained from children aged less than 18 and their parent/legal guardian. All procedures were approved by the University of Pennsylvania and the Children's Hospital of Philadelphia Institutional Review Boards.
Psychopathology measures
Time 1
Interviews
Probands (age 11‐21) and collaterals (parent or legal guardian for probands aged 8‐17) were administered a computerized structured interview (GOASSESS)21. This instrument assessed psychiatric and psychological treatment history, and lifetime occurrence of major domains of psychopathology – including mood, anxiety, behavioral and eating disorders – and suicidal thinking and behavior.
Three screening tools to assess psychosis spectrum were embedded within the psychopathology screen. Positive sub‐psychotic symptoms in the past year were assessed with the 12‐item assessor administered PRIME Screen‐Revised (PS‐R)32, 33. Items were self‐rated on a 7‐point scale ranging from 0 (“definitely disagree”) to 6 (“definitely agree”). The participant then rated the duration of each endorsed symptom. Positive psychotic symptoms (lifetime hallucinations and delusions) were assessed using the Kiddie‐Schedule for Affective Disorders and Schizophrenia (K‐SADS)34 psychosis screen questions, supplemented with structured questions to reduce false positives. Negative/disorganized symptoms were assessed using six embedded assessor rated items from the Scale of Prodromal Symptoms (SOPS)35.
Psychopathology summary measures
Psychopathology was summarized into dimensions using factor analyses. For previous analyses, we used psychopathology summary measures21, 29 or a bifactor model with individual items that produced orthogonal scores28. For the current analyses, we wished to use and interpret Time 1 psychopathology scores as potential predictors of Time 2 psychosis spectrum status. However, there is a debate in the field regarding the validity of bifactor sub‐factor scores used in this way36, 37. Consequently, we used a correlated‐traits model to generate oblique scores. Specifically, we performed exploratory factor analyses (EFAs)38 on 112 individual GOASSESS items. Four factors were extracted, and we used various combinations of extraction (maximum likelihood, least squares, etc.) and rotation (oblimin, geomin, promax, etc.) methods to test for consistency across methods. The four‐factor model was based on the finding of Krueger39 that common mental disorders tend to group into three main categories, which he termed “anxious‐misery”, “fear”, and “externalizing”, and we additionally included GOASSESS items assessing psychosis, making four symptom clusters.
All extraction/rotation combinations yielded highly consistent results, with items almost never switching from one symptom cluster to another when a different extraction/rotation combination was used. Based on these EFA results, we performed a confirmatory factor analysis with four factors, each comprising the same items suggested by the EFAs. This model was used to calculate scores for each of the four correlated factors: anxious‐misery, fear, externalizing, and psychosis. All EFAs were performed using the psych package40, and the confirmatory factor analysis was performed using the mean‐ and variance‐adjusted weighted least squares estimator in Mplus41.
Finally, history of exposure to traumatic stressors was tabulated from the post‐traumatic stress disorder section of the GOASSESS, in which participants were asked about lifetime history of experiencing eight categories of events (i.e., natural disasters, witnessed violence, attacked physically, sexually assaulted/abused, threatened with weapon, experienced serious accident, witnessed serious physical injury/death, observed dead body).
Individuals meeting any one of the following three criteria were classified as having significant psychosis spectrum symptoms21: a) positive‐subpsychosis: either age‐deviant PS‐R total scores (as defined by extreme total scores, z ≥ 2, compared with age mates) or extreme agreement on the PS‐R (≥1 item rated 6, definitely agree; or ≥3 items rated 5, somewhat agree32); b) positive‐psychosis: possible or definite hallucinations or delusions based on K‐SADS screen, with duration ≥1 day, occurring outside the context of substance use, illness and medicines, and accompanied by significant impairment or distress (rating ≥5); c) negative/disorganized: age deviant negative/disorganized total scores on the SOPS, as defined by z ≥ 2 compared with age mates.
Additional measures
All measures were computerized locally. The Wide Range Achievement Test (WRAT‐4) Reading subscale42 provided an estimate of IQ. The majority of participants (N=6,298) completed an abbreviated version of a widely used self‐report measure43 assessing lifetime use of cannabis, alcohol, tobacco and illicit substances44.
As previously described45, neighborhood socioeconomic status scores were derived by factor analysis. This summary score reflects several socioeconomic characteristics of the participants’ neighborhoods (census blocks). Specifically, high scores reflect a high percent of residents who are married, low percent in poverty, high median family income, high percent with at least a high school education, low population density, high percent employed, low percent of vacant lots, and high median age. Low scores reflect the opposite.
Time 2
Interviews
Psychopathology was assessed using a custom protocol consisting of modules of the K‐SADS, the Structured Interview for Prodromal Syndromes (SIPS, version 4.034), and the psychotic and mood differential diagnosis modules (C/D) of the Structured Clinical Interview for DSM‐IV46. Collateral versions of the instruments were constructed and were identical to the standard proband versions, except that the wording of question stems was altered as appropriate for the informant (e.g., “Did you…?” was converted to “Did your child…?”).
In contrast to Time 1, when we employed highly structured screens, all Time 2 sections were administered in a semi‐structured manner, allowing follow‐up probing and clarification of endorsed items, as well as reconciliation of experiences across the interview. The K‐SADS modules provided a standardized and comprehensive assessment of DSM‐IV Axis I psychopathology (mood, attention deficit and hyperactivity, and substance use), including symptom and episode information for differential diagnoses of disorders, and clinical information about the diagnostic context of any reported sub‐psychotic symptoms.
Psychosis spectrum symptoms were assessed using the SIPS, in which selected symptom items from the K‐SADS were integrated to facilitate differential diagnosis. The SOPS35, embedded within the SIPS, describes and rates the severity of prodromal, psychotic and other symptoms occurring within the past 6 months. Dimensional symptom domains include positive (e.g., unusual thought content, persecutory ideas), negative (e.g., avolition), disorganized (e.g., odd behavior or appearance), and general (e.g., sleep disturbance). To provide a common psychosis spectrum measure across Time 1 and Time 2, the PS‐R was administered following the SIPS.
Social and role function was rated using the SIPS Global Assessment of Function35. Additional sections included construction of a timeline of major life events to facilitate accuracy of dating onset/offset of endorsed symptoms, demographics and medical history, psychiatric treatment history, history of suicidal thoughts and attempts, and current mental status (Mini‐Mental State Examination47). An abbreviated version of the Family Interview for Genetic Studies (FIGS)48, administered to collaterals (of probands < age 18) and adult probands, screened for presence or absence of first‐degree family history of major domains of psychopathology, with more detailed assessment of possible psychotic disorders following affirmative responses to psychosis‐related screening items. To avoid influence of proband status on judgments about psychosis family history, presence/absence was coded by the first author based on FIGS data contained in a blinded file, without reference to proband status at either Time 1 or Time 2.
All assessment tools were administered via a laptop computer using locally computerized versions in Filemaker to allow live data capture, verbatim recording of participant responses, and interactive checks of skip‐outs and section completion. Where relevant, releases for medical and psychiatric records were requested to supplement interview assessed information.
Following each evaluation, assessors integrated information from probands, collaterals and available medical records to provide combined ratings across symptom domains. Integrated clinical information was then summarized in a narrative case history, and presented at a case conference attended by at least two doctoral level clinicians with expertise in psychosis and/or child psychopathology. A strict blind was maintained such that recruiters, assessors and clinicians determining consensus ratings and diagnoses were naïve to the Time 1 psychosis spectrum screening status of all participants. To avoid biasing case assignment or symptom ratings, family history of psychopathology was not disclosed during case conference.
Each SOPS clinical rating ≥3 underwent consensus review, and clinical risk status and best estimate final diagnoses for Axis I disorders were determined. We also made consensus “prodromal” diagnoses according to standard SIPS attenuated prodromal syndrome (APS) criteria35, in which APS is diagnosed if at least one positive symptom rated 3‐5 had frequency ≥1 time a week in the past month as well as onset or worsening (≥1 or more SOPS scale point) within the past year. We created a parallel attenuated negative/disorganized syndrome (ANDS) classification to reflect recent onset or worsening of negative or disorganized symptoms with comparable frequency and onset/worsening criteria as for APS, but requiring ≥2 negative or disorganized symptoms to meet these criteria. Individuals were classified as meeting psychosis spectrum criteria if they had either a) a DSM‐IV psychotic disorder or mood disorder with psychotic features, or b) at least one SOPS positive symptom currently (past 6 months) rated 3‐5 or at least two negative and/or disorganized symptoms rated 3‐6.
Interviews were administered by bachelor's or master's level assessors who underwent formal training conducted by the first author. The training protocol consisted of a structured program of lectures, supervised practice sessions and mock interviews. Trainees then administered ≥5 interviews under direct observation by a certified observer until competency and consistency were established by scoring ≥85% on a standardized 60‐item rating scale assessing proficiency in administration. In addition, trainees were required to be completely reliable with the observer in determination of clinical significance (≥3) on all SOPS items, and within one scale point with observer on all other SOPS ratings. Ongoing calibration of ratings was achieved through case conference meeting attendance by all assessors, and periodic re‐training and direct observation.
Additional measures
Computerized assessment of substance use and estimated IQ (WRAT‐4) were identical to Time 1 assessment. To provide convergent and supplemental dimensional assessment of psychosis spectrum symptoms, a subset of participants (N=418) was administered a modified and computerized version of the Schizotypal Personality Questionnaire (SPQ). The SPQ is a multi‐dimensional true/false self‐report measure assessing each of the nine major features of schizotypal personality disorder as defined by the DSM49. Seven items modeled after the Infrequency Scale of the Personality Research Form were interspersed among SPQ items to assess random or careless responding50.
When completing the SPQ, participants were instructed to refrain from considering episodes when they were under the influence of drugs or alcohol, and periods when they were just falling asleep or awakening. Scores for the total SPQ and individual scales were based on an unweighted linear combination of the SPQ items endorsed in the psychopathological direction. Because the subscales differ in the number of constituent items (ranging from seven to nine), percentages of endorsed items per subscale were calculated to allow comparison of relative endorsements across subscales.
Statistical analysis
To first assess the representativeness of the enrolled sample with regards to the broader Philadelphia Neurodevelopmental Cohort, we compared Time 1 psychopathology indices of enrolled and non‐enrolled participants using t‐tests of factor scores. We then classified individuals into four groups based on psychosis spectrum classifications at Time 1 and Time 2: Persistent (psychosis spectrum symptoms at both Time 1 and Time 2); Resilient (psychosis spectrum symptoms at Time 1 but not Time 2); Emergent (psychosis spectrum symptoms at Time 2 but not Time 1); Typically Developing (psychosis spectrum symptoms at neither Time 1 nor Time 2).
We evaluated differences among these groups using ANOVA's and Cohen's d (quantitative variables) or chi‐square (categorical variables). Logistic regression then examined Time 1 demographic, psychopathology and substance use predictors of persistence vs. resilience (Statistical Package for Social Sciences, SPSS, version 22). Finally, we performed item analysis of positive sub‐psychosis items comparing endorsements between groups, summarizing symptom endorsement count, and conducting multivariate analysis of variance (MANOVA) of differences in mean item ratings. Receiver operating characteristic curve analyses identified positive sub‐psychosis items most predictive of Persistent vs. Resilient classification.
RESULTS
Recruitment analysis
Within Time 1 group, t‐tests of mean Time 1 overall psychosis spectrum factor scores indicated that participants successfully recruited for Time 2 follow‐up were comparable to those who were not enrolled (p=0.14; see Figure 1). They also did not differ in positive and negative psychosis symptoms (p=0.14 and 0.29, respectively), anxious‐misery (p=0.22), externalizing (p=0.29), and fear (p=0.29) scores. Note that all p values are corrected for the false discovery rate51.
Figure 1.
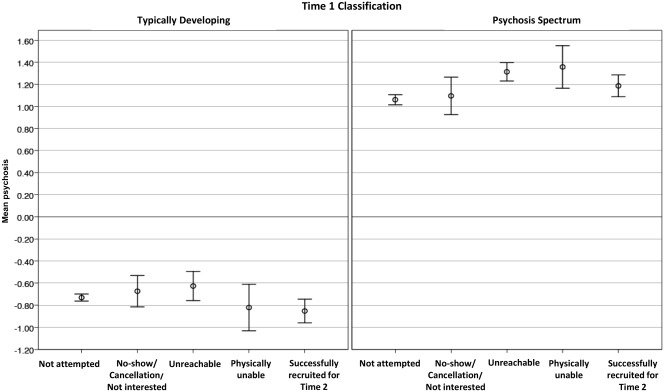
Mean psychosis scores at Time 1 by recruitment results at Time 2. Results are presented according to classification at Time 1 as Typically Developing (left panel) and Psychosis Spectrum (right panel)
Psychosis spectrum classification
Time 2 assessment results are depicted in Figure 2. Among youths screening positive at Time 1 (N=249), psychosis spectrum features persisted or worsened in 51.4% (Persistent, N=128), including 6.8% (N=17) diagnosed with threshold psychosis disorders (four with schizophrenia, one with schizoaffective disorder, one with delusional disorder, three with major depressive disorder with psychotic features, eight with psychotic disorder not otherwise specified). The remainder (N=121, 48.6%) did not have symptoms at Time 2, and were classified as Resilient, reflecting the absence of current clinically significant symptoms despite the history of elevated risk assessed at Time 1.
Figure 2.
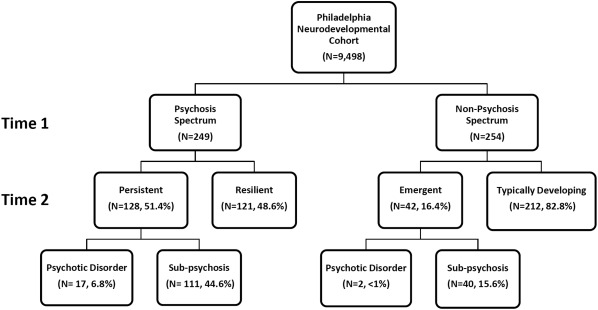
Assessment results at Time 2 in relation to psychosis spectrum classification at Time 1
The majority of youths screening negative at Time 1 (N=254) remained asymptomatic at Time 2 (Typically Developing, N=212). Psychosis spectrum symptoms emerged in 16.4% (Emergent, N=42), including two diagnosed with a psychotic disorder not otherwise specified.
Sensitivity and specificity of Time 1 screening measures were 0.75 and 0.64 respectively, corresponding to a positive predictive value of 0.51, and a negative predictive value of 0.83.
Characteristics of the sample
Demographic and clinical characteristics of the sample are presented in Table 1. The four groups were comparable in age at both Time 1 (range: 14.8 to 15.5 years) and Time 2 (range: 16.6 to 17.5 years). Although the mean follow‐up interval was approximately two years for all groups, the interval was, on average, two months longer for the Resilient group. Sex ratio and mean parental education (mother, father) did not differ among the groups. Neighborhood socioeconomic status at Time 1 was higher in Typically Developing youths than in all three groups reporting psychosis spectrum symptoms at either time point.
Table 1.
Demographic and clinical characteristics of youth at Time 1 and Time 2
| Persistent, P (N=128) | Resilient, R (N=121) | Emergent, E (N=42) | Typically Developing, T (N=212) | p | Pairwise | |
|---|---|---|---|---|---|---|
| Age, years (mean±SD) | ||||||
| Time 1 | 15.5 ± 2.5 | 15.0 ± 2.5 | 14.7 ± 2.9 | 14.8 ± 2.8 | n.s. | |
| Time 2 | 17.5 ± 2.6 | 17.1 ± 2.8 | 16.7 ± 2.9 | 16.6 ± 3.7 | n.s. | |
| Follow‐up interval, months (mean±SD) | 23.2 ± 7.9 | 25.8 ± 7.3 | 23.7 ± 5.3 | 23.2 ± 6.7 | 0.009 | R>P,T |
| Male/female | 61/67 | 55/66 | 22/20 | 100/112 | n.s. | |
| African‐American/Other (%) | 76.6 | 63.6 | 76.2 | 42.5 | 0.001 |
P>R,T R>T E>T |
| Parental education, years (mean±SD) | ||||||
| Mother | 13.2 ± 3.4 | 12.7 ± 4.9 | 12.5 ± 4.4 | 13.7 ± 4.6 | n.s. | |
| Father | 10.9 ± 5.6 | 11.7 ± 5.3 | 11.1 ± 5.2 | 12.2 ± 6.1 | n.s. | |
| Neighborhood socioeconomic status factor score (mean±SD) | −0.6 ± 1.0 | −0.4 ± 1.0 | −0.6 ± 1.0 | 0.0 ± 1.0 | 0.001 | P,R,E<T |
| Time 1 psychopathology factor scores (mean±SD) | ||||||
| Psychosis | 1.4 ± 0.9 | 1.0 ± 0.8 | −0.2 ± 1.0 | −0.6 ± 0.8 | 0.001 |
P>R,E,T R>E,T E>T |
| Anxious‐Misery | 1.1 ± 0.9 | 0.7 ± 0.9 | −0.1 ± 1.0 | −0.6 ± 0.9 | 0.001 |
P>R,E,T R>E,T E>T |
| Fear | 0.9 ± 1.0 | 0.6 ± 1.0 | −0.1 ± 1.1 | −0.6 ± 0.9 | 0.001 |
P>R,E,T R>E,T E>T |
| Externalizing | 0.8 ± 0.8 | 0.6 ± 0.8 | 0.0 ± 1.1 | −0.6 ± 0.8 | 0.001 |
P,R>E,T E>T |
| Time 1 PRIME‐Screen Revised, total (mean±SD) | 24.8 ± 14.0 | 18.4 ± 12.4 | 6.4 ± 7.4 | 2.4 ± 4.9 | 0.001 |
P>R,E,T R>E,T E>T |
| Time 1 PRIME‐Screen Revised, z (mean±SD) | 1.6 ± 1.4 | 1.0 ± 1.2 | −0.1 ± 0.7 | −0.4 ± 0.5 | 0.001 |
P>R,E,T R>E,T E>T |
| Time 1 Scale of Prodromal Symptoms, z (mean±SD) | 1.1 ± 1.5 | 0.6 ± 1.4 | −0.1 ± 0.8 | −0.5 ± 0.4 | 0.001 |
P>R,E,T R>E,T E>T |
| Time 1 Trauma exposure (mean±SD) | 1.6 ± 1.5 | 1.2 ± 1.3 | 1.0 ± 1.1 | 0.5 ± 0.8 | 0.001 |
P>R,E,T R, E>T |
| Time 1 Global Assessment Scale (mean±SD) | 69.3 ± 13.4 | 76.5 ± 11.4 | 80.4 ± 10.2 | 85.7 ± 7.7 | 0.001 |
P<R,E,T R<E,T E<T |
| Time 1 treatment (%) | ||||||
| Talked with professional | 68.8 | 54.2 | 45.2 | 34.1 | 0.001 |
P>R,E,T R>T |
| Psychiatric medications | 23.4 | 11.9 | 4.8 | 2.4 | 0.001 |
P>R,E,T R>T |
| Inpatient hospitalizations | 7.8 | 1.7 | 2.4 | 0.9 | 0.003 | P>R,T |
| Time 2 diagnosis (%) | ||||||
| Psychotic disorder | 13.3 | 0.0 | 4.8 | 0.0 | 0.001 |
P>R,T E>R,T |
| Major depressive disorder | 18.8 | 13.2 | 16.7 | 3.8 | 0.001 | P,R,E>T |
| Other mood disorder | 15.6 | 2.5 | 4.8 | 3.3 | 0.001 | P>R,T |
| Attention‐deficit/hyperactivity disorder | 21.9 | 9.9 | 7.1 | 4.7 | 0.001 | P>R,E,T |
| Alcohol abuse | 7.0 | 1.7 | 4.8 | 1.4 | 0.023 | P>R,T |
| Alcohol dependence | 3.1 | 1.7 | 0.0 | 1.4 | n.s. | |
| Substance abuse | 8.6 | 4.1 | 4.8 | 0.9 | 0.006 | P>T |
| Substance dependence | 6.3 | 5.0 | 2.4 | 1.9 | n.s. | |
| Time 2 Scale of Prodromal Symptoms, total (mean±SD) | ||||||
| Positive | 9.6 ± 5.2 | 2.4 ± 2.5 | 7.4 ± 4.5 | 1.6 ± 2.2 | 0.001 |
P>R,E,T R>T E>R,T |
| Negative | 7.6 ± 5.2 | 3.2 ± 3.4 | 7.3 ± 4.9 | 1.7 ± 2.3 | 0.001 |
P>R,T R>T E>R,T |
| Disorganized | 4.6 ± 3.3 | 1.3 ± 1.7 | 3.4 ± 2.5 | 0.7 ± 1.3 | 0.001 |
P>R,E,T R>T E>R,T |
| General | 4.0 ± 3.4 | 1.2 ± 2.2 | 4.2 ± 3.0 | 1.2 ± 1.9 | 0.001 |
P>R,T R>T E>R,T |
| Time 2 Mini‐Mental State Examination (mean±SD) | 31.4 ± 3.4 | 32.1 ± 2.3 | 31.5 ± 3.2 | 32.3 ± 2.2 | 0.001 | P,E<T |
| Time 2 Global Assessment of Functioning (mean±SD) | 59.7 ± 10.4 | 77.1 ± 13.1 | 64.6 ± 11.4 | 83.4 ± 10.0 | 0.001 |
P<R,E,T R<T E<R,T |
| Time 2 treatment history (%) | ||||||
| Talked with professional | 76.8 | 46.5 | 48.6 | 30.8 | 0.001 |
P>R,E,T R>T E>T |
| Psychiatric medications | 22.3 | 8.0 | 18.2 | 4.7 | 0.001 |
P>R,T E>T |
| Inpatient hospitalization | 11.5 | 3.4 | 10.8 | 1.0 | 0.001 |
P>R,T E>T |
| Time 2 family history of psychosis (%) | 22.6 | 7.7 | 8.3 | 3.1 | 0.001 | P>R,T |
Participants’ Time 2 classification was determined by positive and negative sub‐threshold psychosis spectrum endorsements at Time 1. Thus, the Persistent and Resilient groups had higher baseline PS‐R and SOPS scores compared to Emergent and Typically Developing. Notably, participants in the Persistent group also showed higher baseline Time 1 symptoms across psychopathology domains compared to the Resilient group. The Persistent group also showed comparatively lower baseline global functioning, and increased treatment seeking, including consulting a professional, inpatient hospitalizations, and prescription psychiatric medications. A minority of individuals in the Persistent group (N=8) were prescribed antipsychotic medicines.
The Resilient group also had higher levels of psychopathology and lower functioning at Time 1 than the Emergent and Typically Developing youths. Similarly, youths of the Emergent group had higher positive and negative/disorganized symptom levels and reduced functioning at Time 1 compared to youths who remained Typically Developing at follow‐up. Importantly, reported exposure to traumatic stressors was lower in Typically Developing youths than the other three groups, with the highest mean number of stressors experienced by those with persisting symptoms.
At Time 2, a greater number of youth in the Persistent group had comorbid mood disorders, attention‐deficit/hyperactivity disorder (ADHD), and alcohol and other substance abuse than the Resilient and Typically Developing groups. Major depressive disorder was least common in the Typically Developing group, and the groups did not differ in substance dependence rates. Youths who were never symptomatic had higher Mini‐Mental State Examination scores than those who previously or currently exhibited psychosis spectrum symptoms. Global functioning was lower in the Persistent than the other three groups, and both the Resilient and Emergent groups showed reduced global functioning compared to Typically Developing.
As shown in Table 1, the Persistent group showed the highest level of SOPS symptoms across symptom domains, though comparable to Emergent in negative and general symptoms. Examination of sub‐classifications revealed that, among the Persistent group, the majority (77.5%) exhibited a combination of significant (SOPS ratings ≥ 3) positive, negative and disorganized symptoms at Time 2, with a minority exhibiting only positive (18.0%) or only negative/disorganized (4.5%) symptoms. A comparable pattern was observed in the Emergent group (combination: 55%; only positive: 27.5%; only negative/disorganized: 17.5%). APS criteria were met in 26.4% and 23.7% of the Persistent and Emergent groups, respectively. An additional 5.7% (Persistent) and 13.2% (Emergent) fulfilled ANDS criteria, reflecting increased negative or disorganized symptoms within the past year.
More than two‐thirds of the Persistent group had spoken with mental health professionals, compared to close to one‐half of the Resilient and Emergent groups, and approximately one‐third of Typically Developing. The Persistent group was also more likely to have received psychiatric medications and undergone inpatient psychiatric hospitalization, but not more so than the Emergent group, who received these services at a higher rate than Typically Developing.
Sufficient family history data were available to determine presence or absence of first‐degree family history of psychosis for 438 participants (Persistent = 106, Typically Developing = 192, Resilient = 104, Emergent = 36). The Persistent group was more likely than the Resilient and Typically Developing, but not Emergent, groups to have a first‐degree family member with psychosis.
SPQ data were first screened for random or careless responding: 37 participants were excluded for endorsing three or more infrequency items, and the number was proportional across the groups (Persistent: 14/114, 12.3%; Resilient: 6/108, 5.6%; Emergent: 5/37, 13.5%; Typically Developing: 12/196, 6.1%; χ2=18.2, df=12, not significant). Following significant overall MANOVA of nine subscales (F=6.6; df=27,1224; p<0.001), tests of between‐subjects effects for all nine subscales were significant (all p values <0.001). Mean endorsement is graphed in Figure 3.
Figure 3.
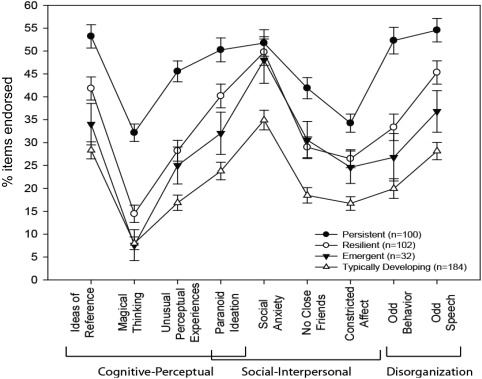
Items endorsed on subscales of the Schizotypal Personality Questionnaire by Time 2 classification
Pairwise post‐hoc tests of significance (all p values <0.05) revealed that the Persistent group endorsed more items than the Resilient, Emergent and Typically Developing groups on all subscales except social anxiety, on which they differed only from Typically Developing. Importantly, the Resilient group also endorsed more items across all subscales than Typically Developing, but did not differ from the Emergent group. The Emergent group differed from Typically Developing only in endorsing more items on Social Interpersonal subscales.
Predictors of persistence
The prediction success of Persistence vs. Resilience from demographic and clinical predictors was 68.6% (Persistent: 70.3%, Resilient: 67.0%; false positive: 16.6%, false negative: 14.8%). Receiver operator characteristic curve analysis revealed a moderate fit of the model (area under the curve = 0.74; 95% CI: 0.68‐0.81). Among Time 1 psychopathology variables, only higher overall psychosis factor score was a significant predictor of persistence. Lower Time 1 global functioning and Time 1 treatment with psychiatric medications also predicted persistence. No demographic or other treatment variables were predictive (Table 2). This pattern of results was not significantly altered when repeating the analysis with the smaller sample (N=192) with available family history data. Family history of psychosis was not robustly predictive of persistence, although there was a trend towards significance (p=0.075, odds ratio = 2.71), and the prediction success of this model was slightly improved (72.4%).
Table 2.
Bivariate logistic regression predicting persistence vs. resilience from Time 1 demographic and clinical variables
| Persistent | Resilient | B | Wald chi‐square | p | Odds ratio | 95% CI | ||
|---|---|---|---|---|---|---|---|---|
| Lower | Upper | |||||||
| Demographics | ||||||||
| Gender (% female) | 52.3 | 54.5 | −0.28 | 0.73 | n.s. | 0.78 | 0.40 | 1.43 |
| Age at Time 1, years (mean±SD) | 15.5 ± 2.5 | 14.9 ± 2.6 | 0.07 | 1.13 | n.s. | 1.07 | 0.94 | 1.22 |
| Ethnicity (% African‐American/Other) | 76.6 | 63.6 | 0.77 | 2.89 | n.s. | 2.16 | 0.89 | 5.24 |
| Mother education, years (mean±SD) | 13.8 ± 2.2 | 14.1 ± 2.2 | 0.03 | 0.11 | n.s. | 1.03 | 0.88 | 1.21 |
| Father education, years (mean±SD) | 13.1 ± 2.2 | 13.4 ± 2.4 | −0.02 | 0.07 | n.s. | 0.98 | 0.84 | 1.15 |
| WRAT‐4 Reading (mean±SD) | 96.9 ± 16.6 | 98.5 ± 16.8 | −0.01 | 0.01 | n.s. | 1.00 | 0.98 | 1.02 |
| Neighborhood socioeconomic status | −0.6 ± 0.9 | −0.4 ± 1.0 | 0.06 | 0.06 | n.s. | 1.06 | 0.68 | 1.63 |
| Psychopathology factor scores (mean±SD) | ||||||||
| Psychosis | 1.4 ± 0.9 | 1.0 ± 0.8 | 0.59 | 5.01 | 0.03 | 1.80 | 1.10 | 3.01 |
| Anxious‐Misery | 1.1 ± 0.9 | 0.7 ± 0.9 | 0.44 | 2.37 | n.s. | 1.55 | 0.89 | 2.71 |
| Fear | 0.9 ± 1.0 | 0.6 ± 1.0 | −0.12 | 0.25 | n.s. | 0.89 | 0.56 | 1.41 |
| Externalizing | 0.8 ± 0.8 | 0.8 ± 0.8 | −0.26 | 1.28 | n.s. | 0.78 | 0.50 | 1.21 |
| Trauma exposure | 1.6 ± 1.5 | 1.2 ± 1.3 | 0.04 | 0.11 | n.s. | 1.04 | 0.82 | 1.32 |
| Morbid thoughts (%) | ||||||||
| Thoughts of death/dying | 38.1 | 29.8 | −0.26 | 0.51 | n.s. | 0.77 | 0.38 | 1.57 |
| Suicidal ideation | 24.6 | 15.7 | −0.15 | 0.13 | n.s. | 0.85 | 0.37 | 1.98 |
| Treatment (%) | ||||||||
| Talked with professional | 68.8 | 54.2 | 0.17 | 0.28 | n.s. | 1.18 | 0.63 | 2.21 |
| Psychiatric medications | 23.4 | 11.9 | 1.02 | 4.53 | 0.03 | 2.78 | 1.08 | 7.15 |
| Inpatient hospitalization | 7.8 | 1.7 | 0.24 | 0.06 | n.s. | 1.27 | 0.18 | 9.29 |
| Global Assessment Scale (mean±SD) | 69.3 ± 13.4 | 76.5 ± 11.4 | −0.04 | 6.63 | 0.01 | 0.96 | 0.94 | 0.99 |
WRAT‐4 – Wide Range Achievement Test, version 4
In the subgroup of participants (N=123) who completed the substance use self‐report at Time 1, lifetime ever use of substances reported at Time 1 was not predictive of persistence. Success of the model including demographic characteristics and ever use of twelve classes of substances was 59.3% (Persistent: 71.6%, Resilient: 44.6%; false positive: 34.3%, false negative: 13.6%). The fit of the model was reasonable (area under the curve = 0.66; 95% CI: 0.56‐0.75). No individual substances were significantly predictive.
Item analysis
Among youths, the positive sub‐psychosis items most frequently endorsed (“definitely agree”) at Time 1 on the PS‐R were odd/unusual thoughts, auditory perceptions, and reality confusion (Table 3). However, mean Time 1 scores on these items did not significantly differ between Persistent and Resilient groups (MANOVA), and receiver operator curve analyses revealed only modest ability for these items to discriminate between the groups (area under the curve values ranging from 0.54 to 0.57).
Table 3.
Item analysis of Time 1 PRIME Screen‐Revised in Persistent vs. Resilient youths
| PRIME Screen‐Revised item | Endorsing “Definitely agree” | Item mean±SD | Pairwise F following significant MANOVA | ROC | ||||||
|---|---|---|---|---|---|---|---|---|---|---|
| Persistent | Resilient | Persistent | Resilient | F | P | Cohen's d | AUC | 95% CI lower | 95% CI upper | |
| I may have felt that there could possibly be something controlling my thoughts, feelings, or actions (Thought control) | 8.9 | 1.7 | 2.05 ± 2.16 | 1.05 ± 1.70 | 15.80 | 0.001 | 0.51 | 0.63 | 0.56 | 0.70 |
| I think that I might feel like my mind is “playing tricks” on me (Mind tricks) | 16.9 | 7.7 | 2.58 ± 2.34 | 1.82 ± 2.18 | 6.77 | 0.010 | 0.34 | 0.59 | 0.52 | 0.66 |
| I wonder if people may be planning to hurt me or even may be about to hurt me (Persecutory/suspicious) | 8.1 | 2.6 | 1.73 ± 2.14 | 1.17 ± 1.80 | 4.71 | 0.031 | 0.28 | 0.57 | 0.50 | 0.65 |
| I think that I have felt that there are odd or unusual things going on that I can't explain (Odd/unusual thoughts) | 18.5 | 13.7 | 3.33 ± 2.07 | 2.81 ± 2.16 | 3.63 | n.s. | 0.25 | 0.57 | 0.50 | 0.64 |
| I have thought that it might be possible that other people can read my mind, or that I can read other's minds (Mind reading) | 5.6 | 0.9 | 1.37 ± 2.05 | 0.80 ± 1.53 | 5.90 | 0.016 | 0.31 | 0.56 | 0.49 | 0.63 |
| I have had the experience of doing something differently because of my superstitions (Superstitions) | 9.7 | 10.3 | 2.25 ± 2.20 | 1.76 ± 2.14 | 3.06 | n.s. | 0.23 | 0.56 | 0.49 | 0.63 |
| I have had the experience of hearing faint or clear sounds of people or a person mumbling or talking when there is no one near me (Auditory perceptions) | 18.5 | 16.2 | 2.48 ± 2.43 | 1.94 ± 2.45 | 2.90 | n.s. | 0.22 | 0.56 | 0.49 | 0.64 |
| I believe that I have special natural or supernatural gifts beyond my talents and natural strengths (Grandiosity) | 9.7 | 9.4 | 1.93 ± 2.24 | 1.48 ± 2.14 | 2.52 | n.s. | 0.21 | 0.56 | 0.48 | 0.63 |
| I think that I might be able to predict the future (Predict future) | 7.3 | 3.4 | 1.73 ± 2.16 | 1.25 ± 1.78 | 3.62 | n.s. | 0.24 | 0.55 | 0.48 | 0.62 |
| I think that I may get confused at times whether something I experience or perceive may be real or may be just part of my imagination or dreams (Reality confusion) | 18.5 | 14.5 | 3.37 ± 2.09 | 3.03 ± 2.20 | 1.49 | n.s. | 0.16 | 0.54 | 0.47 | 0.62 |
| I think that I may hear my own thoughts being said out loud (Audible thoughts) | 12.9 | 9.4 | 2.15 ± 2.36 | 1.83 ± 2.18 | 1.16 | n.s. | 0.14 | 0.54 | 0.46 | 0.61 |
ROC – receiver operating characteristic analysis of PRIME Screen‐Revised items; AUC – area under the curve, indicating the ability of the item to discriminate between the Persistent and Resilient groups
Though less frequently endorsed (“definitely agree”), items assessing thought control, mind tricks and persecutory/suspicious thinking had higher mean Time 1 endorsement by the Persistent group (Cohen's d range: 0.28‐0.51), and modest to moderate discriminability (area under the curve range: 0.57 to 0.63).
The least frequently endorsed item by the Persistent group was mind reading, which nonetheless had a higher mean endorsement by the Persistent than the Resilient group (Cohen's d = 0.31). The remaining PS‐R items (superstitions, grandiosity, predict future, and audible thoughts), though showing marginally higher mean scores in the Persistent than Resilient group (Cohen's d range: 0.14 to 0.24), discriminated the groups only modestly (area under the curve range: 0.54 to 0.56).
DISCUSSION
In a 2‐year follow‐up of US youths from the community, psychosis spectrum symptoms persisted or worsened in approximately 51% of youths endorsing symptoms at baseline. When correcting for demographic characteristics and baseline psychopathology, persistence or worsening of psychosis spectrum symptoms was predicted by several baseline clinical features, including higher severity of subclinical psychosis, lower global functioning, and prior psychiatric medication.
Those with persistent or worsening symptoms demonstrated higher overall psychosis symptom severity at baseline than those whose symptoms did not meet threshold levels at follow‐up, lending further support to the reported relationship between severity and persistence of psychotic‐like experiences in the population1, 11. In our study, baseline severity was greater in those with persisting symptoms across summary psychosis spectrum indicators, including overall psychosis, and positive and negative sub‐threshold symptom domains. In addition, several items most frequently endorsed as “definitely agree” by youths with psychotic spectrum symptoms at baseline were still the most commonly endorsed at follow‐up, including the subjective experience of odd/unusual thoughts, auditory perceptions, and reality confusion. However, they were not discriminative or predictive of persistence. Rather, the Persistent group was discriminated from the Resilient group by persecutory thinking/suspiciousness, ideation related to thought control, and the experience of mind tricks.
These findings are particularly notable, given reports that suspiciousness/paranoia and unusual thought content are associated with increased risk of psychosis conversion among clinically high risk youth20, 52, and that persecution and bizarre experiences (including thought control) in community youths are more likely to be associated with distress/disability than paranormal beliefs/magical thinking10. The current findings not only support the clinical and functional significance of these particular symptoms, but they also reinforce the potential benefits of early screening, particularly for these most discriminating experiences.
Global functioning was lower in the Persistent group at both Time 1 and Time 2, and it was predictive of symptom persistence, a finding that accords with numerous lines of evidence associating poor functioning with psychosis risk symptoms in both community1, 16, 53, 54 and clinical high risk55 cohorts. Of course, traditional global ratings, including those used here, are not independent of symptom severity. The use of separate social and role function scales56 in future follow‐ups will allow better differentiation of social/role functioning impairments and symptom severity for predictive purposes.
Increasing impairment over time relates to symptom persistence1, 16. However, we were unable to evaluate longitudinal functional changes in the current investigation, because we used different scales to assess global functioning at Time 1 and Time 2 (Children's Global Assessment Scale from the K‐SADS, and SIPS Global Assessment of Functioning, respectively). Nonetheless, the results provide convergent support that youths with both psychosis spectrum symptoms and lower global functioning are particularly vulnerable to symptom persistence or worsening.
Prior treatment with psychiatric medications predicted persistence, consistent with overall higher level of treatment seeking at both Time 1 and Time 2. Our findings align with others suggesting that aspects of help‐seeking behavior are common but not ubiquitous in youths with persisting psychotic‐like experiences13 and in some cases may precede the onset of psychotic disorders7. To more fully evaluate this finding, we are currently analyzing specific treatment history data, which will delineate the types of treatment that youths are seeking and receiving. Prior psychiatric medication suggests that a subset of youths with persisting symptoms are coming to the attention of health care providers, but it is unknown whether the psychosis spectrum symptoms are detected and adequately treated and/or monitored, especially since the context is likely to include comorbid psychopathology. For those at most imminent risk of psychosis or who have already entered a first episode, the importance of initiating specialized care aiming to reduce the duration of untreated psychosis is well documented57.
Several other characteristics distinguished youths whose symptoms persisted, including a first‐degree family history of psychosis, consistent with evidence from clinical high risk20 and college student18 studies, and more generally with the well‐documented genetic risk for psychosis58. Although baseline anxious‐misery, fear and externalizing domains were not uniquely predictive of persistence, the latter was associated with later mood disorders, ADHD and alcohol abuse. These findings are consistent with a prior community study of youths with psychotic‐like experiences that evidenced a higher risk of internalizing and externalizing problems at 2‐year follow‐up15. They also provide further support for the suggestion that persisting psychotic‐like experiences may be increasingly predictive of multiple domains of diagnosable psychopathology as young people age59.
Although ethnic minority status was more common in the Persistent, Resilient and Emergent groups than in the Typically Developing, it was not a significant predictor of symptom persistence when correcting for other demographic and clinical features, including psychosis spectrum severity and global functioning. This finding appears inconsistent with other lines of evidence from non‐US cohorts suggesting that ethnic minority status is a significant predictor of symptom persistence13. The experiences of ethnic minority groups in the US may differ in salient ways from those in other countries60, yet some effects of being an ethnic minority could be similar. Ongoing follow‐up of the Philadelphia Neurodevelopmental Cohort sample will allow us to further investigate the stability of our current finding, as well as additional risk and protective factors that may differentially impact ethnic groups.
We used the term “resilient” to refer to individuals with a risk factor, here defined by baseline endorsement of psychosis spectrum symptoms, who are not currently experiencing symptoms meeting severity criteria based on clinical interview. However, results suggest that individuals in this group are not asymptomatic, as reflected by comparatively elevated Time 2 scores on both SOPS and SPQ, lower global functioning, and higher levels of help‐seeking behavior compared to typically developing youths. This finding supports the suggestion that “false positive” status does not necessarily imply an absence of risk11: “resilient” individuals may be in a transient state of low symptom level, still vulnerable to symptom exacerbation. Some of the “resilient” individuals may instead experience relatively stable schizotypal traits that will not evolve into psychosis; the likelihood of this is yet unknown, as very few studies have simultaneously investigated “schizotypal” and “prodromal” symptoms61, 62.
Sensitivity of assessment methods could also play a role. It has long been suggested that diagnostic interviews by trained assessors may reduce false positives by allowing follow‐up probing to determine the clinical significance and context of endorsed symptoms7. Conversely, with some notable exceptions7, self‐report measures are often more feasible in large‐scale studies than time and resource intensive semi‐structured clinical interviews. Self‐reported psychotic experiences that are not judged significant upon clinical interview may be the “softest expression” of the psychosis spectrum extended phenotype11, perhaps identifying those at an earlier point in progression to the disorder. Cross‐sectional multi‐modal assessment at Time 2 conducted here suggests that some self‐report measures may be sensitive to aspects of symptoms that were either not disclosed or observed by the interviewer or, conversely, not severe enough to warrant significant clinical ratings upon interview.
These considerations notwithstanding, our current findings can be viewed as supporting the convergent validity of “prodromal” and “schizotypal” scales as measures of the overarching psychosis vulnerability construct61. For many individuals, the distinction between “schizotypy” and “psychotic‐like experiences” may be a function of symptom duration, stability and/or intensity. Ultimately, the potential of differing trajectories highlights the value of indexing risk using multiple methods61 to assess a multi‐dimensional continuum11 from a developmental perspective62. The inclusion of both self‐report and interview‐based assessments in ongoing follow‐up studies will allow us to determine the ultimate clinical significance of “false positives”.
Psychosis spectrum symptoms “emerged” in a small group of youths previously classified as typically developing. The number (N=42) was too small to allow formal analyses of predictors. The “emergent” category could reflect individuals for whom symptoms developed between Time 1 and Time 2. An alternative interpretation, that symptoms were experienced at Time 1 but at lower levels than were considered threshold at that time point, appears to be supported by close examination of Time 1 data. Compared to typically developing youths, those with subsequently emergent symptoms exhibited slightly elevated baseline PS‐R scores, increased family history of psychosis, lower global functioning, and trends towards increased help‐seeking behaviors that resolved to significance at Time 2. This result accords with previous findings that approximately 40% of adolescents with emergent symptoms had endorsed subclinical symptoms up to 8 years earlier1. It also further underscores the developmental aspect of the psychosis dimension, and the importance of the relationship between clinical and subclinical symptoms1.
Some additional considerations and limitations should inform interpretation of the findings presented here. First, as for any longitudinal study, there is a potential selection bias among those who returned for follow‐up versus those who did not. Although we cannot exclude the possibility that follow‐up results would differ between those who were enrolled compared to those who were unreachable or refused, our recruitment analyses indicate that at least baseline psychosis levels did not differ between those who were recruited and those who were not.
Second, an obvious limitation is that our cohort is still young and developing, on average just entering or still passing through the period of risk for psychotic disorders13. Establishing predictors of trajectories of psychosis spectrum symptoms requires multiple measurements over a wider age span. A recently completed 4‐year follow‐up of a subset of Philadelphia Neurodevelopmental Cohort youths will allow fuller understanding of predictors as young people age.
Third, to allow simultaneous consideration of many potential predictors implicated in prior studies, we included broad indicators of comorbid psychopathology, environment, substance use, and exposure to traumatic stressors, an approach that could obscure more nuanced relationships. We are currently evaluating relationships with more specific potential predictors in each of these categories to further inform our predictive models. Nevertheless, though not uniquely predictive, it is noteworthy that, without exception, each one of these variables was associated with psychosis spectrum status at baseline or follow‐up.
Finally, the classification categories of persistence/resilience/emergence we employed are rationally derived for the convenience of communication of salient constructs. However, we are aware that they cannot fully capture the complexity of clinical states. We employed cut‐offs at both time points based on generally accepted “clinical significance” of items, but certainly alternative cut points, and other methods to derive them, are important to investigate13. Any such categories can be significantly impacted by the assessment approach.
There is no single accepted psychosis spectrum screening tool63, and it is possible, if not likely, that measurement differences contribute to variation among study findings64. Here we used a hybrid approach in which we screened a very large sample at Time 1 via self‐report and highly structured interview, and conducted a smaller follow‐up via semi‐structured clinical interview, complemented by a self‐report. This design allowed us to conduct comprehensive Time 2 assessments comparable to those employed with clinical high‐risk samples. However, classification outcomes could in part reflect varying sensitivity of assessment methods at different time points rather than true severity of psychosis spectrum symptoms.
The sensitivity and specificity of our screening approach for subsequent longitudinal clinical interview status is not directly comparable to most studies, which typically have used a single screening instrument to assess positive sub‐threshold symptoms, followed immediately or within a 6‐month window by diagnostic interview in clinical groups6. Even under such circumstances, no one screening approach has consistently yielded both sensitivity and specificity above 0.706. Our two‐year predictive sensitivity (0.75) was consistent with prior studies including an investigation also using the PS‐R and 6‐month follow‐up by SIPS clinical high risk/psychosis in a young clinical sample65. Moreover, our negative predictive value, reflecting a relatively low number of “emergent” individuals, suggests that the majority of those who screen negative do not develop psychosis spectrum symptoms within 2 years. Thus, though not without limitations, our findings lend further support to the validity of screening approaches to enrich community samples with at‐risk individuals. Imperfect as they may be, both cut‐offs and a continuum can be useful in understanding clinical and neurobehavioral predictors66 that may distinguish patterns of persistence versus resilience.
Our findings of varying courses of psychosis spectrum symptoms in US youth confirm those of earlier studies, and highlight that psychosis risk is a dynamic process in young people8, 13. Among demographic and clinical characteristics assessed here, symptom persistence at 2‐year follow‐up was predicted by higher severity of subclinical psychosis, lower global functioning and prior psychiatric medication at baseline. In addition, psychosis spectrum features emerged in a small group of young people who previously had not reported significant symptoms but who nonetheless, on average, had exhibited early non‐specific clinical warning signs. The results underscore the existence of a wide developmental window of opportunity to investigate risk and protective factors – neurobehavioral, genetic and environmental – associated with varying clinical outcomes. Although our prediction accuracy was better than chance using only demographic and clinical characteristics, it may be improved by select biobehavioral measures.
Given the young age of participants, continued follow‐up will assist in evaluating the validity of the screening approach for predicting conversion to psychosis, as will incorporation of other potential predictors assessed in this cohort, including neurocognition, brain structure and function, and genomics, that may serve as early differentiators of symptom persistence and worsening. Moreover, investigations of points along the psychosis continuum are not only important as they relate to risk for clinical disorder, but also as an area of study that can inform our understanding of the neurobiology of psychosis67.
The Philadelphia Neurodevelopmental Cohort public domain resource can accelerate collaborative research and advance our understanding of the complex inter‐relationships among genes, cognition, brain and behavior involved in the development of common mental disorders.
ACKNOWLEDGEMENTS
The authors thank the participants in this study, and all the members of the recruitment, assessment and data teams whose efforts made this work possible. This study was supported by the National Institute of Mental Health (grants nos. MH089983 and MH089924, K08MH079364, R01MH101111) and the Dowshen Program for Neuroscience.
REFERENCES
- 1. Dominguez MD, Wichers M, Lieb R et al. Evidence that onset of clinical psychosis is an outcome of progressively more persistent subclinical psychotic experiences: an 8‐year cohort study. Schizophr Bull 2011;37:84‐93. [DOI] [PMC free article] [PubMed] [Google Scholar]
- 2. Kelleher I, Connor D, Clarke MC et al. Prevalence of psychotic symptoms in childhood and adolescence: a systematic review and meta‐analysis of population‐based studies. Psychol Med 2012;42:1857‐63. [DOI] [PubMed] [Google Scholar]
- 3. Linscott RJ, van Os J. An updated and conservative systematic review and meta‐analysis of epidemiological evidence on psychotic experiences in children and adults: on the pathway from proneness to persistence to dimensional expression across mental disorders. Psychol Med 2013;43:1133‐49. [DOI] [PubMed] [Google Scholar]
- 4. van Os J, Reininghaus U. Psychosis as a transdiagnostic and extended phenotype in the general population. World Psychiatry 2016;15:118‐24. [DOI] [PMC free article] [PubMed] [Google Scholar]
- 5. Debbane M, Badoud D, Balanzin D et al. Broadly defined risk mental states during adolescence: disorganization mediates positive schizotypal expression. Schizophr Res 2013;147:153‐6. [DOI] [PubMed] [Google Scholar]
- 6. Kline E, Schiffman J. Psychosis risk screening: a systematic review. Schizophr Res 2014;158:11‐8. [DOI] [PubMed] [Google Scholar]
- 7. Zammit S, Kounali D, Cannon M et al. Psychotic experiences and psychotic disorders at age 18 in relation to psychotic experiences at age 12 in a longitudinal population‐based cohort study. Am J Psychiatry 2013;170:742‐50. [DOI] [PubMed] [Google Scholar]
- 8. Yung AR, Lin A. Psychotic experiences and their significance. World Psychiatry 2016;15:130‐1. [DOI] [PMC free article] [PubMed] [Google Scholar]
- 9. Schultze‐Lutter F, Ruhrmann S, Berning J. Basic symptoms and ultrahigh risk criteria: symptom development in the initial prodromal state. Schizophr Bull 2010;36:182‐91. [DOI] [PMC free article] [PubMed] [Google Scholar]
- 10. Yung AR, Nelson B, Baker K et al. Psychotic‐like experiences in a community sample of adolescents: implications for the continuum model of psychosis and prediction of schizophrenia. Aust N Z J Psychiatry 2009;43:118‐28. [DOI] [PubMed] [Google Scholar]
- 11. Kaymaz N, Drukker M, Lieb R et al. Do subthreshold psychotic experiences predict clinical outcomes in unselected non‐help‐seeking population‐based samples? A systematic review and meta‐analysis, enriched with new results. Psychol Med 2012;42:2239‐53. [DOI] [PubMed] [Google Scholar]
- 12. Rössler W, Riecher‐Rössler A, Angst J et al. Psychotic experiences in the general population: a twenty‐year prospective community study. Schizophr Res 2007;92:1‐14. [DOI] [PubMed] [Google Scholar]
- 13. Wigman JT, van Winkel R, Raaijmakers QA et al. Evidence for a persistent, environment‐dependent and deteriorating subtype of subclinical psychotic experiences: a 6‐year longitudinal general population study. Psychol Med 2011;41:2317‐29. [DOI] [PubMed] [Google Scholar]
- 14. De Loore E, Gunther N, Drukker M et al. Persistence and outcome of auditory hallucinations in adolescence: a longitudinal general population study of 1800 individuals. Schizophr Res 2011;127:252‐6. [DOI] [PubMed] [Google Scholar]
- 15. Downs JM, Cullen AE, Barragan M et al. Persisting psychotic‐like experiences are associated with both externalising and internalising psychopathology in a longitudinal general population child cohort. Schizophr Res 2013;144:99‐104. [DOI] [PubMed] [Google Scholar]
- 16. van Os J, Linscott RJ, Myin‐Germeys I et al. A systematic review and meta‐analysis of the psychosis continuum: evidence for a psychosis proneness‐persistence‐impairment model of psychotic disorder. Psychol Med 2009;39:179‐95. [DOI] [PubMed] [Google Scholar]
- 17. Dominguez MD, Saka MC, Lieb R et al. Early expression of negative/disorganized symptoms predicting psychotic experiences and subsequent clinical psychosis: a 10‐year study. Am J Psychiatry 2010;167:1075‐82. [DOI] [PubMed] [Google Scholar]
- 18. Chapman LJ, Chapman JP, Kwapil TR et al. Putatively psychosis‐prone subjects 10 years later. J Abnorm Psychol 1994;103:171‐83. [DOI] [PubMed] [Google Scholar]
- 19. Ericson M, Tuvblad C, Raine A et al. Heritability and longitudinal stability of schizotypal traits during adolescence. Behav Genet 2011;41:499‐511. [DOI] [PMC free article] [PubMed] [Google Scholar]
- 20. Cannon TD, Cadenhead K, Cornblatt B et al. Prediction of psychosis in youth at high clinical risk: a multisite longitudinal study in North America. Arch Gen Psychiatry 2008;65:28‐37. [DOI] [PMC free article] [PubMed] [Google Scholar]
- 21. Calkins ME, Moore TM, Merikangas KR et al. The psychosis spectrum in a young U.S. community sample: findings from the Philadelphia Neurodevelopmental Cohort. World Psychiatry 2014;13:296‐305. [DOI] [PMC free article] [PubMed] [Google Scholar]
- 22. Paksarian D, Merikangas KR, Calkins ME et al. Racial‐ethnic disparities in empirically‐derived subtypes of subclinical psychosis among a U.S. sample of youths. Schizophr Res 2016;170:205‐10. [DOI] [PMC free article] [PubMed] [Google Scholar]
- 23. Gur RC, Calkins ME, Satterthwaite TD et al. Neurocognitive growth charting in psychosis spectrum youths. JAMA Psychiatry 2014;71:366‐74. [DOI] [PubMed] [Google Scholar]
- 24. Satterthwaite TD, Wolf DH, Calkins ME et al. Structural brain abnormalities in youth with psychosis spectrum symptoms. JAMA Psychiatry 2016;73:515‐24. [DOI] [PMC free article] [PubMed] [Google Scholar]
- 25. Roalf DR, Quarmley M, Calkins ME et al. Temporal lobe volume decrements in psychosis spectrum youths. Schizophr Bull (in press). [DOI] [PMC free article] [PubMed] [Google Scholar]
- 26. Wolf DH, Satterthwaite TD, Calkins ME et al. Functional neuroimaging abnormalities in youth with psychosis spectrum symptoms. JAMA Psychiatry 2015;72:456‐65. [DOI] [PMC free article] [PubMed] [Google Scholar]
- 27. Satterthwaite TD, Vandekar SN, Wolf DH et al. Connectome‐wide network analysis of youth with Psychosis‐Spectrum symptoms. Mol Psychiatry 2015;20:1508‐15. [DOI] [PMC free article] [PubMed] [Google Scholar]
- 28. Shanmugan S, Wolf DH, Calkins ME et al. Common and dissociable mechanisms of executive system dysfunction across psychiatric disorders in youth. Am J Psychiatry 2016;173:517‐26. [DOI] [PMC free article] [PubMed] [Google Scholar]
- 29. Calkins ME, Merikangas KR, Moore TM et al. The Philadelphia Neurodevelopmental Cohort: constructing a deep phenotyping collaborative. J Child Psychol Psychiatry 2015;56:1356‐69. [DOI] [PMC free article] [PubMed] [Google Scholar]
- 30. Merikangas KR, Calkins ME, Burstein M et al. Comorbidity of physical and mental disorders in the neurodevelopmental genomics cohort study. Pediatrics 2015;135:e927‐38. [DOI] [PMC free article] [PubMed] [Google Scholar]
- 31. Satterthwaite TD, Elliott MA, Ruparel K et al. Neuroimaging of the Philadelphia Neurodevelopmental Cohort. Neuroimage 2014;86:544‐53. [DOI] [PMC free article] [PubMed] [Google Scholar]
- 32. Miller TJ, Cicchetti D, Markovich PJ et al. The SIPS screen: a brief self‐report screen to detect the schizophrenia prodrome. Schizophr Res 2004;70(Suppl. 1):78. [Google Scholar]
- 33. Kobayashi H, Nemoto T, Koshikawa H et al. A self‐reported instrument for prodromal symptoms of psychosis: testing the clinical validity of the PRIME Screen‐Revised (PS‐R) in a Japanese population. Schizophr Res 2008;106:356‐62. [DOI] [PubMed] [Google Scholar]
- 34. Kaufman J, Birmaher B, Brent D et al. Schedule for Affective Disorders and Schizophrenia for School‐Age Children – Present and Lifetime version (K‐SADS‐PL): Initial reliability and validity. J Am Acad Child Adolesc Psychiatry 1997;36:980‐8. [DOI] [PubMed] [Google Scholar]
- 35. McGlashan TH, Miller TJ, Woods SW et al. Structured Interview for Prodromal Syndromes, Version 4.0. New Haven: Prime Clinic Yale School of Medicine, 2003. [Google Scholar]
- 36. DeMars CE. A tutorial on interpreting bifactor model scores. Int J Testing 2013;13:354‐78. [Google Scholar]
- 37. Bonifay W, Lane SP, Reise SP. Three concerns with applying a bifactor model as a structure of psychopathology. Clin Psychol Sci (in press). [Google Scholar]
- 38. Kim JO, Mueller CW. Factor analysis: statistical methods and practical issues. Newbury Park: Sage, 1978. [Google Scholar]
- 39. Krueger RF. The structure of common mental disorders. Arch Gen Psychiatry 1999;56:921‐6. [DOI] [PubMed] [Google Scholar]
- 40. Revelle W. psych: procedures for personality and psychological research. R package version 1.5.8. Evanston: Northwestern University, 2015. [Google Scholar]
- 41. Muthén LK, Muthén BO. Mplus user's guide, 7th ed Los Angeles: Muthén & Muthén, 2015. [Google Scholar]
- 42. Wilkinson GS, Robertson GJ. Wide Range Achievement Test, 4th ed Lutz: Psychological Assessment Resources, 2006. [Google Scholar]
- 43. Han C, McGue MK, Iacono WG. Lifetime tobacco, alcohol and other substance use in adolescent Minnesota twins: univariate and multivariate behavioral genetic analyses. Addiction 1999;94:981‐93. [DOI] [PubMed] [Google Scholar]
- 44. Scott JC, Wolf DH, Calkins ME et al. Cognitive functioning in adolescent and young adult cannabis users in the Philadelphia Neurodevelopmental Cohort. Submitted for publication. [DOI] [PMC free article] [PubMed]
- 45. Moore TM, Martin IK, Gur OM et al. Characterizing social environment's association with neurocognition using census and crime data linked to the Philadelphia Neurodevelopmental Cohort. Psychol Med 2016;46:599‐610. [DOI] [PMC free article] [PubMed] [Google Scholar]
- 46. First MB, Spitzer RL, Gibbon M et al. Structured Clinical Interview for DSM‐IV‐TR Axis I Disorders, Research Version, Patient Edition. New York: Biometrics Research, New York State Psychiatric Institute, 2002. [Google Scholar]
- 47. Folstein MF, Folstein SE, McHugh PR. “Mini‐mental state”. A practical method for grading the cognitive state of patients for the clinician. J Psychiatr Res 1975;12:189‐98. [DOI] [PubMed] [Google Scholar]
- 48. Maxwell ME. Manual for the FIGS. Bethesda: Clinical Neurogenetics Branch, Intramural Research Program, National Institute for Mental Health, 1996. [Google Scholar]
- 49. Raine A. The SPQ: a scale for the assessment of schizotypal personality based on DSM‐III‐R criteria. Schizophr Bull 1991;17:555‐64. [DOI] [PubMed] [Google Scholar]
- 50. Calkins ME, Curtis CE, Grove WM et al. Multiple dimensions of schizotypy in first degree biological relatives of schizophrenia patients. Schizophr Bull 2004;30:317‐25. [DOI] [PubMed] [Google Scholar]
- 51. Benjamini Y, Hochberg Y. Controlling the false discovery rate: a practical and powerful approach to multiple testing. J R Stat Soc Ser B 1995;57:289‐300. [Google Scholar]
- 52. Carrion RE, Cornblatt BA, Burton CZ et al. Personalized prediction of psychosis: external validation of the NAPLS‐2 psychosis risk calculator with the EDIPPP project. Am J Psychiatry 2016;173:989‐96. [DOI] [PMC free article] [PubMed] [Google Scholar]
- 53. Asher L, Zammit S, Sullivan S et al. The relationship between psychotic symptoms and social functioning in a non‐clinical population of 12 year olds. Schizophr Res 2013;150:404‐9. [DOI] [PubMed] [Google Scholar]
- 54. Yung AR, Buckby JA, Cotton SM et al. Psychotic‐like experiences in nonpsychotic help‐seekers: associations with distress, depression, and disability. Schizophr Bull 2006;32:352‐9. [DOI] [PMC free article] [PubMed] [Google Scholar]
- 55. Salokangas RK, Heinimaa M, From T et al. Short‐term functional outcome and premorbid adjustment in clinical high‐risk patients. Results of the EPOS project. Eur Psychiatry 2014;29:371‐80. [DOI] [PubMed] [Google Scholar]
- 56. Piskulic D, Addington J, Auther A et al. Using the global functioning social and role scales in a first‐episode sample. Early Interv Psychiatry 2011;5:219‐23. [DOI] [PubMed] [Google Scholar]
- 57. Cechnicki A, Cichocki L, Kalisz A et al. Duration of untreated psychosis (DUP) and the course of schizophrenia in a 20‐year follow‐up study. Psychiatry Res 2014;219:420‐5. [DOI] [PubMed] [Google Scholar]
- 58. Gottesman II. Schizophrenia genesis: the origins of madness. New York: Freeman, 1991. [Google Scholar]
- 59. Kelleher I, Keeley H, Corcoran P et al. Clinicopathological significance of psychotic experiences in non‐psychotic young people: evidence from four population‐based studies. Br J Psychiatry 2012;201:26‐32. [DOI] [PubMed] [Google Scholar]
- 60. Williams DR, Earl TR. Race and mental health – more questions than answers. Int J Epidemiol 2007;36:758‐60. [DOI] [PubMed] [Google Scholar]
- 61. Cicero DC, Martin EA, Becker TM et al. Correspondence between psychometric and clinical high risk for psychosis in an undergraduate population. Psychol Assess 2014;26:901‐15. [DOI] [PMC free article] [PubMed] [Google Scholar]
- 62. Debbane M, Eliez S, Badoud D et al. Developing psychosis and its risk states through the lens of schizotypy. Schizophr Bull 2015;41(Suppl. 2):S396‐407. [DOI] [PMC free article] [PubMed] [Google Scholar]
- 63. Daneault JG, Stip E, Refer OSG. Genealogy of instruments for prodrome evaluation of psychosis. Front Psychiatry 2013;4:25. [DOI] [PMC free article] [PubMed] [Google Scholar]
- 64. Kline E, Wilson C, Ereshefsky S et al. Psychosis risk screening in youth: a validation study of three self‐report measures of attenuated psychosis symptoms. Schizophr Res 2012;141:72‐7. [DOI] [PubMed] [Google Scholar]
- 65. Kline E, Thompson E, Demro C et al. Longitudinal validation of psychosis risk screening tools. Schizophr Res 2015;165:116‐22. [DOI] [PubMed] [Google Scholar]
- 66. David AS. Why we need more debate on whether psychotic symptoms lie on a continuum with normality. Psychol Med 2010;40:1935‐42. [DOI] [PubMed] [Google Scholar]
- 67. Hanssen M, Bak M, Bijl R et al. The incidence and outcome of subclinical psychotic experiences in the general population. Br J Clin Psychol 2005;44(Pt. 2):181‐91. [DOI] [PubMed] [Google Scholar]