

Abstract
Objective
To describe the distribution of Veterans in areas of the United States where there are potentially inadequate supplies of health professionals, and to explore opportunities suggested by this distribution for fostering health workforce flexibility.
Data Sources
County‐level data from the 2015–2016 Health Resources and Services Administration's (HRSA's) Area Health Resources Files (AHRF) were used to estimate Veteran populations in HRSA‐designated health professional shortage areas (HPSAs). This information was then linked to 2015 VA health facility information from the Department of Veterans Affairs.
Study Design
Potential Veteran populations living in Shortage Area Counties with no VHA facilities were estimated, and the composition of these populations was explored by Census division and state.
Principal Findings
Nationwide, approximately 24 percent of all Veterans and 23 percent of Veterans enrolled in VHA health care live in Shortage Area Counties. These estimates mask considerable variation across states.
Conclusions
An examination of Veterans residing in Shortage Area Counties suggests extensive maldistribution of health services across the United States and the continued need to find ways to improve health care access for all Veterans. Effective avenues for doing so may include increasing health workforce flexibility through expansion of nurse practitioner scopes of practice.
Keywords: Veterans, access, rural health care, community‐based care, geographic analysis
The Department of Veterans Affairs/Veterans Health Administration (VA/VHA) provides health care to 6 million Veterans nationwide, including approximately 800,000 Veterans who served in Operation Enduring Freedom, Operation Iraqi Freedom, and Operation New Dawn (Panangala 2015; Department of Veterans Affairs 2016). An additional 3 million Veterans are enrolled in the VHA health care system, but they are not currently receiving their health care through VHA (Department of Veterans Affairs 2016). The total 9 million veterans currently enrolled in VHA health care is likely an underestimate of the number of veterans who could potentially qualify for VHA health care. The Congressional Budget Office (CBO) has suggested that approximately 60 percent of unenrolled Veterans—about 8 million additional Veterans—may be eligible for their health care through VHA (Congressional Budget Office 2014).
In recent years, the demand for VHA health care has grown, and this trend, coupled with other complex dynamics, has contributed to long appointment wait times and related health care access challenges for some Veterans (Bagalman 2014; Centers for Medicare and Medicaid Services 2015; Department of Veterans Affairs 2016). For instance, an Institute of Medicine (IOM) analysis of VHA data showed that, in 2014, the average wait time for new primary care appointments was 43 days, with a range of 2 to 122 days across all VHA facilities (Institute of Medicine 2015). The timeliness of obtaining both physical and behavioral health care is essential. Studies have shown that delays and extended wait times are associated with adverse health outcomes for a range of health conditions, from spinal fractures to heart disease (Institute of Medicine 2015). Timely access to behavioral health care is particularly important, and a number of analyses have indicated that treatment may be more effective and patients respond better if behavioral health care is delivered in a timely and well‐coordinated manner (Institute of Medicine 2015).
In response to health care access issues, Congress passed the Veterans Access, Choice and Accountability Act of 2014 to increase health care access for eligible Veterans (Veterans Access, Choice and Accountability Act 2014). Under this legislation, VA instituted a temporary program authorizing health care‐eligible1 Veterans who meet certain criteria to obtain care outside of the VHA health care system (Department of Veterans Affairs 2015a; Panangala 2015; Commission on Care 2016). However, despite efforts to address health care access issues through the VCA program, utilization has been low, with only 27,000 Veterans having utilized Veterans Choice Program (VCP) providers as of November 2014 (Hegseth 2015). A recent report by the Government Accountability Office (GAO) study found that shortages of primary care providers in the community were one reason for low VCP utilization cited by officials from medical centers and the VHA (Government Accountability Office 2016).
In addition to creating the VCP, the Veterans Choice Act also required an independent assessment of VHA's health care delivery systems and established the Commission on Care to review the assessment findings. Based upon extensive analysis of the 4,000‐page Independent Assessment Report as well as stakeholder engagement, site visits, and public meetings, the Commission developed 18 recommendations to address seven broad areas: the VHA Care System; Clinical Operations; Health Care Equity; Facility and Capital Assets; Information Technology; Governance, Leadership, and Workforce; and Veteran Eligibility (Commission on Care 2016).
Two recommendations focused on community health care needs are the impetus for this analysis. First, the Commission on Care Report suggested conducting community assessments of Veterans’ needs, local VHA capacity, and non‐VA community providers to assist in capital asset and resource planning. This assessment would assist the VA in identifying areas where VHA will provide services and where it would be efficient to purchase services. Second, the Commission recommended establishing integrated, community care networks of VHA credentialed providers to help address the health care, “misalignment of capacity and demand that threatens to become worse over time” (Commission on Care 2016, p. 3).
While both recommendations focus on local area needs, the Commission's Report does not identify specific geographic areas where there is a potentially critical need for health care providers for Veterans. Given ongoing budget constraints, identifying areas with the highest health workforce needs is important for prioritizing the resource planning suggested by the Commission and for ensuring adequate characterization of local health workforce capacities.
The purpose of the current study is to identify geographic areas where health care provider supply potentially does not meet the health care needs of Veterans. This work is intended to serve as an initial step in characterizing health care capacity for Veterans across the United States. More specifically, this study links geographic information on VHA health facility locations with Health Resources and Services Administration (HRSA)–designated Health Professional Shortage Areas (HPSAs) to identify geographic areas where there are potentially inadequate supplies of health professionals to meet Veteran demands. HRSA‐designated HPSAs reflect geographic areas and populations with potentially insufficient provider capacity. Currently, there are approximately 6,100 primary care HPSAs and 4,000 mental health HPSAs (Health Resources and Services Administration 2016b).
Instead of only reporting acute shortages of health care providers nationally, this analysis seeks to identify specific areas where there are high concentrations of VHA‐enrolled Veterans and high health care need. In addition, this study examines two Veteran population subgroups with specific health care needs: women Veterans and Veterans aged 65 years and older. Careful planning related to these populations is becoming increasingly important as Veterans’ need for health care intensifies as a consequence of population aging and the commensurate increase in complex health conditions requiring care (Horgan, Taylor, and Wilensky 1983; Selim et al. 2004; Sorrell and Durham 2011).
As the Commission on Care Report also suggested ensuring that Veterans with a service‐connected illness, injury, or disability have priority access to care (Commission on Care, 2016, Recommendation 18), this study also considers Veterans in health workforce shortage areas who are receiving service‐connected compensation benefits from the VA. Finally, as health care providers are in short supply in rural areas (Ricketts 2005; Hoge et al. 2013) and Veterans are more likely than non‐Veterans to live in rural areas (Department of Veterans Affairs 2015b), the rurality of areas where Veterans live is also examined.
Data
Data for this analysis come from two publicly available resources: HRSA's 2015–2016 Area Health Resource Files (AHRF; ahrf.hrsa.gov) and the VA via VA's Open Data portal (www.va.gov/data). A detailed description of each of the variables used for this analysis is provided below. Data linkages were conducted using the statistical software R (version 3.2.3) and SAS (version 9.4) (SAS Institute Inc., Cary, NC, USA).
Veteran Population Estimates
The AHRF was used to obtain fiscal year 2015 (FY 2015) county‐level estimates of the total number of Veterans, the number women Veterans, and the number of Veterans receiving service‐connected compensation in the 50 U.S. states and the District of Columbia. The AHRF contains a collection of county‐ and state‐level data from over 50 different sources on health care professionals, hospitals, health care facilities, and population demographics.
County‐level estimates of the FY 2015 population of Veterans aged 65 and older were obtained directly from VA. All Veteran population estimates are as of September 30, 2015, and derive from VetPop 2014, an actuarial projection model developed by VA's Office of the Actuary (http://www.va.gov/vetdata/Veteran_Population.asp). The VA's Office of the Actuary produces official Veteran population projections and estimates of the current Veteran population by demographic characteristic (e.g., age, sex), using VA administrative data and U.S. population mortality data from the U.S. Social Security Administration.
County‐level estimates of FY 2015 Veterans enrolled in VHA health care were obtained from VA's Open Data portal (www.va.gov/data). VHA‐enrolled Veterans include eligible Veterans whom VA has determined have a service‐connected illness or injury, eligible Veterans with gross household incomes below certain geographic limits, and eligible Veterans with gross household incomes above certain limits who agree to co‐pays.
VHA Facilities
Veterans Health Administration facility locations were retrieved from VA's Open Data portal (www.va.gov/data). This dataset includes information on facility type, facility name, and, for most facilities, latitude and longitude.
Rural Status
Counties were classified as rural using the 2013 Rural/Urban Continuum Codes from the U.S. Department of Agriculture's Economic Research Service (ERS) (United States Department of Agriculture 2013), which are included in the AHRF. The ERS classifies counties to one of nine codes on a continuum from metro areas of 1 million population or more (1) to completely rural or less than 2,500 urban population, not adjacent to a metro area (9). Counties were considered “rural” if they were completely rural regardless of whether they were adjacent to a metropolitan area (code 8 or 9).
Health Professional Shortage Areas
Data on mental health and primary care Health Professional Shortage Areas (HPSAs) came from the 2015–2016 AHRF. HPSA designations assist federal and state governments in prioritizing resources to areas where there are significant health care needs. HPSA designations consider travel time, population size, demand for and utilization of health services, number of providers, geographic characteristics, and population groups served (Health Resources and Services Administration 1993, 2015, 2016a,b). Primary care providers were considered if they were osteopathic or allopathic physicians from the following practice areas: General or Family Practice, General Internal Medicine, Pediatrics, and Obstetrics and Gynecology. HPSAs do not consider other types of practitioners who provide primary care services such as those from NPs and physicians assistants. Although the Federal Register defined psychiatrists, clinical psychologists, clinical social workers, psychiatric nurse specialists, and marriage and family therapists as mental health professionals to consider in HPSA designations, most mental health HPSAs were based on the distribution of psychiatrists alone (Health Resources and Services Administration 2015, 2016a). Under these definitions, portions of some counties are considered HPSAs, as are certain populations and facilities (e.g., a correctional facility). However, this study considers geographically defined whole‐county and partial‐county HPSAs (Health Resources and Services Administration 2016a,b).
Methods
This study defined a Shortage Area County as a county that (1) has no VHA health or medical facility; and (2) has been designated by HRSA as either a primary care or a mental health geographic HPSA (i.e., either a whole‐county HPSA or a partial‐county HPSA). Thus, the first step of this analysis involved assigning each VHA health facility to its appropriate county. VHA health facility assignments were made for VHA community‐based outpatient clinics (or CBOCs), VHA integrated clinical facilities, VHA outpatient clinics, VA medical centers, and Vet Centers. County assignment of VHA health care facilities was performed using a geocoding procedure available in Base SAS 9.4 (proc ginside). SAS was unable to assign 22 VHA facilities to an appropriate county, and county‐level determinations were performed manually for these facilities.
The county‐level VHA facility assignments were then linked to county‐level HPSA categories using Federal Information Processing Series county codes (FIPS codes) to identify Shortage Area Counties. To reiterate, a Shortage Area County is a county that (1) has no VHA health facility; and (2) has been designated either a primary care or a mental health geographic HPSA (i.e., either a whole‐county HPSA or a partial‐county HPSA).
County‐level Veteran population estimates and county‐level rural status codes were then linked to the Shortage Area County designations, again using FIPS codes. These summaries were tabulated by state to determine estimates of the total number of Veterans living in Shortage Area Counties in each state. Subpopulation estimates were also tabulated for Veterans enrolled in VHA health care, women Veterans, Veterans aged 65 years and older, and Veterans who receive service‐connected compensation from VA (i.e., service‐connected Veterans). The statistical software R (version 3.2.3) was used to generate these tabulations.
In addition to county‐ and state‐level analyses, this study examined the distribution of Veterans in Shortage Area Counties by U.S. Census division. Census divisions are subdivisions of the four U.S. Census Regions (Northeast, Midwest, South, and West). Each divisional grouping is made up of three to eight states, and thus, Census divisions can afford a more granular view than is possible at the U.S. Census Region level.
Results
Table 1 shows the distribution of Veterans overall, by subgroup, and in Shortage Area Counties. Of the 21,479,000 Veterans in the United States (i.e., Veterans in the 50 U.S. states and the District of Columbia), 8,843,000 Veterans, or 41 percent, are enrolled in VHA, 9 percent are women, and 46 percent are older than 65 years. About 20 percent of all Veterans—or 4,141,000 people—are receiving VA compensation for a service‐connected illness, injury or disability. Of the 21 million total Veterans and the approximately 9 million VHA enrollees in the 50 U.S. states and the District of Columbia, between 23 and 24 percent live in Shortage Area Counties. Similarly, about one‐quarter of Veterans older than 65 years live in Shortage Area Counties while about 22 percent of women Veterans live in these areas.
Table 1.
Veteran Populations, All Counties and Shortage Area Counties, by State, 2015, Population in Thousands
| Total Veteran Population Estimates, by State | Veteran Population Estimates in Shortage Area Counties | Proportion, by Group (Shortage Area Counties/Total) | |||||||||||||
|---|---|---|---|---|---|---|---|---|---|---|---|---|---|---|---|
| All | Enrolled | Women | Aged 65+ | Receiving S‐C Compensation | All | Enrolled | Women | Aged 65+ | Receiving S‐C Compensation | All | Enrolled | Women | Aged 65+ | Receiving S‐C Compensation | |
| United States | 21,479 | 8,843 | 2,020 | 9,833 | 4,141 | 5,125 | 2,060 | 442 | 2,333 | 980 | 0.24 | 0.23 | 0.22 | 0.24 | 0.24 |
| Northeast Region | |||||||||||||||
| New England Division | |||||||||||||||
| Connecticut | 207 | 76 | 17 | 111 | 27 | 22 | 7 | 2 | 11 | 3 | 0.10 | 0.09 | 0.10 | 0.10 | 0.10 |
| Maine | 125 | 57 | 10 | 60 | 26 | 22 | 10 | 2 | 11 | 4 | 0.17 | 0.17 | 0.18 | 0.19 | 0.16 |
| Massachusetts | 368 | 134 | 26 | 197 | 61 | 2 | 0 | 0 | 1 | 0 | a | a | 0.01 | a | a |
| New Hampshire | 111 | 44 | 9 | 53 | 19 | 10 | 5 | 1 | 5 | 2 | 0.09 | 0.11 | 0.09 | 0.10 | 0.09 |
| Rhode Island | 70 | 28 | 5 | 36 | 12 | 10 | 3 | 1 | 6 | 2 | 0.15 | 0.12 | 0.14 | 0.16 | 0.14 |
| Vermont | 48 | 21 | 3 | 23 | 7 | 16 | 7 | 1 | 7 | 3 | 0.34 | 0.33 | 0.37 | 0.31 | 0.34 |
| Middle Atlantic Division | |||||||||||||||
| New Jersey | 413 | 144 | 33 | 229 | 57 | 7 | 2 | 0 | 4 | 1 | 0.02 | 0.01 | 0.01 | 0.02 | 0.01 |
| New York | 863 | 389 | 66 | 445 | 127 | 68 | 28 | 5 | 32 | 10 | 0.08 | 0.07 | 0.07 | 0.07 | 0.08 |
| Pennsylvania | 917 | 352 | 71 | 473 | 118 | 75 | 29 | 6 | 37 | 10 | 0.08 | 0.08 | 0.08 | 0.08 | 0.08 |
| Midwest Region | |||||||||||||||
| East North Central Division | |||||||||||||||
| Illinois | 706 | 279 | 55 | 345 | 93 | 190 | 71 | 13 | 91 | 25 | 0.27 | 0.25 | 0.24 | 0.26 | 0.27 |
| Indiana | 469 | 186 | 36 | 207 | 83 | 169 | 66 | 12 | 78 | 30 | 0.36 | 0.36 | 0.33 | 0.38 | 0.36 |
| Michigan | 641 | 229 | 46 | 327 | 98 | 193 | 69 | 14 | 98 | 29 | 0.30 | 0.30 | 0.30 | 0.30 | 0.29 |
| Ohio | 848 | 339 | 68 | 404 | 124 | 158 | 61 | 10 | 75 | 22 | 0.19 | 0.18 | 0.15 | 0.19 | 0.18 |
| Wisconsin | 406 | 168 | 34 | 199 | 67 | 141 | 62 | 11 | 70 | 24 | 0.35 | 0.37 | 0.33 | 0.35 | 0.36 |
| West North Central Division | |||||||||||||||
| Iowa | 228 | 100 | 15 | 109 | 37 | 111 | 50 | 7 | 55 | 18 | 0.49 | 0.50 | 0.44 | 0.50 | 0.50 |
| Kansas | 218 | 87 | 18 | 96 | 38 | 67 | 26 | 4 | 33 | 10 | 0.31 | 0.30 | 0.24 | 0.34 | 0.26 |
| Minnesota | 361 | 162 | 26 | 180 | 89 | 165 | 80 | 11 | 80 | 45 | 0.46 | 0.49 | 0.44 | 0.44 | 0.50 |
| Missouri | 488 | 200 | 39 | 227 | 87 | 160 | 68 | 11 | 75 | 29 | 0.33 | 0.34 | 0.28 | 0.33 | 0.33 |
| Nebraska | 141 | 68 | 12 | 63 | 41 | 51 | 27 | 3 | 26 | 16 | 0.36 | 0.39 | 0.30 | 0.41 | 0.38 |
| North Dakota | 57 | 28 | 5 | 24 | 12 | 19 | 9 | 1 | 9 | 3 | 0.33 | 0.33 | 0.26 | 0.38 | 0.29 |
| South Dakota | 72 | 39 | 6 | 31 | 15 | 37 | 20 | 3 | 16 | 7 | 0.51 | 0.50 | 0.44 | 0.53 | 0.46 |
| South Region | |||||||||||||||
| South Atlantic Division | |||||||||||||||
| Delaware | 77 | 26 | 9 | 37 | 12 | — | — | — | — | — | — | — | — | — | — |
| Dist. of Columbia | 29 | 14 | 4 | 12 | 5 | — | — | — | — | — | — | — | — | — | — |
| Florida | 1,558 | 716 | 154 | 785 | 319 | 182 | 76 | 20 | 84 | 40 | 0.12 | 0.11 | 0.13 | 0.11 | 0.13 |
| Georgia | 752 | 299 | 92 | 287 | 171 | 306 | 116 | 31 | 127 | 63 | 0.41 | 0.39 | 0.34 | 0.44 | 0.37 |
| Maryland | 430 | 149 | 58 | 173 | 78 | 41 | 13 | 6 | 14 | 9 | 0.10 | 0.09 | 0.11 | 0.08 | 0.11 |
| North Carolina | 774 | 323 | 85 | 321 | 181 | 320 | 132 | 30 | 144 | 67 | 0.41 | 0.41 | 0.35 | 0.45 | 0.37 |
| South Carolina | 418 | 186 | 47 | 179 | 93 | 143 | 62 | 14 | 63 | 31 | 0.34 | 0.33 | 0.30 | 0.35 | 0.33 |
| Virginia | 783 | 262 | 109 | 270 | 178 | 349 | 117 | 47 | 124 | 77 | 0.45 | 0.45 | 0.43 | 0.46 | 0.43 |
| West Virginia | 166 | 81 | 10 | 80 | 31 | 72 | 34 | 4 | 36 | 14 | 0.43 | 0.43 | 0.42 | 0.45 | 0.43 |
| East South Central Division | |||||||||||||||
| Alabama | 412 | 171 | 43 | 170 | 91 | 190 | 76 | 18 | 80 | 41 | 0.46 | 0.44 | 0.42 | 0.47 | 0.45 |
| Kentucky | 328 | 144 | 25 | 144 | 63 | 134 | 59 | 8 | 60 | 25 | 0.41 | 0.41 | 0.33 | 0.42 | 0.40 |
| Mississippi | 219 | 100 | 20 | 88 | 40 | 150 | 64 | 13 | 62 | 25 | 0.69 | 0.64 | 0.62 | 0.71 | 0.62 |
| Tennessee | 504 | 210 | 46 | 218 | 105 | 205 | 81 | 15 | 97 | 37 | 0.41 | 0.39 | 0.33 | 0.44 | 0.36 |
| West South Central Division | |||||||||||||||
| Arkansas | 248 | 117 | 21 | 107 | 47 | 112 | 51 | 9 | 50 | 20 | 0.45 | 0.44 | 0.41 | 0.47 | 0.42 |
| Louisiana | 326 | 134 | 32 | 138 | 60 | 132 | 54 | 12 | 56 | 24 | 0.41 | 0.40 | 0.37 | 0.41 | 0.39 |
| Oklahoma | 336 | 138 | 30 | 146 | 89 | 177 | 72 | 15 | 80 | 44 | 0.53 | 0.52 | 0.49 | 0.55 | 0.50 |
| Texas | 1,675 | 711 | 180 | 672 | 390 | 375 | 143 | 34 | 172 | 71 | 0.22 | 0.20 | 0.19 | 0.26 | 0.18 |
| West Region | |||||||||||||||
| Mountain Division | |||||||||||||||
| Arizona | 528 | 226 | 55 | 263 | 98 | 6 | 2 | 0 | 3 | 1 | 0.01 | 0.01 | 0.01 | 0.01 | 0.01 |
| Colorado | 409 | 159 | 47 | 170 | 95 | 65 | 22 | 6 | 28 | 11 | 0.16 | 0.14 | 0.13 | 0.17 | 0.12 |
| Idaho | 132 | 58 | 10 | 60 | 24 | 33 | 14 | 2 | 17 | 5 | 0.25 | 0.23 | 0.18 | 0.29 | 0.21 |
| Montana | 99 | 50 | 9 | 47 | 20 | 26 | 14 | 2 | 13 | 5 | 0.26 | 0.27 | 0.25 | 0.28 | 0.23 |
| Nevada | 225 | 107 | 21 | 105 | 44 | 18 | 8 | 1 | 10 | 3 | 0.08 | 0.08 | 0.07 | 0.10 | 0.06 |
| New Mexico | 170 | 75 | 17 | 78 | 36 | 27 | 12 | 2 | 13 | 5 | 0.16 | 0.15 | 0.14 | 0.17 | 0.13 |
| Utah | 151 | 58 | 12 | 68 | 25 | 50 | 18 | 4 | 21 | 9 | 0.33 | 0.31 | 0.35 | 0.30 | 0.37 |
| Wyoming | 50 | 26 | 4 | 20 | 10 | 6 | 3 | 0 | 3 | 1 | 0.12 | 0.11 | 0.09 | 0.15 | 0.08 |
| West Region | |||||||||||||||
| Pacific Division | |||||||||||||||
| Alaska | 73 | 32 | 10 | 20 | 18 | 12 | 4 | 1 | 4 | 1 | 0.16 | 0.11 | 0.10 | 0.19 | 0.08 |
| California | 1,802 | 749 | 165 | 865 | 360 | 110 | 40 | 11 | 58 | 19 | 0.06 | 0.05 | 0.06 | 0.07 | 0.05 |
| Hawaii | 120 | 45 | 13 | 48 | 27 | <1 | <1 | <1 | <1 | <1 | a | a | a | a | a |
| Oregon | 326 | 140 | 28 | 165 | 65 | 76 | 34 | 6 | 39 | 16 | 0.23 | 0.24 | 0.22 | 0.24 | 0.25 |
| Washington | 598 | 207 | 65 | 259 | 129 | 114 | 40 | 13 | 52 | 26 | 0.19 | 0.19 | 0.20 | 0.20 | 0.20 |
Notes: United States: Includes the 50 U.S. states and the District of Columbia. Counties: Includes counties and countylike entities (e.g., parishes in Louisiana). Shortage area county: County has no VHA facility(ies) and county is a HRSA‐designated primary care or mental health HPSA (whole county or partial county). VHA facility: Includes VHA‐administered Community‐Based Outpatient Clinics (CBOCs), Integrated Clinical Facilities, Outpatient Clinics, VA Medical Centers, and Vet Centers. All Veteran populations reflect estimates as of 9/30/2015. S‐C: Service‐connected Veteran; these estimates reflect Veterans receiving VA compensation for a service‐connected illness, injury, or disability. Veteran population estimates have been rounded to the nearest 1,000 Veterans, consistent with recommendations of VA's Office of the Actuary. Delaware and the District of Columbia have no shortage area counties. Calculated proportions reflect the underlying estimates, not the rounded values. Example proportion calculation: Proportion of women Veterans in Shortage Area counties = 442,000/2,020,000 = 0.22.
<0.01.
These national‐level estimates obscure considerable variability at the state level for all Veteran subgroups. For example, the state‐level proportion of Enrolled Veterans in Shortage Area Counties is more than twice the national‐level proportion in five states (Iowa, Minnesota, South Dakota, Mississippi, and Oklahoma). Using this same criterion of twice the national proportion, two states have disproportionately high levels of women Veterans (Mississippi and Oklahoma), while four states have disproportionate numbers of Veterans aged 65 years and older and service‐connected Veterans in Shortage Area Counties. Mississippi consistently has the highest subgroup percentages in Shortage Area Counties, where the percentages of Veterans aged 65 years and older in Shortage Area Counties is estimated to be 71 percent, while the percentages of enrolled Veterans, women Veterans, and service‐connected Veterans are all approximately 60 percent. Hawaii and Massachusetts have the lowest proportions of Veterans living in Shortage Area Counties.
Figure 1 illustrates the variability of Veteran subgroup populations in Shortage Area Counties as a proportion of each state's total Veteran subgroup population. Five Census Divisions have consistently higher proportions of Veterans in Shortage Area Counties: the East North Central Division, the West North Central Division, the South Atlantic Division, the East South Central Division, and the West South Central Division. The remaining four divisions have generally lower proportions of Veterans in Shortage Area Counties (New England, Middle Atlantic Division, Mountain Division, and Pacific Division).
Figure 1.
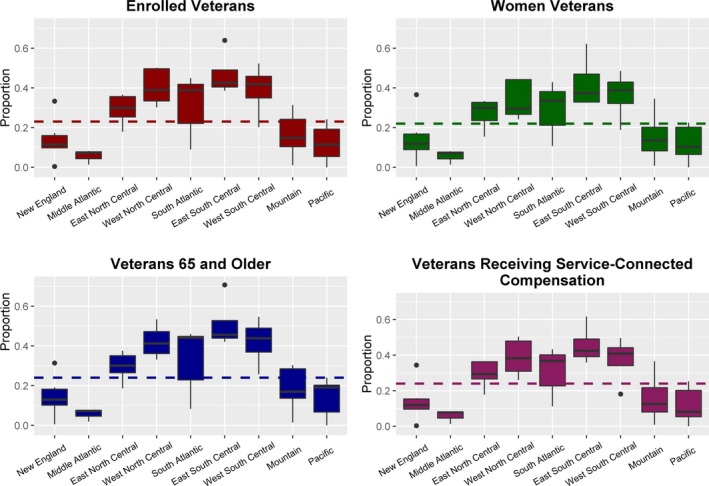
State‐Level Population Proportions (Shortage Area Counties vs. All Counties), 2015, by Group and Census Division Note: Dashed lines indicate national proportions. For example, the national proportion of Enrolled Veterans in Shortage Area Counties is 0.23. [Color figure can be viewed at wileyonlinelibrary.com].
Figure 2 shows the distribution of Shortage Area Counties and high VHA enrollment across the United States. One salient trend is the lack of Shortage Area Counties in certain states and regions. Southern California, Arizona, Massachusetts, New Jersey, and other states in the New England Division have numerous contiguous counties that are not considered health workforce shortage counties. Shortage Area Counties with high VHA enrollment (defined as enrollment rates above the third quartile) tend to be more concentrated in areas in the northern United States—such as Montana, Nebraska, South Dakota, North Dakota, and Minnesota—and the Appalachian region covering parts of West Virginia, Kentucky, Virginia, and North Carolina.
Figure 2.
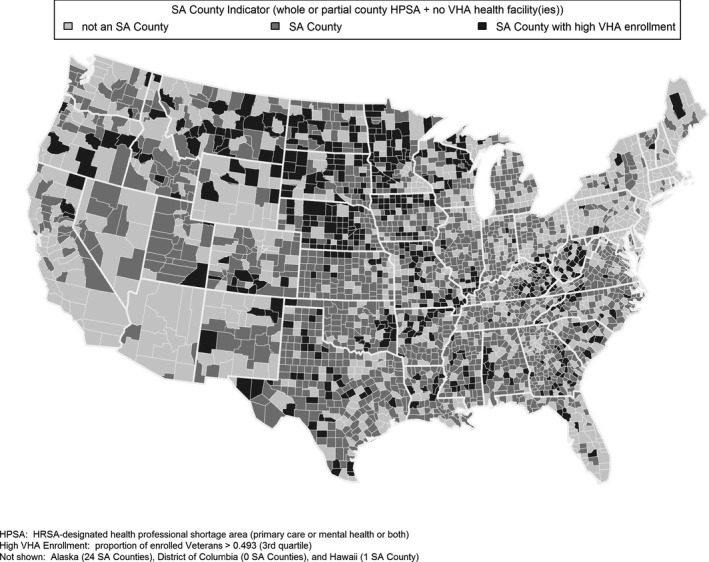
Shortage Area (SA) Counties
The aforementioned geographic trends may be driven in part by the geographic distribution of rural versus nonrural counties, and this is explored in Table 2. Of the 644 rural counties in the United States, 627 are considered Shortage Area Counties and 232 counties—or 36 percent—are rural shortage area counties with high VHA enrollment (i.e., VHA enrollment rates above the third quartile).
Table 2.
Shortage Area Counties, by State
| Total Counties | Counties with VHA Facility(ies) | Counties with no VHA Facility | Shortage Area Counties | Shortage Area Counties with High VHA Enrollment | Rural Counties | Rural Shortage Area Counties | Rural Shortage Area Counties with High Enrollment | Shortage Area Counties as Proportion of Total Counties | |
|---|---|---|---|---|---|---|---|---|---|
| United States | 3,142 | 885 | 2,257 | 2,143 | 547 | 644 | 627 | 232 | 0.68 |
| Northeast Region | |||||||||
| New England Division | |||||||||
| Connecticut | 8 | 6 | 2 | 2 | 0 | 0 | 0 | 0 | 0.25 |
| Maine | 16 | 9 | 7 | 6 | 1 | 2 | 2 | 1 | 0.38 |
| Massachusetts | 14 | 12 | 2 | 2 | 0 | 0 | 0 | 0 | 0.14 |
| New Hampshire | 10 | 8 | 2 | 2 | 0 | 0 | 0 | 0 | 0.2 |
| Rhode Island | 5 | 3 | 2 | 1 | 0 | 0 | 0 | 0 | 0.2 |
| Vermont | 14 | 6 | 8 | 6 | 1 | 3 | 3 | 1 | 0.43 |
| Middle Atlantic Division | |||||||||
| New Jersey | 21 | 17 | 4 | 1 | 0 | 0 | 0 | 0 | 0.05 |
| New York | 62 | 43 | 19 | 18 | 2 | 1 | 1 | 0 | 0.29 |
| Pennsylvania | 67 | 44 | 23 | 18 | 2 | 4 | 3 | 1 | 0.27 |
| Midwest Region | |||||||||
| East North Central Division | |||||||||
| Illinois | 102 | 25 | 77 | 76 | 16 | 10 | 10 | 5 | 0.75 |
| Indiana | 92 | 18 | 74 | 63 | 4 | 5 | 5 | 1 | 0.68 |
| Michigan | 83 | 30 | 53 | 51 | 4 | 14 | 14 | 2 | 0.61 |
| Ohio | 88 | 35 | 53 | 44 | 4 | 2 | 2 | 0 | 0.5 |
| Wisconsin | 72 | 20 | 52 | 47 | 20 | 13 | 13 | 8 | 0.65 |
| Midwest Region | |||||||||
| West North Central Division | |||||||||
| Iowa | 99 | 16 | 83 | 81 | 33 | 20 | 20 | 6 | 0.82 |
| Kansas | 105 | 20 | 85 | 85 | 10 | 42 | 42 | 4 | 0.81 |
| Minnesota | 87 | 14 | 73 | 64 | 42 | 19 | 19 | 16 | 0.74 |
| Missouri | 115 | 30 | 85 | 85 | 32 | 30 | 30 | 15 | 0.74 |
| Nebraska | 93 | 11 | 82 | 82 | 50 | 51 | 50 | 33 | 0.88 |
| North Dakota | 53 | 9 | 44 | 44 | 19 | 37 | 37 | 16 | 0.83 |
| South Dakota | 66 | 12 | 54 | 54 | 29 | 42 | 37 | 20 | 0.82 |
| South Region | |||||||||
| South Atlantic Division | |||||||||
| Delaware | 3 | 3 | 0 | 0 | 0 | 0 | 0 | 0 | 0 |
| Dist. of Columbia | 1 | 1 | 0 | 0 | 0 | 0 | 0 | 0 | 0 |
| Florida | 67 | 37 | 30 | 30 | 5 | 2 | 2 | 0 | 0.45 |
| Georgia | 159 | 26 | 133 | 129 | 25 | 22 | 21 | 6 | 0.81 |
| Maryland | 24 | 14 | 10 | 7 | 0 | 0 | 0 | 0 | 0.29 |
| North Carolina | 100 | 20 | 80 | 72 | 13 | 16 | 15 | 4 | 0.72 |
| South Carolina | 46 | 13 | 33 | 33 | 7 | 1 | 1 | 0 | 0.72 |
| Virginia | 133 | 24 | 109 | 88 | 10 | 21 | 19 | 3 | 0.66 |
| West Virginia | 55 | 17 | 38 | 36 | 18 | 11 | 8 | 5 | 0.65 |
| East South Central Division | |||||||||
| Alabama | 67 | 16 | 51 | 51 | 11 | 11 | 11 | 5 | 0.76 |
| Kentucky | 120 | 18 | 102 | 92 | 26 | 36 | 36 | 13 | 0.77 |
| Mississippi | 82 | 11 | 71 | 71 | 13 | 21 | 21 | 3 | 0.87 |
| Tennessee | 95 | 21 | 74 | 72 | 7 | 16 | 15 | 1 | 0.76 |
| South Region | |||||||||
| West South Central Division | |||||||||
| Arkansas | 75 | 17 | 58 | 57 | 17 | 13 | 13 | 6 | 0.76 |
| Louisiana | 64 | 16 | 48 | 48 | 9 | 5 | 5 | 1 | 0.75 |
| Oklahoma | 77 | 12 | 65 | 65 | 16 | 16 | 16 | 3 | 0.84 |
| Texas | 254 | 48 | 206 | 197 | 35 | 49 | 49 | 13 | 0.78 |
| West Region | |||||||||
| Mountain Division | |||||||||
| Arizona | 15 | 12 | 3 | 3 | 0 | 0 | 0 | 0 | 0.2 |
| Colorado | 64 | 20 | 44 | 43 | 10 | 20 | 20 | 6 | 0.67 |
| Idaho | 44 | 11 | 33 | 33 | 7 | 10 | 10 | 2 | 0.75 |
| Montana | 56 | 16 | 40 | 40 | 23 | 29 | 28 | 19 | 0.71 |
| Nevada | 17 | 7 | 10 | 10 | 0 | 4 | 4 | 0 | 0.59 |
| New Mexico | 33 | 16 | 17 | 16 | 4 | 6 | 6 | 4 | 0.48 |
| Utah | 29 | 7 | 22 | 22 | 2 | 5 | 5 | 1 | 0.76 |
| Wyoming | 23 | 15 | 8 | 8 | 6 | 4 | 4 | 4 | 0.35 |
| Pacific Division | |||||||||
| Alaska | 29 | 5 | 24 | 24 | 2 | 17 | 17 | 2 | 0.83 |
| California | 58 | 36 | 22 | 22 | 3 | 4 | 4 | 1 | 0.38 |
| Hawaii | 5 | 4 | 1 | 1 | 1 | 0 | 0 | 0 | 0.2 |
| Oregon | 36 | 18 | 18 | 18 | 6 | 5 | 4 | 1 | 0.5 |
| Washington | 39 | 16 | 23 | 23 | 2 | 5 | 5 | 0 | 0.59 |
Notes: United States: Includes the 50 U.S. states and the District of Columbia (Dist. of Columbia). Counties: Includes counties and countylike entities (e.g., parishes in Louisiana). VHA facility: Includes VHA‐administered Community‐Based Outpatient Clinics (CBOCs), Integrated Clinical Facilities, Outpatient Clinics, VA Medical Centers, and Vet Centers. Shortage area county: County has no VHA facility(ies) and county is a HRSA‐designated primary care or mental health HPSA (whole county or partial county). Rural county: USDA Economic Research Service Rural‐Urban Commuting Area (RUCA) Code = 8 or 9.
Table 2 also suggests considerable variation by state. For instance, all four rural counties in Wyoming and 80 percent of the rural counties in Minnesota are Shortage Area Counties with high VHA enrollment. However, none of the rural counties in Washington, Nevada, South Carolina, Florida, Ohio, and New York are shortage areas with high VHA enrollment.
Table 2 also reinforces some of the broader trends noted above. For example, approximately 70 percent (2,143) of the 3,142 U.S. counties with Veteran populations are considered Shortage Area Counties. In the 12 states that make up the East North Central and West North Central Divisions, 50 percent or more of each state's counties are considered Shortage Area Counties. Even more markedly, in the eight states that make up the East South Central and West South Central Divisions, 75 percent or more of each state's counties are considered Shortage Area Counties.
Discussion and Conclusions
Nationwide, it is estimated that almost one‐quarter of all Veterans and those enrolled in VHA live in counties that are health professional shortage areas and do not have VHA health care facilities or medical centers. Almost one‐quarter of Veterans older than 65 years and 22 percent of women Veterans live in shortage area counties. However, these estimates mask considerable geographic heterogeneity. Forty‐nine states have one or more Shortage Area Counties, while in 32 states, 50 percent or more of the state's counties are considered Shortage Area Counties. Moreover, counties in the South Atlantic Division have a disproportionate number of Veterans in Shortage Area Counties followed by the East North Central and West South Central Divisions of the United States. The highest proportion of Veterans living in Shortage Area Counties—across all subgroups considered—is in Mississippi. Most strikingly, nearly 71 percent of Veterans older than 65 years in Mississippi live in Shortage Area Counties.
Findings from this study reinforce the importance of considering rurality in geographic analyses of Veterans. While shortage area counties with high VHA enrollment tend to be distributed across many states in the United States, many are concentrated in areas in the northern United States—such as Montana, Nebraska, South Dakota, North Dakota, and Minnesota—and the Appalachian region covering parts of West Virginia, Kentucky, Virginia, and North Carolina. Thirty‐six percent of all rural counties in the United States are considered Shortage Area Counties with high VHA enrollment in this analysis. There is also considerable state‐by‐state heterogeneity. All four rural counties in Wyoming and 80 percent of rural counties in Minnesota are areas with high VHA enrollment and are Shortage Area Counties, whereas none of the rural counties in Washington, Nevada, South Carolina, Florida, Ohio, and New York have this designation.
Global findings from this study are consistent with at least one study of Veterans; however, these findings also underscore local area variability of providers in studies of health care access for Veterans and for policy planning. It is important to note that previous nationally representative studies on Veteran health care access have come to conflicting conclusions. Using the Medical Expenditure Panel Survey from 2006 to 2011, Bernard and Selden (2016) find that nonelderly Veterans were comparable to and non‐Veterans in terms of health care access after controlling for various characteristics (Bernard and Selden 2016). However, using data from the 2010–2011 Health Tracking Household Survey, Lee and Begley (2016) find that, after controlling for various characteristics, Veterans were more likely than those with private insurance to report delayed needed medical care (Lee and Begley 2016). On a national level, this study shows that the majority of Veterans across the United States do not live in Shortage Area Counties, a finding consistent with Bernard and Selden (2016). Conversely, findings from this study also show that Veterans living in certain areas in the United States potentially face significant barriers to accessing care—particularly those living in Mississippi and other specific areas mentioned previously. Thus, while some Veterans in the United States do not experience significant barriers to receiving the health care they were promised in exchange for their service to the American people, there remain large populations of Veterans who do.
Nevertheless, these findings, in addition to recommendations from the Commission on Care report, suggest opportunities for the flexible use of health workers. For instance, allowing nurse practitioners (NPs) practice to the fullest extent of their license has been found to be cost‐effective and efficient, improving health care quality, health care access, and patient satisfaction (Newhouse et al. 2011; Kutzleb et al. 2015; Kilpatrick, Jabbour, and Fortin 2016; Riley, Litsch, and Cook 2016). Recognizing these potential benefits, the Department of Veterans Affairs proposed a rule that would grant full practice authority to Advanced Practice Registered Nurses (APRN) when they are acting within the scope of their VA employment. Expanding the scope of practice for NPs is also a Commission on Care recommendation for increasing access to quality health care for Veterans. This change could potentially enhance health care access for Veterans living in shortage areas in Mississippi, West Virginia, Kentucky, Virginia, and North Carolina, where APRN scope of practice is either reduced or restricted. Although Service Area Counties reflect areas where there are no VHA facilities, expanding APRN scopes of practice could increase the availability of providers to Veterans whose services can be purchased by VHA.
Despite the strengths of using current county‐level data to identify geographic trends, this study has several limitations. First, counties are the smallest level of analysis considered, and this unit of analysis is not sufficiently granular in many—if not most—cases to address community‐level needs. Unfortunately, HRSA's HPSA designations and the publicly available Veteran population data do not permit a more granular analysis. Second, this study relates to the use of VHA health facility locations as a proxy for the supply of VHA providers. Providers may be geographically spread across multiple counties and some VHA facilities may have potentially inadequate capacities. Thus, this assumption may lead to an underestimation in the number of Shortage Area Counties and in the attendant Veteran populations in these Counties. Third, the current study does not consider specific types of providers. For instance, neither access to obstetricians/gynecologists for women Veterans nor access to geriatricians for Veterans aged 65 years and older are captured in this analysis.
Access to health care is complicated and not driven solely by the presence or absence of providers or facilities, which broadens opportunities for future research. Provider capacity, provider willingness to accept new patients, specialty, and cultural competence all factor into whether, where, and how needed health care is obtained (Agency for Healthcare Research and Quality 2014; Commission on Care 2016). Logistical constraints (travel time, transportation availability, etc.) can be major drivers in determining health care access. An individual's health literacy and ability to seek care can also have a profound influence on access to health care services. While the county‐level analysis presented herein was not able to take these factors into account, it is hoped that this analysis can serve as an initial step in characterizing health care capacity for Veterans across the United States, and that it can help to provide the foundation for targeted, community‐level analyses in which provider capacity, provider specialty, and other factors are examined. For example, a Census block group or tract‐level analysis, using nonpublic data available through VA or through the U.S. Census, may provide important information, especially in states with a high proportion of Shortage Area Counties. Targeted analyses of specific provider types and Veteran subpopulations (e.g., the supply obstetrician/gynecologists versus the population of Women Veterans) may also be informative for states where there large proportions of Veterans or Veteran subpopulations in Shortage Area Counties.
Veterans Affairs is working to substantially improve Veterans’ access to health care, and VA's FY 2017 budget includes funds to expand community programs, strengthen and integrate mental health services, construct and upgrade VHA facilities, provide medical education, and institute other initiatives to improve the ability of eligible Veterans to obtain needed health care (Department of Veterans Affairs 2016). Many of these initiatives explicitly target geographically remote settings. Other agencies are also working to strengthen the health workforce, improve access, and more effectively integrate primary care and behavioral health for all Americans. Ensuring that all Veterans have adequate access to health care is a shared challenge for the U.S. health care system—a challenge that requires a detailed understanding of the widespread geographic imbalances in provider supply. It is hoped that this study provides a first step in informing those analyses.
Supporting information
Appendix SA1: Author Matrix.
Acknowledgments
Joint Acknowledgment/Disclosure Statement: The authors would like to thank Sarika Parasuraman for comments on an earlier draft of the manuscript. Both authors are full‐time employees of the U.S. Department of Health and Human Services (HHS), and all work was conducted while the authors were employed at the Health Resources and Services Administration (HRSA). The views, analyses, and conclusions expressed in this paper are those of the authors and should not be construed as the official position or policy of HRSA, the National Institutes of Health, HHS, or the U.S. Government.
Disclosure: None.
Disclaimer: None.
Note
Eligibility for VHA health care generally requires completion of a defined period of active military, naval, or air service, together with a discharge from military service under a condition other than dishonorable (Title 38 2011; Gasper et al. 2015). These service requirements may be lessened for individuals with a service‐connected disability or condition. Purple Heart recipients, Medal of Honor recipients, Former Prisoners of War, and certain other former Service Members may be granted enhanced eligibility when enrolling in the VHA health care system.
References
- Agency for Healthcare Research and Quality . 2014. “National Healthcare Disparities Report, 2013.” Rockville, MD [accessed on August 17, 2016]. Available at http://www.ahrq.gov/research/findings/nhqrdr/nhdr13/chap10.html
- Bagalman, E . 2014. “The Number of Veterans That Use VA Health Care Services: A Fact Sheet.” Congressional Research Service (CRS) [accessed on February 11, 2016]. Available at https://www.fas.org/sgp/crs/misc/R43579.pdf
- Bernard, D. M. , and Selden T. M.. 2016. “Access to Care Among Nonelderly Veterans.” Medical Care 54 (3): 243–52. [DOI] [PubMed] [Google Scholar]
- Centers for Medicare and Medicaid Services . 2015. “Independent Assessment of the Health Care Delivery Systems and Management Processes of the Department of Veterans Affairs, Volume 1: Integrated Report.” Alliance to Modernize Health Care/Federally Funded Research and Development Center [accessed on February 11, 2016]. Available at http://www.va.gov/opa/choiceact/documents/assessments/integrated_report.pdf
- Commission on Care . 2016. “Final Report of the Commission on Care”. Washington, DC [accessed on August 17, 2016]. Available at https://commissiononcare.sites.usa.gov/files/2016/07/Commission-on-Care_Final-Report_063016_FOR-WEB.pdf
- Congressional Budget Office . 2014. “Title III of S. 2450, the Veterans’ Access to Care Through Choice, Accountability, and Transparency Act of 2014 (Cost Estimate)” [accessed on February 29, 2016]. Available at https://www.cbo.gov/publication/45441
- Department of Veterans Affairs . 2015a. “Expanded Access to Non‐VA Care through Veterans Choice Program (Interim Final Rule).” Federal Register 80 (230): 74991–6. [PubMed] [Google Scholar]
- Department of Veterans Affairs . 2015b. “Office of Rural Health Annual Report” [accessed on February 29, 2015]. Available at http://www.ruralhealth.va.gov/docs/ORH_Annual_Report_2015_FINAL.pdf
- Department of Veterans Affairs . 2016. “FY 2017 Budget Submission, Medical Programs and Information Technology Programs, Volume 2 of 4, February 2016” [accessed on February 29, 2016]. Available at http://www.va.gov/budget/products.asp
- Gasper, J. , Liu H., Kim S., and May L.. 2015. “2015 Survey of Veteran Enrollees’ Health and Use of Health Care.” Washington, DC: Department of Veterans Affairs. Available at http://www.va.gov/HEALTHPOLICYPLANNING/SoE2015/2015_VHA_SoE_Full_Findings_Report.pdf
- Government Accountability Office . 2016. “VA Health Care: Actions Needed to Improve Newly Enrolled Veterans’ Access to Primary Care.” Report to the Chairman, Subcommittee on Oversight & Investigations, Committee on Veterans’ Affairs, House of Representatives. Government Accountability Office [accessed on August 17, 2016]. Available at http://www.gao.gov/assets/680/675867.pdf
- Health Resources and Services Administration . 1993. “Primary Medical Care HPSA Designation Criteria” [accessed on February 29, 1993]. Available at http://bhpr.hrsa.gov/shortage/hpsas/designationcriteria/primarycarehpsacriteria.html
- Health Resources and Services Administration . 2015. “Lists of Designated Primary Medical Care, Mental Health, and Dental Health Professional Shortage Areas.” Federal Register 80 (126): 37637–8. [Google Scholar]
- Health Resources and Services Administration . 2016a. “HPSA Glossary” [accessed on February 29, 2016a]. Available at http://bhw.hrsa.gov/shortage/hpsas/hpsaglossary.html
- Health Resources and Services Administration . 2016b. “Shortage Designation: Health Professional Shortage Areas & Medically Underserved Areas/Populations” [accessed on February 29, 2016b]. Available at http://www.hrsa.gov/shortage/
- Hegseth, P . 2015. “Breaking Another Promise to Veterans.” Wall Street Journal. [accessed on August 17, 2016]. Available at http://www.wsj.com/articles/pete-hegseth-breaking-another-promise-to-veterans-1426205712 [Google Scholar]
- Hoge, M. A. , Stuart G. W., Morris J., Flaherty M. T., Paris M. Jr, and Goplerud E.. 2013. “Mental Health and Addiction Workforce Development: Federal Leadership is Needed to Address the Growing Crisis.” Health Affairs 32 (11): 2005–12. [DOI] [PubMed] [Google Scholar]
- Horgan, C. , Taylor A., and Wilensky G.. 1983. “Aging Veterans: Will They Overwhelm the VA Medical Care System?” Health Affairs 2 (3): 77–86. [DOI] [PubMed] [Google Scholar]
- Institute of Medicine . 2015. Transforming Health Care Scheduling and Access: Getting to Now. Washington, DC: National Academy of Sciences. [PubMed] [Google Scholar]
- Kilpatrick, K. , Jabbour M., and Fortin C.. 2016. “Processes in Healthcare Teams That Include Nurse Practitioners: What do Patients and Families Perceive to Be Effective?” Journal of Clinical Nursing 25 (5–6): 619–30. [DOI] [PubMed] [Google Scholar]
- Kutzleb, J. , Rigolosi R., Fruhschien A., Reilly M., Shaftic A. M., Fruhschien A., Duran D., and Flynn D.. 2015. “Nurse Practitioner Care Model: Meeting the Health Care Challenges With a Collaborative Team.” Nursing Economics 33 (6): 297–304. [PubMed] [Google Scholar]
- Lee, D. , and Begley C. E.. 2016. “Delays in Seeking Health Care: Comparison of Veterans and the General Population.” Journal of Public Health Management and Practice, doi: 10.1097/PHH.0000000000000420. [Epub ahead of print]. [DOI] [PubMed] [Google Scholar]
- Newhouse, R. P. , Stanik‐Hutt J., White K. M., Johantgen M., Bass E. B., Zangaro G., Wilson R. F., Fountain L., Steinwachs D. M., Heindel L., and Weiner J. P.. 2011. “Advanced Practice Nurse Outcomes 1990–2008: A Systematic Review.” Nursing Economics 29 (5): 230–50. [PubMed] [Google Scholar]
- Panangala, S. V . 2015. Veterans’ Medical Care: FY2016 Appropriations. Washington, DC: Congressional Research Service (CRS) [accessed on February 11, 2016]. Available at https://www.fas.org/sgp/crs/misc/R44301.pdf [Google Scholar]
- R Core Team (2016). R: A language and environment for statistical computing. R Foundation for Statistical Computing, Vienna, Austria. https://www.R-project.org/
- Ricketts, T. C. 2005. “Workforce Issues in Rural Areas: A Focus on Policy Equity.” American Journal of Public Health 95 (1): 42–8. [DOI] [PMC free article] [PubMed] [Google Scholar]
- Riley, L. , Litsch T., and Cook M. L.. 2016. “Preparing the Next Generation of Health Care Providers: A Description and Comparison of Nurse Practitioner and Medical Student Tuition in 2015.” Journal of the American Association of Nurse Practitioners 28 (1): 6–10. [DOI] [PubMed] [Google Scholar]
- Selim, A. J. , Berlowitz D. R., Fincke G., Cong Z., Rogers W., Haffer S. C., Ren X. S., Lee A., Qian S. X., Miller D. R., Spiro A. 3rd, Selim B. J., and Kazis L. E.. 2004. “The Health Status of Elderly Veteran Enrollees in the Veterans Health Administration.” Journal of the American Geriatrics Society 52 (8): 1271–6. [DOI] [PubMed] [Google Scholar]
- Sorrell, J. M. , and Durham S.. 2011. “Meeting the Mental Health Needs of the Aging Veteran Population: A Challenge for the 21st Century.” Journal of Psychosocial Nursing and Mental Health Services 49 (1): 22–5. [DOI] [PubMed] [Google Scholar]
- Title 38, Section 101 . 2011. “Veterans’ Benefits, Part I – General Provisions, Chapter 1 – General, Section 101 – Definitions.”
- United States Department of Agriculture . 2013. “Rural‐Urban Continuum Codes” [accessed on February 29, 2013]. Available at http://www.ers.usda.gov/data-products/rural-urban-continuum-codes.aspx
- Veterans Access, Choice, and Accountability Act of 2014 . 2014. PL 113‐46.
Associated Data
This section collects any data citations, data availability statements, or supplementary materials included in this article.
Supplementary Materials
Appendix SA1: Author Matrix.