Abstract
Background
Trauma is a leading cause of death and disability in the United States (US). This analysis describes trends and annual changes in in-hospital trauma morbidity and mortality; evaluates changes in age and gender specific outcomes, diagnoses, causes of injury, injury severity and surgical procedures performed; examines the role of teaching hospitals and Level 1 trauma centers in the care of severely injured patients.
Methods
We conducted a retrospective descriptive and analytic epidemiologic study of an inpatient database representing 20,659,684 traumatic injury discharges from US hospitals between 2000 and 2011. The main outcomes and measures were survey-adjusted counts, proportions, means, standard errors, and 95% confidence intervals. We plotted time series of yearly data with overlying loess smoothing, created tables of proportions of common injuries and surgical procedures, and conducted survey-adjusted logistic regression analysis for the effect of year on the odds of in-hospital death with control variables for age, gender, weekday vs. weekend admission, trauma-center status, teaching-hospital status, injury severity and Charlson index score.
Results
The mean age of a person discharged from a US hospital with a trauma diagnosis increased from 54.08 (s.e.= 0.71) in 2000 to 59.58 (s.e. = 0.79) in 2011. Persons age 45 to 64 were the only age group to experience increasing rates of hospital discharges for trauma. The proportion of trauma discharges with a Charlson Comorbidity Index score greater than or equal to 3 nearly tripled from 0.048 (s.e. = 0.0015) of all traumatic injury discharges in 2000 to 0.139 (s.e. = 0.005) in 2011. The proportion of patients with traumatic injury classified as severe increased from 22% of all trauma discharges in 2000 (95% CI 21, 24) to 28% in 2011 (95% CI 26, 30). Level 1 trauma centers accounted for approximately 3.3% of hospitals. The proportion of severely injured trauma discharges from Level 1 trauma centers was 39.4% (95% CI 36.8, 42.1). Falls, followed by motor-vehicle crashes, were the most common causes of all injuries. The total cost of trauma-related inpatient care between 2001 and 2011 in the US was $240.7 billion (95% CI 231.0, 250.5). Annual total US inpatient trauma-related hospital costs increased each year between 2001 and 2011, more than doubling from $12.0 billion (95% CI 10.5, 13.4) in 2001 to 29.1 billion (95% CI 25.2, 32.9) in 2011.
Conclusions
Trauma, which has traditionally been viewed as a predicament of the young, is increasingly a disease of the old. The strain of managing the progressively complex and costly care associated with this shift rests with a small number of trauma centers. Optimal care of injured patients requires a reappraisal of the resources required to effectively provide it given a mounting burden.
Keywords: Injury, Trauma, Epidemiology
Introduction
Trauma is a leading cause of death and disability in the United States (US). For children and adults younger than age 45, trauma accounts for an estimated 79,000 deaths each year, compared to 49,000 non-communicable disease deaths and 15,000 infectious disease deaths.1 In the US, trauma is the single most important cause of potential years of life lost for persons under age 65.2
There have been notable advances in our knowledge of the epidemiology of trauma in the US since Donald Trunkey declared “We simply do not know what the incidence of trauma is in this country, or where it occurs”. 3 The advent of national registries coupled with improved hospital record keeping and standardized billing over the past decade has led to the accumulation of a vast amount of information on trauma in the US. Numerous studies in the past five years have utilized databases such as the National Trauma Data Bank (NTDB) and Healthcare Cost and Utilization Project (HCUP) to investigate a wide range of trauma-related injuries and treatments. The nationwide scope of these studies and their findings inform clinicians, researchers, and policy makers alike.
Most studies utilizing large databases have focused on specific injuries such as vascular trauma to the extremities,4 spinal cord injuries, 5 and penetrating abdominal injury. 6 Other studies have concentrated on specific populations, such as the elderly, 7, 8 and adolescents. 9 Still other studies have used these databases to evaluate specific treatment protocols10 or policy changes. 11
Those studies that have taken a broader view of the epidemiology of trauma in the US have generally concentrated on mortality, 12 and have been either largely based on trauma registry data, 13 single institutions,14 or have been based on literature review.15 While informative in their own right, these studies fail to capture the full spectrum of the evolving patterns of trauma morbidity in the US over time.
In this paper, we present a large-data, nationally-representative, population-based study evaluating the descriptive epidemiology and trends of the inpatient incidence of trauma morbidity in the US between 2000 and 2011. We examine changes in the demographic characteristics of inpatient trauma, injury severity, the role of Level 1 trauma centers, the type of trauma (e.g. crush, burn, fracture), the most common causes of trauma, the most common trauma-related surgical procedures performed, and the hospital costs for the care of trauma patients. We believe it presents one of the fullest, most expansive recent pictures of a critically important cause of morbidity and mortality in the US.
Methods
Discharge Data
Data were obtained from the US Agency for Healthcare Research and Quality (AHRQ) Healthcare Cost and Utilization Nationwide Inpatient Sample for the years 2000 to 2011. HCUP is a group of inpatient and outpatient files created by AHRQ. The Nationwide Inpatient Sample (NIS) is a 20% weighted sample of the State Inpatient Database. It is released yearly and appropriate for analysis at the national, regional and census area level. The Nationwide Inpatient Sample (NIS) is a stratified, single-cluster sample design (geographic area, urban/rural, ownership, teaching status, bed size). It is based on a sampling frame of all community hospitals in the US and is designed to be a 20% sample of all community hospitals in the US. Community hospitals are defined as non-Federal general and specialty hospitals including public hospitals and academic medical centers. A complete census of discharges for each sampled hospital is included in the database. Weights must be applied to each entry to get national or regional estimates.
Injury Classifications
Raw data were read into a comma-separated file, and national survey adjusted estimates for individual years were verified against estimates obtained from a publicly available HCUP online query system. 16 Trauma discharges were identified using principal or first-listed international classification of diseases 9th edition 17 diagnosis codes for acute injury 800–904.9, 909.4, 909.9, 910–994.9, 995.5–995.59, and 995.80–995.85. As noted in the HCUP documentation “The ICD-9-CM coding guidelines define principal diagnosis as “that condition established after study to be chiefly responsible for occasioning the admission of the patient to the hospital for care.”“ 18 Discharges with codes for “late effect” primary diagnoses (ICD 905.0–909.9), insect bites (910.4, 910.5, 9114, 911.5, 912.4, 912.5, 913.4, 913.5, 914.4, 914.5, 915.4, 915.5, 916.4, 916.5, 917.4, 917.5, 919.4, 919.5), poisonings (960.0–964.9, 965.00–965.02, 965.09, 965.1, 965.4, 965.5, 965.61, 965.69, 965.7–969.0, 969.00–969.09, 969.70–969.73, 969.1–969.7, 967.0–967.9, 969.79, 969.8–980.9, 970.81, 970.89, 981, 982.0–985.9, 986, 987.0–989.7, 989.81:989.89, 989.9, 990, 991.0–995.2, 995.20–995.29, 995.3, 995.4), anaphylaxis (995.60–995.69,995.7) and some additional miscellaneous diagnoses (malignant hyperthermia, systemic inflammatory response syndrome, malfunctioning cardiac devices, 995.86–996.00) were removed. The R 19 “icd9” 20 package was used to apply descriptors to the diagnostic ICD9 codes and external cause of injury E-codes.
Primary ICD9 codes were categorized according to the Barell Matrix, an injury diagnosis matrix tool used internationally to standardize the classification of ICD-9 injury codes 800 to 995 according to 12 nature-of-injury columns and 36 body-location rows.21, 22 Injury severity was quantified using the ICD-derived Injury Severity Score (ICISS).23 In this approach, “survival risk ratios (are) calculated as the ratio of the number of times a given ICD-9 code occurs in a surviving patient in a cohort or data set to the total number of occurrences of that code. ICISS calculations were based on all listed diagnoses for all patients during the entire study period. The ICISS is a probability that ranges from 0 to 1, and is defined as the product of all the survival risk ratios for each of an individual patient’s injuries (for as many as ten different injuries)”. 24 Patients (discharges) with severe injuries were defined as those with an ICISS below 0.94. 25 The Charlson comorbidity index score was calculated for each discharge using listed ICD-9 codes. 20 The score was then categorized into an indicator variable for patients with a Charlson comorbidity index greater than or equal to 3.
Trauma Center Classifications and Costs
Information on 2040 US trauma centers was obtained from the American Trauma Society website. 26 27 The data consisted of both American College of Surgeons verified and state designated trauma centers and included all levels. These data were matched on name and address to 3,706 HCUP-sampled US hospitals in the study data set. The matching process returned 1,038 hospitals that were present in both the ATS database and the NIS study sample. The hospitals were assigned trauma center level designations 1 to 5 as reported by the ATS. Hospitals that did not match were assumed to non-trauma centers. A full description of the matching process and a link to the code is available as supplementary material. Teaching hospitals were identified by an NIS variable. Income quartiles were based on an NIS variable that assigns a quartile classification of the estimated median household income of residents in the patient’s ZIP Code. Hospital submitted charges were available for the period 2001–2011. Hospital reported charges were converted to costs with the AHRQ HCUP cost-to-charge ratio files using the group weighted average cost-to-charge ratio variable. Costs were then adjusted for inflation and standardized to 2010 US dollars based the all-item average yearly consumer price index obtained from the Bureau of Labor Statistics.28 We used the HCUP Clinical Classification Software system was used to categorize procedure codes.
Analyses
Statistical analysis consisted of survey-adjusted counts, proportions, means, standard errors, and 95% confidence intervals. Annual rates were calculated using US Census data obtained from the Agency for Healthcare Research and Quality as part of the HCUP family of data products. We analyzed yearly data with overlying loess smoothing lines and present tables of the proportion of common injuries and surgical procedures. We assessed strength and statistical significance of the beta coefficient for bivariate linear association between year and annual incidence rates. The importance of geographic region on this association was assessed with an interaction term for geographic region. We conducted a survey-adjusted logistic regression analysis for the effect of year on the odds of in-hospital death with control variables for age, gender, weekday vs. weekend admission, injury severity, trauma-center status, teaching-hospital status, injury severity and Charlson index score. We used the R “survey” package29 to adjust for the complex sampling design of NIS and conduct analyses. We tested for the assumption of linearity of the year variable and controled for year-to-year variability in the survey results using an approach recommended by the Centers for Disease Control and Prevention. 30, 31
A complete set of notes and code to reproduce or adapt the study methods are available at http://www.injuryepi.org/resources/Misc/knitHCUPCode.pdf. The study was approved by the New York University School of Medicine Institutional Review Board as exempt.
Results
Descriptive Statistics and Incidence Rates
There were 20,659,684 (se = 266,857) inpatient traumatic injury discharges in the US between 2000 and 2011, representing 4.4 % (95% CI 4.3, 4.5) of the total 465,342,651 (se = 2,635,360) all-cause hospital discharges during that time. For all traumatic injury discharges, the proportion of male and female discharges was approximately evenly split, with 50.2% female (sd = .4%). In Level 1 trauma centers, the proportion of female patients was 38.2% (sd=1.0%). For severely injured patients (ICISS <0.94), the proportion of female patients was 36.9% (sd=0.4%). The mean age of traumatic injury discharges over the study period increased from 54.08 (se= 0.71) in 2000 to 59.58 (se = 0.79) in 2011, or approximately 6 months per year. The median age of traumatic injury discharges increased from 56 in 2000 to 65 in 2011. During the same time period, the median age for all US hospital discharges increased from 50 to 54.
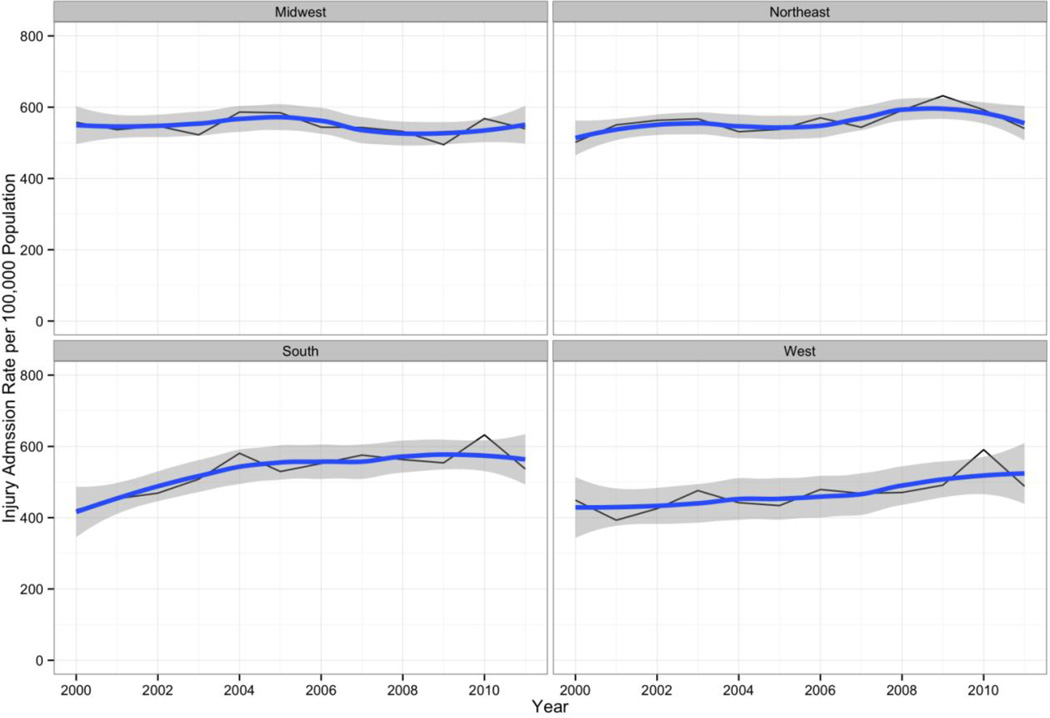
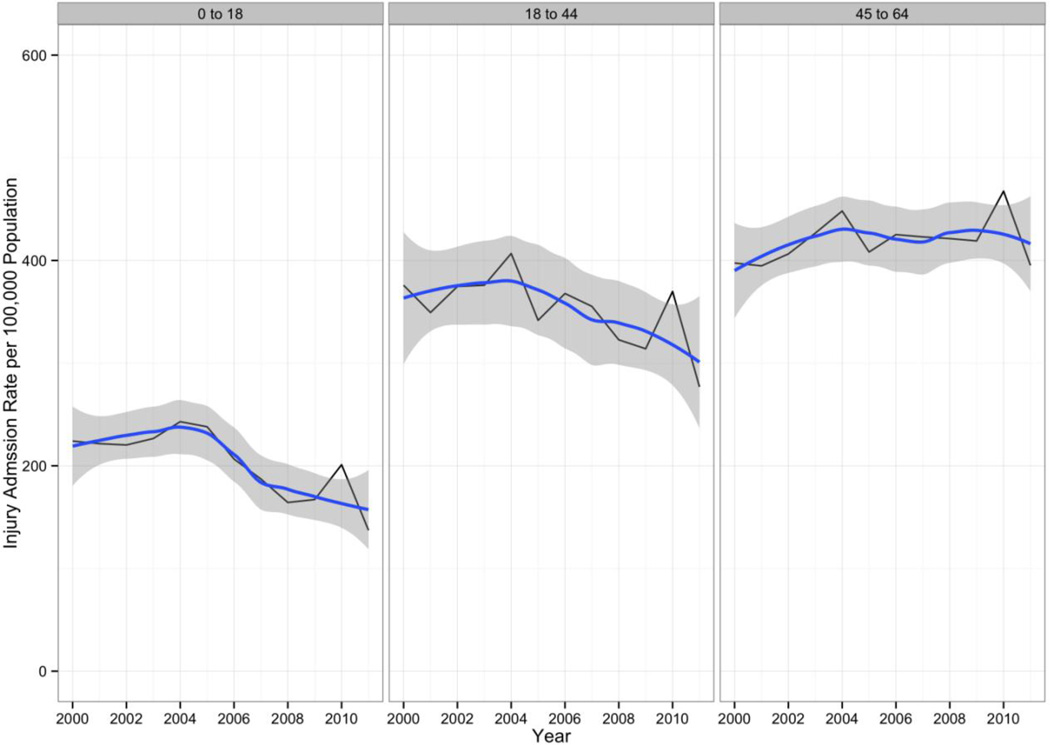
The average annual rate of trauma discharges remained steady at 524.3 per 100,000 population (95% CI 483.3, 505.4) (β for effect of year on trauma discharge rate −1.67, se=1.76, p=0.364). An interaction term for census region by year was statistically significant for a higher trend over the study period for the South (β = 14.5, se=3.8, p < 0.0005) and West (β = 11.1, se=3.8, p = 0.0006) census regions. (Figure 1) U.S. Population-based rates of traumatic injury discharges for children and younger adults declined during the study period, while rates for older adults held constant. (Figure 2) The only group that experienced increasing rates of trauma discharges were those aged 45 to 64.
Figure 1.
Annual Traumatic Injury Hospital Admission Rates per 100,000 Population with Overlying Loess Smoothing Line and Confidence Envelope. US Census Regions, 2000–2011.
Figure 2.
Annual Traumatic Injury Hospital Admission Rates per 100,000 Population with Overlying Loess Smoothing Line and Confidence Envelope. Children and Young Adults. US, 2000–2011.
Comorbidity, Case-Fatality and Severity
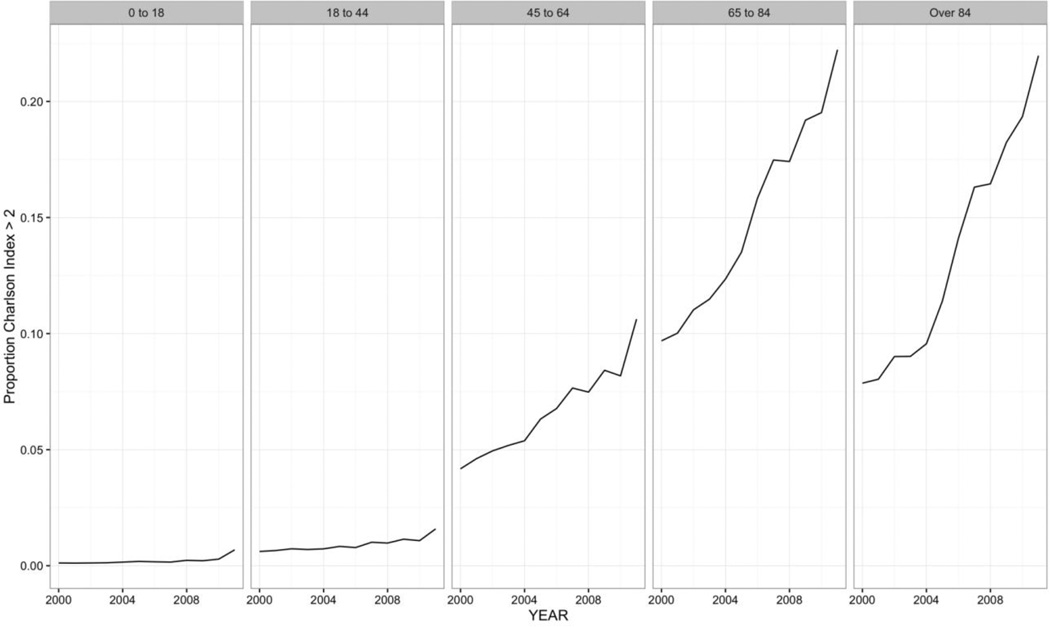
The number of comorbidities associated with trauma patients incrased during the study period. The proportion of all trauma discharges with a Charlson Comorbidity Index score greater than or equal to 3 increased from 0.048 (s.e. = 0.0015) of all traumatic injury discharges in 2000 to 0.139 (s.e. = 0.005) in 2011. The largest increase in comorbidities was seen for the older age groups. (Figure 3) Patients who died prior to hospital discharge had significantly more comorbid disease than patients who survived (1.14 vs 0.70, p < 0.0001).
Figure 3.
Proportion of Discharges with Charlson Index Score > 2 by Age Group. Inpatient Traumatic Injury Discharges, US Hospitals, 2003–2011.
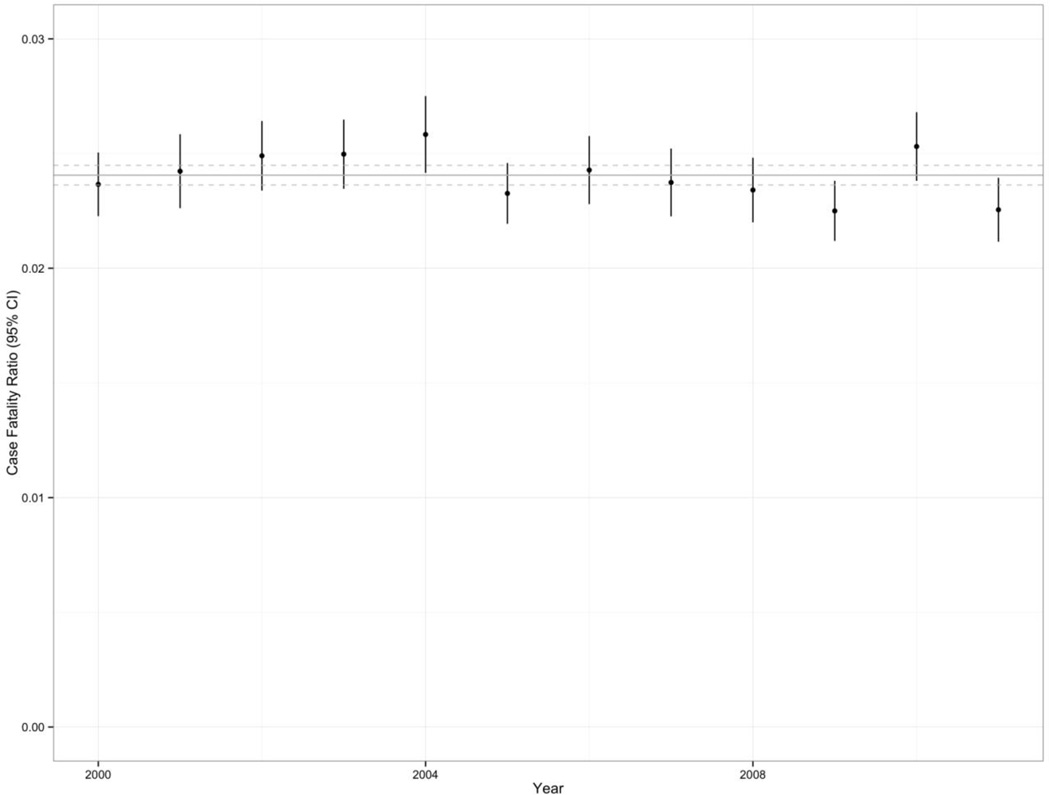
There were 451,058 (se = 14693) inpatient deaths due to trauma during the study period. The overall mean in-hospital mortality rate during the 12 years was 2.4% (se = 0.04) with some graphical evidence of a decline in inpatient mortality. (Figure 4)
Figure 4.
Case-Fatality Ratio, All Ages. Inpatient Traumatic Injury Discharges, US Hospitals, 2003–2011.
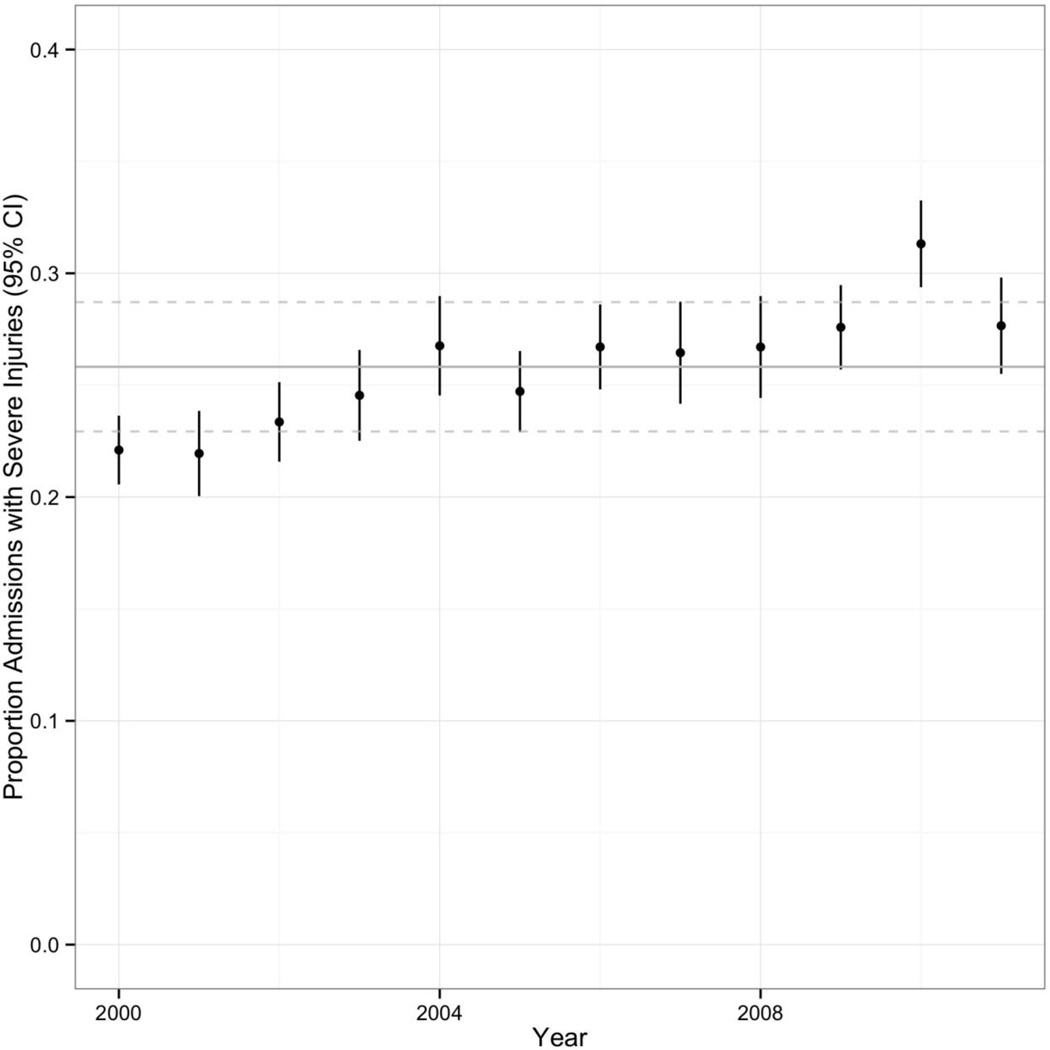
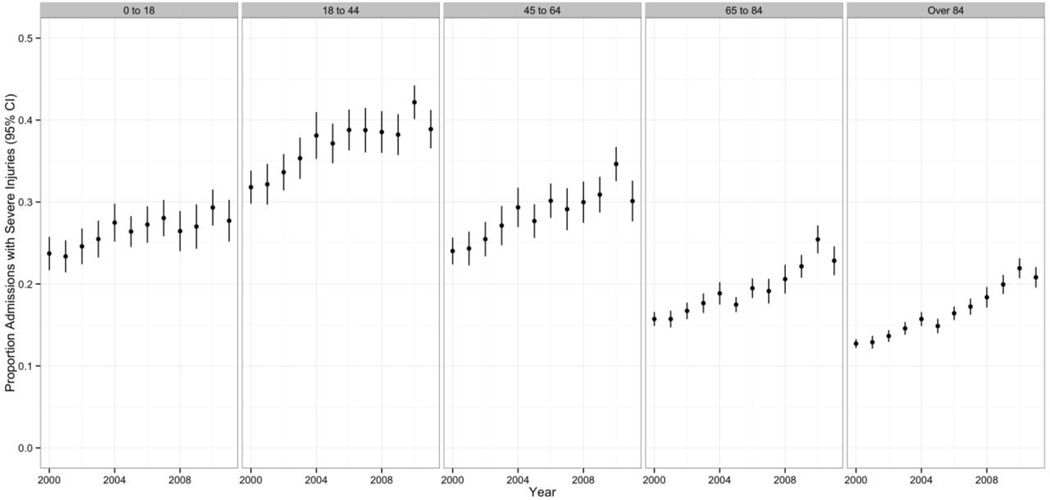
The overall proportion of discharged trauma cases classified as having severe injury was 25.9% ( 95% CI 24.8, 26.9); the annual proportion increased over the study period, from 22% of all trauma discharges in 2000 (95% CI 21, 24) to 28% in 2011 (95% CI 26, 30). (Figure 5) While all age groups experienced some increase in the proportion of severe trauma over the study period, the age group with the highest proportion of severe trauma was the 18-to-44 year-old group (37%, se = 0.01). (Figure 6) The proportion of trauma classified as severe was highest among the lowest income quartile (28.9%, se = 0.01). Differences between income quartiles were statistically significant (β for association of income quartile with proportion of severe trauma = −0.009, se = 0.004, p=0.02)
Figure 5.
Annual Proportion of Hospital Trauma Discharges Classified as Severe. US, 2000 to 2011.
Figure 6.
Proportion of Traumatic Injuries Classifed as Severe Over Time, by Age Group. US, 2000 to 2011.
Teaching Hospitals , Trauma Centers
A higher proportion of severely injured discharges were from teaching hospitals (32.6%, 95% CI 31.1, 34.0) than from non-teaching hospitals( 18.7%, 95% CI 17.9, 19.5). In a survey logistic regression model, severely injured trauma discharges were more than twice as likely to be discharged from a teaching hospital than from a non-teaching hospital (OR =2.1, 95% CI 1.9, 2.3). Teaching hospitals had a higher inpatient trauma case fatality ratio than non-teaching hospitals. (2.8% (se .06%) vs 1.9% (se .03%)).
The proportion of severely injured trauma discharges from Level 1 trauma centers was 39.4% (95% CI 36.8, 42.1). The unadjusted case fatality ratio in Level 1 trauma centers was 3.4% (95% CI 3.2, 3.7) compared to 2.3% (95% CI 2.2, 2.3) in non-Level 1 trauma centers. In a survey logistic regression model, the unadjusted association of Level 1 trauma status with inpatient mortality was 1.53 (95% CI 1.4, 1.7). In a survey logistic model adjusted for age, gender, injury severity, comorbidity score, teaching hospital and trauma center status, the odds of inpatient mortality decreased by approximately 5% per year during the study period. (Table 1)
Table 1.
Results of Logistic Regression Model for In-Hospital Mortality. Trauma Hospital Discharges, US Hospitals, 2000–2011.
| Variable | Odds Ratio (95% CI) |
|---|---|
| Year | 0.95 (0.95, 0.96) |
| Age | 1.02 (1.02, 1.03) |
| Female | 0.68 (0.66, 0.69) |
| Teaching Hospital | 1.41 (1.35, 1.48) |
| Weekend Admission | 1.05 (1.03, 1.07) |
| Level 1 Trauma Center | 1.25 (1.16, 1.34) |
| Severe Injury | 6.75 (6.48, 7.03) |
| Charlson Index | 1.30 (1.29, 1.31) |
Injury Classifications, E-codes and Procedures
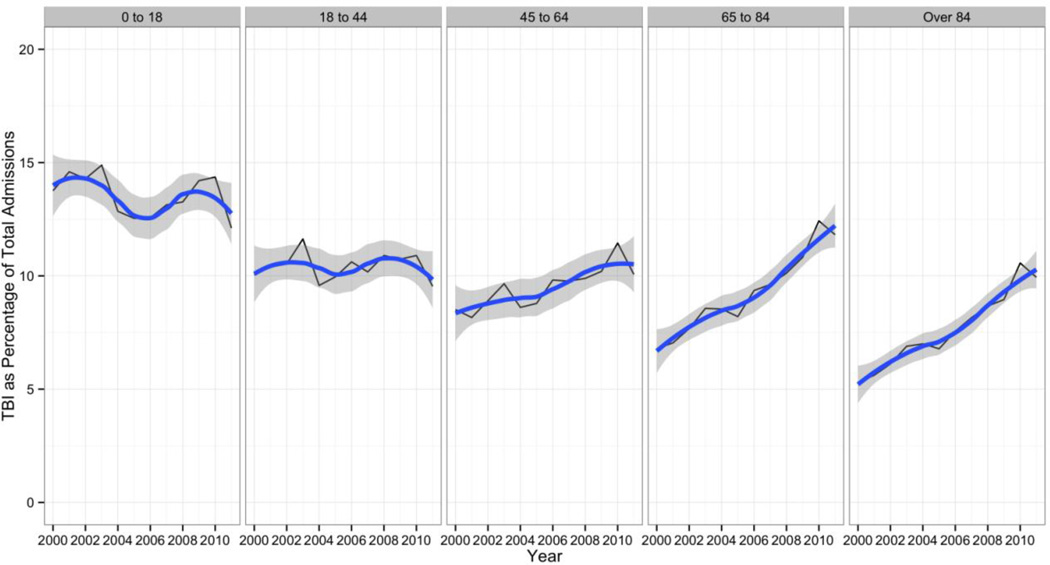
Extremity fractures represented 52.5% (8,727,070/16,624,488) of all injury discharges with sufficient data to characterize them according to the Barrel matrix. By contrast, only 0.6% of severely injured discharges were primarily characterized as extremity fractures. (Table 2) Using Barrel matrix terminology, 4.2% of non-severe injuries our data (594,179/14,236,234) were located in the upper leg and thigh, compared to 3.8% of severe injuries (156,431/4,142,538); 16.84% of non-severe injuries were classified as being located in the head and neck, vs. 33.57% of severe injuries. There was a relative increase in the proportion of TBI injuries Over the study period. It appeared that older-age discharges accounted for the much of the increase in TBI discharges over time. (Figure 7)
Table 2.
Proportion of Severe Injuries by Type and Anatomic Location. US Hospital Trauma discharges, 2000–2011
| EXTREMITIES | HEAD&NECK | SPINE&BACK | TORSO | UNCLASSIFIABLE | TOTAL | |
|---|---|---|---|---|---|---|
| AMPUTATIONS | 0.77 | 0.00 | 0.00 | 0.00 | 0.00 | 0.77 |
| BLOOD VESSELS | 2.16 | 5.99 | 0.00 | 6.55 | 6.43 | 21.14 |
| BURNS | 1.99 | 1.89 | 0.00 | 1.17 | 3.91 | 8.96 |
| CRUSHING | 0.75 | 5.76 | 0.00 | 5.63 | 6.56 | 18.69 |
| DISLOCATION | 0.53 | 0.48 | 0.37 | 1.58 | 0.00 | 2.96 |
| FRACTURES | 0.55 | 2.66 | 1.01 | 2.50 | 2.02 | 8.75 |
| INTERNAL ORGAN | 0.00 | 4.28 | 1.44 | 5.27 | 6.56 | 17.55 |
| NERVES | 0.46 | 2.29 | 0.00 | 0.62 | 0.49 | 3.85 |
| OPEN WOUNDS | 0.45 | 1.89 | 0.00 | 1.26 | 1.14 | 4.74 |
| SPRAINS & STRAINS | 0.03 | 0.46 | 0.17 | 0.04 | 0.03 | 0.74 |
| SUPERFIC / CONT | 0.10 | 0.51 | 0.00 | 0.32 | 0.36 | 1.30 |
| SYSTEM WIDE | 0.00 | 6.56 | 0.00 | 0.00 | 1.72 | 8.27 |
| UNSPECIFIED | 0.10 | 0.80 | 0.00 | 0.38 | 0.99 | 2.27 |
| TOTAL | 7.90 | 33.57 | 2.99 | 25.33 | 30.21 | 100.00 |
Figure 7.
Percentage of Annual Traumatic Injury Discharges Classified as TBI by Age Group. US Hospitals 2000–2011.
Primary trauma E-code information was available for 14,074,803 trauma discharges between 2003 to 2011 representing 68.1% of the total traumatic injury discharge data set. For the entire set of E-codes, the most common trauma mechanism involved a fall (6,653,916 trauma discharges; 47.27% of all trauma mechanisms), the next most common involved a motor vehicle crash (1,022,621 trauma discharges, 7.27% of all trauma mechanisms). 3,811,988 (27.08%) of the entire set of E-codes were associated with severe injuries. Among these discharges, the most common mechanism involved a fall (1,010,694 discharges; 26.52% of total severe trauma) and the next most common mechanism involved a motor vehicle crash (767,771 discharges; 20.14% of total severe trauma). Trauma mechanisms varied by age group, with falls becoming increasingly important in older age groups. Younger persons were more likely to be admitted due to a violent assault. (Table 3)
Table 3.
Top 5 Trauma Mechanisms by Age Group, Inpatient Trauma Discharges, US Hospitals, 2003–2011.
| AgeGroup | E-code Description | Count | Percent of Total |
|---|---|---|---|
| Younger than 18 (1,395,273 Total Count) |
E884.9 Fall-1 level to oth NEC | 66039 | 5.18 |
| E812.1 MV Collision NOS-pasgr | 59282 | 4.65 | |
| E884.0 Fall from playgrnd equip | 52335 | 4.11 | |
| E826.1 Ped cycl acc-ped cyclist | 49684 | 3.90 | |
| E885.9 Fall from slipping NEC | 47747 | 3.75 | |
| 18 to 44 (3,820,488 Total Count) |
E812.0 MV collision NOS-driver | 240000 | 6.87 |
| E816.0 Loss control MV acc-driv | 169912 | 4.86 | |
| E885.9 Fall from slipping NEC | 145362 | 4.16 | |
| E966.0 Assault Cutting Piercing | 134566 | 3.85 | |
| E960.0 Unarmed fight or brawl | 113261 | 3.24 | |
| 45 to 64 (3,207,080 Total Count) |
E885.9 Fall from slipping NEC | 439800 | 15.26 |
| E888.9 Fall NOS | 310644 | 10.78 | |
| E880.9 Fall on stair/step NEC | 153398 | 5.32 | |
| E812.0 Mv collision NOS-driver | 140980 | 4.89 | |
| E881.0 Fall from ladder | 108330 | 3.76 | |
| 65 to 84 (4,520,989 Total Count) |
E885.9 Fall from slipping NEC | 1227898 | 30.54 |
| E888.9 Fall NOS | 1030323 | 25.63 | |
| E880.9 Fall on stair/step NEC | 217820 | 5.42 | |
| E888.8 Fall NEC | 170919 | 4.25 | |
| E812.0 Mv collision NOS-driver | 87655 | 2.18 | |
| 85 and Older (2,626,759 Total Count) |
E888.9 Fall NOS | 805236 | 34.05 |
| E885.9 Fall from slipping NEC | 782996 | 33.11 | |
| E888.8 Fall NEC | 126996 | 5.37 | |
| E884.4 Fall from bed | 83642 | 3.54 | |
| E880.9 Fall on stair/step NEC | 75222 | 3.18 | |
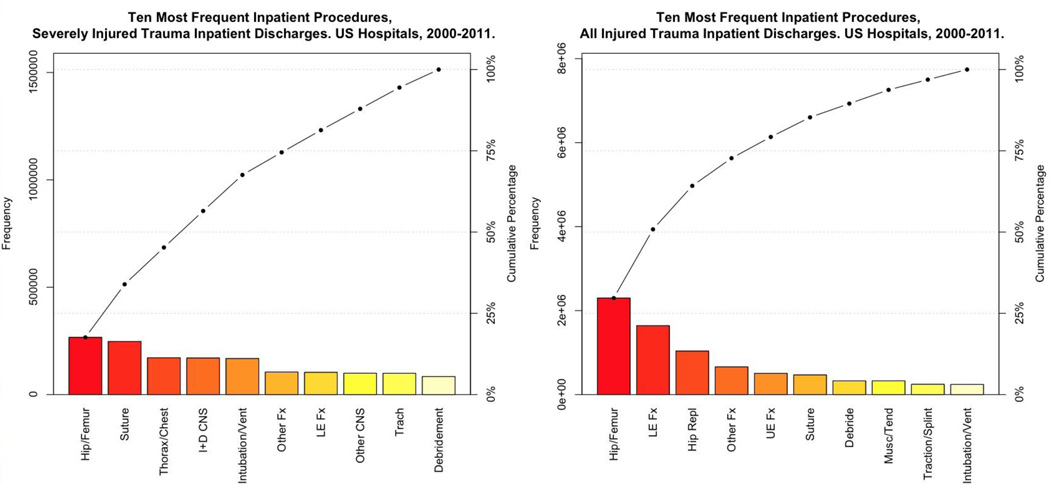
A total of 14,219,737 procedures were listed for trauma discharges during the study period. The most common procedures for the total cohort of trauma discharges in the US between 2000 and 2011 were orthopedic in nature, with treatment of hip and femur fractures being the most common procedures. Among severely injured trauma discharges, the proportion of orthopedic injuries declined, and procedures involving the chest and central nervous system were more common. (Figure 8)
Figure 8.
Pareto Chart 10 Most Frequent Inpatient Procedures, Severely Injured vs. All Trauma Inpatient Discharges. US Hospitals, 2000–2011.
Length of Stay and Costs
The average length of stay for all trauma discharges during the study period was 5.1 days (95% CI 5.0, 5.2), with a median length of stay of 3 days (Interquartile Range (IQR) = 6 – 2 = 4 days) For severely injured discharges, the average length of stay was 7.5 days (95% CI 7.3, 7.7), with a median stay of 4 days (IQR = 8 – 2 = 4 days).
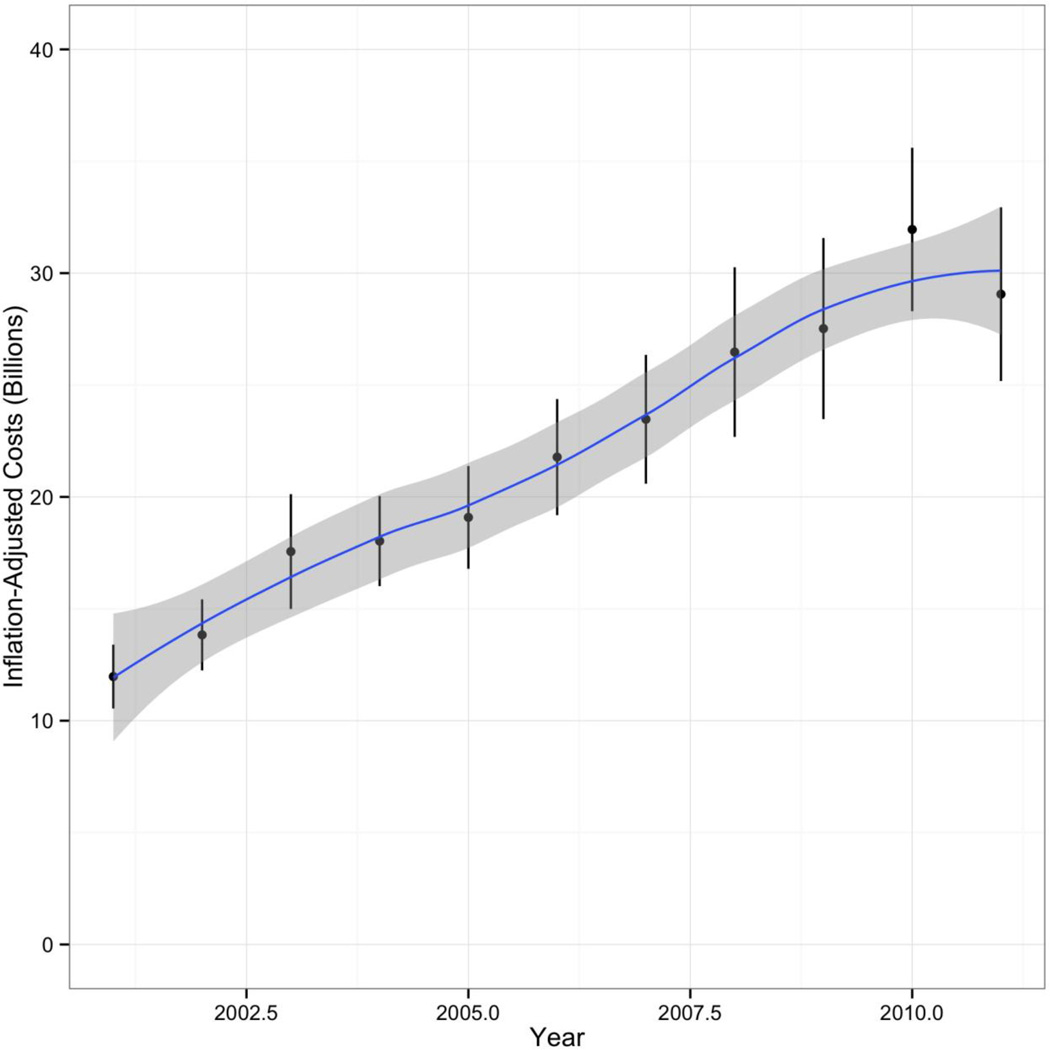
The total cost of trauma-related inpatient care between 2001 and 2011 in the US reported in 2010 dollar was $240.7 billion (95% CI 231.0, 250.5), accounting for approximately 6.3% of the total $3.8 Trillion inpatient hospital costs in the US during that time period. Annual total US inpatient trauma-related hospital costs increased each year between 2001 and 2011, more than doubling from $12.0 billion (95% CI 10.5, 13.4) in 2001 to $29.1 billion (95% CI 25.2, 32.9) in 2011. (Figure 9) This 2.4 time increase was only slightly greater than overall inpatient costs in the US during the same period, which increased from 2.3 times from $204.6 billion (95% CI 195.4, 213.8) in 2001 to $474.6 billion (95% CI 436.9, 512.2) in 2011.
Figure 9.
Cost of Inpatient Care Traumatic Injuries, US Hospitals 2001–2011
Discussion
The epidemiology of the inpatient traumatic injury caseload in the US is changing in important and challenging ways. Inpatient trauma cases are increasingly older, approaching 60 years, more severely injured, and have an increased burden of co-morbid conditions compared to 10 years ago. Our results confirm and expand on initial reports of these trends.13, 14 This report places these changes in a national perspective by basing analyses on the largest most comprehensive cohort of inpatient trauma discharges to date.
The ageing of the inpatient trauma population is a reflection of the ageing of the nation, with a 21.1% increase in the population over the age of 62 during our study period.32 The increasing burden of elderly trauma has been recognized for some time. 33, 34 More recent data, including the results of this study, continue to emphasize the importance of this population.35, 36 Elderly trauma patients, compared with a younger cohort, suffer more significant injuries for a given mechanism of injury37–39 and have higher mortality rates for a given injury severity. The increased comorbidities observed in this population40, 41 often contribute to both the reason for injury and the poor outcomes that follow. Falls in the elderly are a particular challenge and our analyses indicate that this mechanism persists as an increasingly important cause of injury. Unsteady gait, vision and hearing alterations and polypharmacy put the elderly at increased risk of falling and the widespread use of anticoagulation medications increases the risk of intracranial hemorrhage. Head, chest and extremity injuries are also more apt to occur in this vulnerable population.38
For the elderly, a seemingly minor mechanism of injury such as a fall from standing height may result in disproportionately severe injury when compared to younger patients. 37–39 Head, chest and extremity injuries specifically are more likely to occur in the elderly following low velocity falls.38 This may be due in part to a significantly higher rate of comorbidities. 40, 41 We found that while extremity injuries represented only a small fraction of the most severely injured patients, there was a relatively larger proportion of fractures of the upper leg and thigh, consistent with fractures of the femur. This type of injury is common among older individuals and has been reported as an important cause of severe injuries.42 Trauma surgeons are faced not only with the management dilemma of severe injuries in this frail population, but must also consider post-discharge issues such as the safety of restarting medications, the most appropriate post-acute care setting, and patients’ short and long-term functionality.
According the American Hospital Association there are 5,686 hospitals of all types in the US. 43 The number of Level 1 trauma centers in the US has been estimated at 190 at the midpoint of this study period 44 accounting for 3.3% of hospitals. Our results indicate that this relatively small number of hospitals cared for nearly 40% of the most severely injured cases in the US. Despite this nearly 20-fold greater preponderance of the most severely injured trauma patients, the adjusted odds of in-hospital mortality was only 20% higher than that of non-Level 1 trauma centers. We were unable to demonstrate a lower odds of in-hospital mortality for severely injured patients in Level 1 trauma centers, as was recently reported. 45 This was not unexpected and may be due in part to unmeasured or residual confounding. Unlike a report39 based on individual-level propensity matching for clinical variables like obesity and coagulopathies, our adjustments were limited to the available administrative variables.
Similarly, teaching hospitals, which according to the Association of American Medical Colleges account for 1,009 (or 17.8%) of all hospitals 46 in the US, cared for approximately a third of the most severely injured cases. The role of teaching hospitals in treating trauma and their relation to trauma centers is complicated. In general, Level 1 trauma centers are distinguished by their research and scholarly activities Participation in resident and fellow training and education and the performance of trauma-related research typically requires the academic infrastructure inherent in teaching hospitals. Although Level 2 centers are not required to take part in these activities, they must meet the same standards for clinical care provision as Level 1 centers. Level 1 centers require a higher volume of those most severely injured in their communities so that staff experience and expertise in the care of these patients are maintained.47 The significantly higher percentage of severely injured discharges apparent in Level 1 centers is expected, and the higher in-hospital mortality is a result of the severity and critical nature of these injuries.
Our results are consistent with studies that have reported a 30% to 40% decrease in overall in-hospital trauma deaths during a similar time span. 13 Our adjusted regression coefficient result for year-to-year decline in case fatality should be interpreted cautiously. In a causal context, these regression coefficients can be taken as the strength of an association with all the other variables “held constant”. Properly, in a predictive context, this often means (as it does here) with all the other variables held to zero. For some variables, this is simple, e.g. gender set to male, injury severity set to non-severe, Charlson comorbidity set to zero. For others, it is quite difficult, e.g. age set to zero. These studies, though were based solely on trauma center data and started from baseline in-hospital fatality rates of nearly 8%. While these results for declines in overall mortality are welcome news, our results also mirror a national review of population-based injury mortality that found a 46% increase in rates of fall-related mortality. 12
We found the cost of trauma care to be increasing at a rate greater than increases in overall healthcare spending. This finding is consistent with reports that the increasing financial burden of caring for traumatic injuries has led some institutions to reconsider their traditional roles as trauma centers. 48
The study is subject to a number of important limitations. These are deidentified administrative discharge data. We refer to discharges rather than hospitalizations or patients because we cannot, from these data, distinguish multiple admissions for the same condition in the same individual. Administrative data themselves are a blunt instrument with which to conduct health research. The variables, including diagnoses, are generally entered by non-clinical personnel based on chart reviews. Clinically relevant variables are limited to diagnostic codes, age and gender. Other potentially important variables, such as race/ethnicity and marital status are not captured. Also, changes over time can be due to changes or improvements in coding.
Our approach to trauma center identification is far from perfect and our results are at best approximate. Ideally, we would have identified trauma centers using an internal NIS variable. The NIS does not howevser, like the Nationwide Emergency Department Survey (NEDS), have a separate variable that explicitly identifies trauma centers. The NIS uses a variable that since 2003 identifies admissions to a trauma center service (“ATYPE = 5”) based on Uniform Billing (UB-04) specifications. But, realistically, traumatic injuries could also receive admission codes as emergencies (“ATYPE=1”). When using the admission type variable provided in the HCUP data, we found a systematic undercount of trauma center admissions when compared to reports published by the National Trauma Databank. 49 For this reason we undertook the process of matching NIS hospitals to ATS trauma centers.
This approach was vulnerable to a number of errors, not the least of which is accurately matching potentially missed and variably spelled hospital identifying information. There was also a shortfall in the number of hospitals identified based on state restrictions on releasing hospital identifiers. Although it is difficult to estimate how many trauma centers were missed, in 2011, 19 of 46 states did not include hospital names. 50 While the NIS sampling strategy should ensure that that the 71 Level 1 trauma centers we were able to link were representative of the states which allow hospital names and addresses to be released, they may not be nationally representative. Most readers will also note that we excluded Level 2 trauma centers, which essentially mirror the clinical capabilities of Level 1 trauma centers. By restricting our analyses to the smaller number of Level 1 trauma centers, we hoped in part to minimize some of the potential misclassifications in our trauma center matching process.
We chose to dichotomize injury severity into severe vs. less severe both as a way to capture injury acuity and to address inherent problems with injury severity score as a continuous variable. 51 Dichotomizing a continuous variable like ICISS can result in the loss of important information, and our choice of 0.94 as the cut off for severe vs. non-severe injury, while not entirely arbitrary, can be subject to debate. 52 Dichotomization erases intercategorical differences. So, in our study, a patient with an ICISS of 0.93 is the same as one with a score of 0.01. But injury severity scoring is inherently statistically problematic. Both the classic and new injury severity score behave poorly as a continuous variable, with some authors recommending “that for statistical or analytical purposes the ISS/ NISS should not be considered a continuous variable”. 51 While ICISS has been reported to generally perform as well as ISS52, it also behaves similarly poorly as a continuous variable. We found statistical manipulations as log, square root and inverse logit transformations to be unhelpful in this regard and chose to dichotomize. This approach also allowed us to calculate useful and informative statistics based on probabilities, like odds ratios. A categorization scheme for ICISS using cutoffs for minor to critical injuries has been proposed 25 and may be informative for future studies.
We are used to seeing trauma incidence mostly through the lens of trauma center registry data. The picture presented here differs from that in some respect. For instance, our data shows that the overall distribution of trauma discharges was equal for men and women. However, most trauma registry-based epidemiologic data describe trauma as a predominantly male disease. As reported in this study using HCUP data, there were more males who were severely injured and more males discharged from Level 1 trauma centers, which is consistent with registry data. However, the registry data does not seem to capture the same number of female trauma patients that HCUP does, perhaps among the less injured or non-Level 1 trauma centers. This discrepancy may suggest that HCUP data give a more complete picture of all injured patients without a bias toward the more injured and those managed in major trauma centers.
The relatively new use of HCUP compared to NTDB has been the subject of some debate, with concerns raised that HCUP does not offer detailed information pertinent to trauma research, is not representative of a typical trauma center population as NTDB, and that HCUP data report more comorbidities and a lower case fatality rate compared to NTDB.54, 55 Others question the varying methodologies used when handling these large data sets, cautioning the need for advanced statistical approaches. 55 Despite these concerns, HCUP has grown in use throughout the scientific community and over 3,450 journal publications feature data from HCUP. In an analysis of TBI patients, it was noted that HCUP data were not only comparable, but in some ways superior to the widely-used National Hospital Discharge Survey and National Hospital Ambulatory Medical Care Survey. 56
We conclude that the face of trauma in the US is evolving. Trauma, which has traditionally been viewed as a predicament of the young, is increasingly a disease of the old. The strain of managing the progressively complex and costly care associated with this shift rests with a small number of trauma centers. While there is no evidence for significant changes in the character of that care, the already small number of trauma centers may be further constricting in coming years in the face of economic challenges with potential implications for the availability and quality of trauma care in the US. Likely, optimal care of injured patients requires a reappraisal of the resources required to effectively provide it given a recognized mounting burden.
Supplementary Material
Acknowledgments
Support. This research was supported by the National Institute for Child Health and Development (DiMaggio, Grant 1 R01 HD087460). The contents of the manuscript are the sole responsibility of the authors and do not necessarily reflect the official views of the funding agency.
Abbreviations
- HCUP
Healthcare Cost and Utilization Project
- NIS
National Inpatient Sample
- AHRQ
Agency for Healthcare Research and Quality
- ICD
International Classification of Disease
- CI
Confidence Interval
- s.e
standard error
Footnotes
Conflict of Interest. The authors have no conflicts of interest to declare.
Author Contribution Statement:
Dr. DiMaggio conceived the study, acquired and had full access to the data, obtained IRB approval, conducted all analyses, wrote the initial draft of the manuscript, interpreted the results, made critical revisions, and had final approval of the version to be published. Mr. Shinseki wrote initial drafts of the report. Drs. Ayoung-Chee, Wilson, Marshall, Lee and Wall, contributed to the conceptualization of the study, provided important revisions and edits, and approved the final version of the report. Ms. Maulana contributed editorial content, Dr. Pachter reviewed, approved and contributed revisions to the final version of the report. Dr. Frangos worked closely with Dr. DiMaggio on the conceptualization of the study, interpretation of the results, drafting of the manuscript and critical revisions for important intellectual content.
References
- 1.CDC. Saving Lives and Protecting People from Violence and Injuries. [Accessed: 14 September 2014];Centers for Disease Control and Prevention. http://www.cdc.gov/injury/overview/index.html.
- 2.Segui-Gomez M, MacKenzie E. Measuring the public health impact of injuries. Epidemiol Rev. 2003;25:3–19. doi: 10.1093/epirev/mxg007. [DOI] [PubMed] [Google Scholar]
- 3.Barancik JI, Chatterjee BF, Greene YC, Michenzi EM, Fife D. Northeastern Ohio trauma study: I. Magnitude of the problem. American journal of public health. 1983;73(7):746–751. doi: 10.2105/ajph.73.7.746. [DOI] [PMC free article] [PubMed] [Google Scholar]
- 4.Kauvar D, Sarfati M, Kraiss L. National trauma databank analysis of mortality and limb loss in isolated lower extremity vascular trauma. J Vasc Surg. 2011;53(6):1598–1603. doi: 10.1016/j.jvs.2011.01.056. [DOI] [PubMed] [Google Scholar]
- 5.Jain N, Ayers G, Peterson E, Harris M, Morse L, O’Connor K, et al. Traumatic spinal cord injury in the US, 1993–2012. JAMA. 2015;313(22):2236–2243. doi: 10.1001/jama.2015.6250. [DOI] [PMC free article] [PubMed] [Google Scholar]
- 6.Zafar S, Rushing A, Haut E, Kisat M, Villegas C, Chi A, et al. Outcome of selective non-operative management of penetrating abdominal injuries from the North American National Trauma Database. Br J Surg. 2012;(99 Suppl 1):155–164. doi: 10.1002/bjs.7735. [DOI] [PubMed] [Google Scholar]
- 7.Duvall D, Zhu X, Elliott A, Wolf S, Rhodes R, Paulk M, et al. Injury severity and comorbidities alone do not predict futility of care after geriatric trauma. J Palliat Med. 2015;18(3):246–250. doi: 10.1089/jpm.2014.0336. [DOI] [PMC free article] [PubMed] [Google Scholar]
- 8.Maxwell C, Miller R, Dietrich M, Mion L, Minnick A. The aging of America: a comprehensive look at over 25,000 geriatric trauma admissions to US hospitals. Am Surg. 2015;81(6):630–636. doi: 10.1177/000313481508100630. [DOI] [PubMed] [Google Scholar]
- 9.Asemota A, George B, Bowman S, Haider A, Schneider E. Causes and trends in traumatic brain injury for US adolescents. J Neurotrauma. 2013;30(2):67–75. doi: 10.1089/neu.2012.2605. [DOI] [PubMed] [Google Scholar]
- 10.Haut E, Haider A, Cotton B, Stevens K, Cornwell Er, Efron D. Reply to letter: “Prehospital intravenous fluid administration is associated with higher mortality in trauma patients: a National Trauma Data Bank analysis”. Ann Surg. 2014;259(2):e17–e18. doi: 10.1097/SLA.0000000000000243. [DOI] [PubMed] [Google Scholar]
- 11.Morrison C, Wyatt M, Carrick M. Impact of the 80-hour work week on mortality and morbidity in trauma patients: an analysis of the National Trauma Data Bank. J Surg Res. 2009;154(1):157–162. doi: 10.1016/j.jss.2008.06.004. [DOI] [PubMed] [Google Scholar]
- 12.Sise R, Calvo R, Spain D, Weiser T, Staudenmayer K. The epidemiology of trauma-related mortality in the US from 2002 to 2010. J Trauma Acute Care Surg. 2014;76(4):913–919. doi: 10.1097/TA.0000000000000169. discussion 920. [DOI] [PubMed] [Google Scholar]
- 13.Glance L, Osler T, Mukamel D, Dick A. Outcomes of adult trauma patients admitted to trauma centers in Pennsylvania, 2000–2009. Arch Surg. 2012;147(8):732–737. doi: 10.1001/archsurg.2012.1138. [DOI] [PubMed] [Google Scholar]
- 14.Kahl J, Calvo R, Sise M, Sise C, Thorndike J, Shackford S. The changing nature of death on the trauma service. J Trauma Acute Care Surg. 2013;75(2):195–201. doi: 10.1097/TA.0b013e3182997865. [DOI] [PubMed] [Google Scholar]
- 15.Pfeifer R, Tarkin I, Rocos B, Pape H. Patterns of mortality and causes of death in polytrauma patients-has anything changed? Injury. 2009;40(9):907–911. doi: 10.1016/j.injury.2009.05.006. [DOI] [PubMed] [Google Scholar]
- 16.HCUPnet. Healthcare Cost and Utilization Project (HCUP) [Accessed: 15 September 2015];Agency for Healthcare Research and Quality. 2006–2009 http://hcupnet.ahrq.gov/ [PubMed]
- 17.AMA. International classification of diseases, 9th revision, clinical modification : physician ICD-9-CM, 2005. [Chicago, Ill.]: AMA Press; 2004. [Google Scholar]
- 18.HCUP. HCUP Methods Series: Special Study on the Meaning of the First Listed Diagnosis. [Accessed: 15 September 2015];Agency for Healthcare Research and Quality. https://www.hcupus.ahrq.gov/reports/methods/2011_03.pdf.
- 19.R. R Development Core Team. [Accessed: 15 September 2015];R: A Language and Environment for Statistical Computing Version 3.0.2. 2015 http://www.r-project.org/
- 20.Wasey J. icd9: Tools for Working with ICD-9 Codes, and Finding Comorbidities. R Package. 2015 http://CRAN.R-project.org/package=icd9.
- 21.Barell V, Aharonson-Daniel L, Fingerhut LA, Mackenzie EJ, Ziv A, Boyko V, et al. An introduction to the Barell body region by nature of injury diagnosis matrix. Inj Prev. 2002;8(2):91–96. doi: 10.1136/ip.8.2.91. [DOI] [PMC free article] [PubMed] [Google Scholar]
- 22.Fingerhut LA, Aharonson-Daniel L, Mackenzie EJ, Ziv A, Boyko V, Abargel A, et al. The Barell matrix. Inj Prev. 2002;8(3):259. doi: 10.1136/ip.8.3.259. [DOI] [PMC free article] [PubMed] [Google Scholar]
- 23.Osler T, Rutledge R, Deis J, Bedrick E. ICISS: an international classification of disease-9 based injury severity score. J Trauma. 1996;41(3):380–386. doi: 10.1097/00005373-199609000-00002. discussion 386–8. [DOI] [PubMed] [Google Scholar]
- 24.Segui-Gomez M, Lopez-Valdez F. Injury Severity Scaling. In: Li G, Baker SP, editors. Injury Research. Springer; 2012. p. 291. [Google Scholar]
- 25.Gedeborg R. Injury incidence over time based on hospital admissions filtering by thresholds, risk categories or indicator diagnoses; Joint Meeting of International Collaborative Effort on Injury Statistics and the Global Burden of Disease-Injury Expert Group; 2009. [Google Scholar]
- 26.Society AT. [Accessed: 15 September 2014];Find Your Local Trauma Center. 2015 http://wwwamtraumaorg/?page=FindTraumaCenter.
- 27.Lang D. RJSONIO: Serialize R objects to JSON, JavaScript Object Notation. R package version 13–0. 2014 [Google Scholar]
- 28.Bureau of Labor Statistics. [Accessed 16 December 2015];CPI-U U.S. All Items Indexes and Annual Percent Changes From 1913 to Present. CPI Detailed Report November 2015. Table 24. Available at http://www.bls.gov/cpi/tables.htm.
- 29.Lumley T. Analysis of complex survey samples. Journal of Statistical Software. 2004;9(1):1–19. [Google Scholar]
- 30.Centers for Disease Control and Prevention. [Accessed 14 December 2015];Conducting Trend Analyses of YRBS Data. Available at http://www.cdc.gov/healthyyouth/yrbs/pdf/yrbs_conducting_trend_analyses.pdf.
- 31.Bieler GS, Brown GG, Williams RL, Brogan DJ. Estimating model-adjusted risks, risk differences, and risk ratios from complex survey data. American Journal of Epidemiology. 2010;171(5):618–623. doi: 10.1093/aje/kwp440. [DOI] [PubMed] [Google Scholar]
- 32.Howden L, Meyer J. Age and Sex Composition: 2010. 2010 Census Briefs US Department of Commerce Economics and Statistics Administration. 2011 [Google Scholar]
- 33.Oreskovich MR, Howard JD, Copass MK. Geriatric trauma: injury patterns and outcome. Journal of Trauma and Acute Care Surgery. 1984;24(7):565–572. [PubMed] [Google Scholar]
- 34.Gubler K, Davis R, Koepsell T, Soderberg R, Maier R, Rivara F. Long-term survival of elderly trauma patients. Arch Surg. 1997;132(9):1010–1014. doi: 10.1001/archsurg.1997.01430330076013. [DOI] [PubMed] [Google Scholar]
- 35.Ayoung-Chee P, McIntyre L, Ebel B, Mack C, McCormick W, Maier R. Long-term outcomes of ground-level falls in the elderly. J Trauma Acute Care Surg. 2014;76(2):498–503. doi: 10.1097/TA.0000000000000102. discussion 503. [DOI] [PubMed] [Google Scholar]
- 36.Ayoung-Chee P, Rivara F, Weiser T, Maier R, Arbabi S. Beyond the hospital doors: Improving long-term outcomes for elderly trauma patients. J Trauma Acute Care Surg. 2015;78(4):837–843. doi: 10.1097/TA.0000000000000567. [DOI] [PubMed] [Google Scholar]
- 37.Sterling D, O’Connor J, Bonadies J. Geriatric falls: injury severity is high and disproportionate to mechanism. J Trauma. 2001;50(1):116–119. doi: 10.1097/00005373-200101000-00021. [DOI] [PubMed] [Google Scholar]
- 38.Bergeron E, Clement J, Lavoie A, Ratte S, Bamvita J, Aumont F, et al. A simple fall in the elderly: not so simple. J Trauma. 2006;60(2):268–273. doi: 10.1097/01.ta.0000197651.00482.c5. [DOI] [PubMed] [Google Scholar]
- 39.Grossman M, Miller D, Scaff D, Arcona S. When is an elder old? Effect of preexisting conditions on mortality in geriatric trauma. J Trauma. 2002;52(2):242–246. doi: 10.1097/00005373-200202000-00007. [DOI] [PubMed] [Google Scholar]
- 40.Morris JJ, MacKenzie E, Edelstein S. The effect of preexisting conditions on mortality in trauma patients. JAMA. 1990;263(14):1942–1946. [PubMed] [Google Scholar]
- 41.Perdue P, Watts D, Kaufmann C, Trask A. Differences in mortality between elderly and younger adult trauma patients: geriatric status increases risk of delayed death. J Trauma. 1998;45(4):805–810. doi: 10.1097/00005373-199810000-00034. [DOI] [PubMed] [Google Scholar]
- 42.Cryer C, et al. Empirical validation of the New Zealand injury prevention strategy indicators: the identification of ICD diagnoses associated with a high probability of inpatient hospital admission. Dunedin: Injury Prevention Research Unit; 2010. ISBN: 0-908958-83-8. [Google Scholar]
- 43.American Hospital Association. [Accessed 15 December 2015];Fast Facts on US Hospitals. http://www.aha.org/research/rc/stat-studies/fast-facts.shtml.
- 44.Branas CC, MacKenzie EJ, Williams JC, et al. Access to trauma centers in the US. JAMA. 2005;293(21):2626–2633. doi: 10.1001/jama.293.21.2626. [DOI] [PubMed] [Google Scholar]
- 45.MacKenzie E, Rivara F, Jurkovich G, Nathens A, Frey K, Egleston B, et al. A national evaluation of the effect of trauma-center care on mortality. N Engl J Med. 2006;354(4):366–378. doi: 10.1056/NEJMsa052049. [DOI] [PubMed] [Google Scholar]
- 46.Association ofAmerican Medical Colleges. [Accessed 15 December 2015];Key Facts About Teaching Hospitals. 2009 https://www.aamc.org/download/82452/data/keyfactsaboutth.pdf.
- 47.Committee on Trauma. Resources for Optimal Care of the Injured Patient: 2014. American College of Surgeons; [Accessed: 15 September 2015]. https://www.facs.org/~/media/files/quality%20programs/trauma/vrc%20resources/resources%20for%20optimal%20care%202014%20v11.ashx. [Google Scholar]
- 48.Hsia R, Shen Y. Rising closures of hospital trauma centers disproportionately burden vulnerable populations. Health Aff (Millwood) 2011;30(10):1912–1920. doi: 10.1377/hlthaff.2011.0510. [DOI] [PMC free article] [PubMed] [Google Scholar]
- 49.American College of Surgeons. [Accessed 19 December 2015];National Trauma Databank 2010, Annual Report. (Table 50) https://www.facs.org/~/media/files/quality%20programs/trauma/ntdb/ntdbannualreport2010.ashx.
- 50.Agency for Healthcare Research and Quality. [Accessed 19 December 2015];Introduction to the HCUP Nationwide Inpatient Sample (NIS) 2011 Available online. https://www.hcup-us.ahrq.gov/db/nation/nis/NIS_Introduction_2011.jsp.
- 51.Stevenson M, Segui-Gomez M, Lescohier I, Di Scala C, McDonald-Smith G. An overview of the injury severity score and the new injury severity score. Inj Prev. 2001;7(1):10–13. doi: 10.1136/ip.7.1.10. [DOI] [PMC free article] [PubMed] [Google Scholar]
- 52.Palmer C. Major trauma and the injury severity score--where should we set the bar? Annu Proc Assoc Adv Automot Med. 2007;51:13–29. [PMC free article] [PubMed] [Google Scholar]
- 53.Wong SS, Leung GK. Injury Severity Score (ISS) vs. ICD-derived Injury Severity Score (ICISS) in a patient population treated in a designated Hong Kong trauma centre. Mcgill J Med. 2008 Jan;11(1):9–13. [PMC free article] [PubMed] [Google Scholar]
- 54.Goble Sandra, et al. Creating a nationally representative sample of patients from trauma centers. Journal of Trauma and Acute Care Surgery 67.3. 2009:637–644. doi: 10.1097/TA.0b013e3181b84294. [DOI] [PubMed] [Google Scholar]
- 55.Phillips Bart, et al. Comparison of injury patient information from hospitals with records in both the national trauma data bank and the nationwide inpatient sample. Journal of Trauma and Acute Care Surgery 64.3. 2008:768–780. doi: 10.1097/TA.0b013e3181620152. [DOI] [PubMed] [Google Scholar]
- 56.Haider Adil H, et al. Influence of the National Trauma Data Bank on the study of trauma outcomes: is it time to set research best practices to further enhance its impact? Journal of the American College of Surgeons 214.5. 2012:756–768. doi: 10.1016/j.jamcollsurg.2011.12.013. [DOI] [PMC free article] [PubMed] [Google Scholar]
Associated Data
This section collects any data citations, data availability statements, or supplementary materials included in this article.


