

Abstract
Pembrolizumab, a humanized monoclonal antibody against programmed death 1 (PD‐1), has a manageable safety profile and robust clinical activity against advanced malignancies. The lowest effective dose for evaluation in further dose‐ranging studies was identified by developing a translational model from preclinical mouse experiments. A compartmental pharmacokinetic model was combined with a published physiologically based tissue compartment, linked to receptor occupancy as the driver of observed tumor growth inhibition. Human simulations were performed using clinical pharmacokinetic data, literature values, and in vitro parameters for drug distribution and binding. Biological and mathematical uncertainties were included in simulations to generate expectations for dose response. The results demonstrated a minimal increase in efficacy for doses higher than 2 mg/kg. The findings of the translational model were successfully applied to select 2 mg/kg as the lowest dose for dose‐ranging evaluations.
Study Highlights.
WHAT IS THE CURRENT KNOWLEDGE ON THE TOPIC?
☑ Pembrolizumab is a potent antibody against the cellular immune “switch” programmed death 1 (PD‐1), with high activity in the treatment of certain types of advanced cancer.
WHAT QUESTION DOES THIS STUDY ADDRESS?
☑ What is the lowest effective dose to be used in clinical studies with pembrolizumab?
WHAT THIS STUDY ADDS TO OUR KNOWLEDGE
☑ Quantification of the pharmacologic mode of action of pembrolizumab in mice and extrapolation to humans. Mechanistic explanation of the efficacious dose range in humans.
HOW MIGHT THIS CHANGE DRUG DISCOVERY, DEVELOPMENT, AND/OR THERAPEUTICS?
☑ The work demonstrates the opportunity provided by translational PKPD modeling to optimize dose setting in early clinical development in oncology.
The immune system has the ability to recognize and eliminate tumors. However, tumor cells often adapt and exploit innate protection mechanisms to avoid immune cell recognition.1, 2, 3 One such evasion mechanism involves the activation of inhibitory immune checkpoints such as those mediated by receptors like cytotoxic T‐cell‐associated antigen‐4 and programmed death 1 (PD‐1).2, 3, 4, 5 Pembrolizumab (MK‐3475) is a highly selective, humanized monoclonal immunoglobulin G 4 (IgG4)/kappa isotype antibody against PD‐1 designed to directly block the interaction between PD‐1 and its ligands, PD‐L1 and PD‐L2. This blockade enhances the functional activity of the targeted lymphocytes to facilitate tumor regression and, ultimately, immune‐mediated rejection.6 In the first‐in‐human, dose‐escalation portion of the large, multicohort KEYNOTE‐001 study, which evaluated pembrolizumab doses of 1, 3, and 10 mg/kg administered once every 2 weeks (Q2W), and 2 and 10 mg/kg once every 3 weeks (Q3W), no dose‐limiting toxicities were observed, and the overall safety profile was manageable.7 Antitumor activity was observed at all dosages.
With the arrival of more targeted anticancer therapies such as the immune checkpoint inhibitors, it has become critical to have an alternative to the maximum tolerated dose paradigm to establish the optimal dose regimen during clinical development. Lacking robust early biomarkers of efficacy, translational modeling and simulation of preclinical efficacy data have become a key tool in early establishment of the potential clinical dose range, since this effectively allows a model‐based “humanization” of syngeneic mouse data that otherwise are difficult to interpret from a clinical point of view. While such analyses involve critical assumptions, and inevitably are associated with uncertainties, they also provide a framework for backtranslation once initial clinical data have been obtained, thus optimizing the design of additional preclinical experiments that could help fill knowledge gaps encountered in the clinical space.
Thus, a key question when designing the melanoma8, 9, 10 expansion cohorts of KEYNOTE‐001 was which pembrolizumab dose range to evaluate. In the absence of predictive biomarkers and indication‐specific efficacy data as a result of the use of an all‐comers population during dose escalation, translational pharmacokinetic (PK)/pharmacodynamic (PD) analyses were performed to identify the lowest pembrolizumab dose that would have a high likelihood of maximal efficacy in these specific indications.
METHODS
Overview
The model structure is shown in Figure 1, illustrating the different model components:
Figure 1.
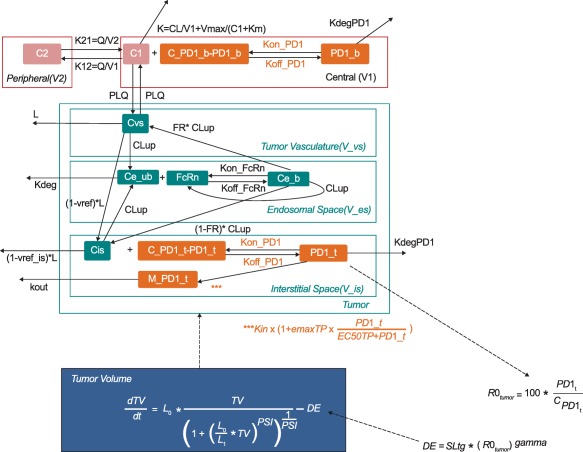
PK/PD model. Parameters are described in Table 1. State variables are abbreviated as follows: C1 = pembrolizumab concentration in the central compartment; C2 = pembrolizumab concentration in the peripheral compartment; PD‐1_b = pembrolizumab: PD‐1 complex; C_PD‐1_b = total PD‐1 receptor concentration in blood; Cvs = pembrolizumab concentration in the vasculature; Ce_ub = concentration of unbound pembrolizumab in the endosomal space; FcRn = Fc receptor levels; Ce_b = pembrolizumab:PD‐1 complex in the endosomal space; Cis = pembrolizumab concentrations in the interstitial space; C_PD‐1_t = total PD‐1 concentration in the tumor; C_PD‐1_b = total PD‐1 concentration in blood; PD‐1_t = pembrolizumab:PD‐1 complex in the tumor; PD‐1_b = pembrolizumab:PD‐1 complex in blood; M_PD‐1_t = amount of PD‐1 receptors in the tumor; Vmax = maximum elimination rate of the saturable pathway; V1 = volume of distribution in the central compartment; V2 = volume of distribution in the central compartment; Km = Michaelis–Menten constant; V_es = endosomal space of the vascular epithelial cells.
Empirical model for PK in plasma.
A physiologic tissue compartment based on the literature (Shah and Betts)11 and preclinical data represents the site of drug action (malignant tissue and surrounding tissue).
A mechanistic binding model describes drug action, taking into account in vitro receptor binding constants as well as a feedback loop, empirically developed using mouse data.
A tumor growth model (Simeoni et al.)12 describes tumor size, in which the drug–receptor complex inhibited tumor growth, and the tumor size determined the size of the tissue compartment.
The model was constructed using experimental data in mice and species‐specific published physiologic parameters. For dose–response simulations in humans, the model was translated by replacing mouse parameters with human parameters where possible, and, allometrically scaling mouse parameters, or keeping parameters constant, when human parameters were not known (flowchart in Figure S1).
Experimental data
Plasma concentration data from two preclinical studies in MC38 (colon adenocarcinoma) tumor‐bearing mice were combined for PK model development. Conventional xenograft models lack relevance for studying immunomodulating drugs because of the immunocompromised status of the animals. Hence, syngeneic (i.e., allograft) C57BL/6 mice with intact immune systems were used in the preclinical experiments. Since pembrolizumab does not crossreact with rodent PD‐1, mice received either a chimeric mouse or parental rat DX400 anti–PD‐1 antibody (details on surrogate antibodies in Supplementary Information). Dose levels ranged from 0.1 to 10 mg/kg administered intravenously on days 0, 7, and 14, with frequent blood sampling on days 0 and 4 with sparse sampling (Table S1). Plasma samples were analyzed for mouse or rat DX400 concentration using an enzyme‐linked immunosorbent assay. The minimum detectable concentration was 0.312 μg/mL for mouse DX400 and 0.100 μg/mL for rat DX400.
Receptor occupancy was measured in blood and tumor in MC38‐bearing mice receiving vehicle or 0.1, 0.4, 1.4, or 5 mg/kg of rat DX400 on days 0 and 4 using a fluorescence‐based assay.
Tumor volume was assessed in MC38‐bearing mice receiving vehicle or 0.1, 0.4, 1.4, or 5 mg/kg of rat DX400 on days 0 and 4. Two perpendicular tumor diameters were measured at baseline and on days 1, 4, 5, 8, 12, and 15 using digital calipers (0.01 mm accuracy). Tumor volume was calculated using the ellipsoidal volume formula (0.5 × smallest diameter2 × largest diameter).
Mouse PK and PK/PD model development and qualification
Details of model development are included in the Supplementary Information. Qualification of the mouse PK/PD model was achieved by performing external visual predictive checks (VPCs) using a separate test dataset. Within this test dataset, individual tumor size data were available from mice receiving vehicle or 0.1, 0.4, 1.4, or 5 mg/kg mouse DX400 on days 0, 5, 9, 13, and 17. Further details of the design are provided in Table S1. The mouse PK/PD model was used to simulate (with parameter uncertainty from bootstrap analysis) the time course of tumor volume under the experimental design of the test dataset. Baseline tumor sizes between the studies were adjusted for and VPCs were performed to compare simulated tumor volumes (80% confidence interval [CI] around median prediction) to observed tumor volumes. The datasets for model building and testing used the rat and mouse DX400 antibodies, respectively. Given the lack of significant systematic differences in PK between the two antibodies, the test dataset was considered appropriate for the purpose of model qualification.
Internal qualification was also performed for the mouse PK and PK/PD models using VPCs. A 90% CI around the median prediction was generated using 1,000 simulations. Since the simulations focused on predicting the typical response in a population, assessment of interindividual variability was not relevant for the VPCs and only the observed and predicted medians were compared. Bootstrap analysis was used to assess the precision of the parameter estimates (N = 200 replicates). The bootstrapped parameter vectors were also used to obtain uncertainty for simulations.
Translation of model parameters from mouse to human
The PK model in mice was replaced by a two‐compartment model describing the human PK of pembrolizumab (see companion article by Elassaiss‐Schaap).13 Parameters describing the generic distribution kinetics of monoclonal antibodies in human tumor tissue are listed in Table 1 and illustrated in Figure 1, along with those for mouse tumor tissue.11 Most parameters for the tumor tissue are expressed per unit tissue volume (e.g., tumor plasma flow) or reported as unitless fractions (e.g., endosomal, interstitial, and vascular space volumes of the tumor as fractions of the total tumor volume). Assuming the proportion of volumes of the tumor subcompartments and the blood and lymph flows relative to the total tumor volume are constant across species and tumor entities, these parameters were kept constant during translation.
Table 1.
Parameters of the mouse and human PK/PD models
| Parameter | Units | Description | Value in mouse | Value in man[Link] | Source | Assumptions for mouse‐to‐man translation/remarks |
|---|---|---|---|---|---|---|
| Plasma PK | ||||||
| V1 | mL | Volume of the central (blood) compartment | 1.26 | 2877 | Estimated | Actual human PK used |
| V2 | mL | Volume of the peripheral compartment | 0.819 | 2854 | Estimated | Actual human PK used |
| Q | mL/day | Distribution clearance | 4.82 | 384 | Estimated | Actual human PK used |
| Vmax | μg/day | Maximal rate of nonlinear elimination | 0.518 | 114 | Estimated | Actual human PK used |
| KM | μg/mL | KM value of nonlinear elimination | 0.366 | 0.078 | Estimated | Actual human PK used |
| CL | mL/day | Linear clearance | 0.334 | 167 | Estimated | Actual human PK used |
| Target PK and PD | ||||||
| V_tot | μL | Total tumor volume | Same as W0 | — | Estimated in mouse/literature in man | — |
| V_es | % | Endosomal volume | 0.5% of V_tot | — | Shah et al.12 | Constant across species |
| V_is | % | Interstitial volume | 55% of V_tot | — | Shah et al.12 | Constant across species |
| V_vs | % | Vascular space volume | 7% of V_tot | — | Shah et al.12 | Constant across species |
| PLQ | L/h/L | Tumor plasma flow per volume of tissue | 12.7 | — | Shah et al.12 | Constant across species |
| L | % | Lymph flow | 0.2% of plasma flow | — | Shah et al.12 | Constant across species |
| CLup | L/h/L | Rate of pinocytosis per unit endosomal space | 0.0366 | — | Shah et al.12 | Constant across species |
| Kdeg | 1/h | Degradation of free antibody from the endosomal space | 42.9 | — | Shah et al.12 | Constant across species |
| v_ref | — | Vascular reflection coefficient | 0.842 | — | Shah et al.12 | Constant across species |
| v_ref_is | — | Lymph reflection coefficient | 0.2 | — | Shah et al.12 | Constant across species |
| FcRni | μM | Initial FcRn concentration in endosomal space | 49.8 | — | Shah et al.12 | Constant across species |
| FR | — | Fraction of FcRn recycled to vascular space | 0.715 | — | Shah et al.12 | Constant across species |
| Kon_FcRn | 1E6/M/h | Association rate constant of FcRn binding | 80.6 | 792 | Shah et al.12 | — |
| Koff_FcRn | 1/h | Dissociation rate constant of FcRn binding | 6.55 | 23.9 | Shah et al.12 | — |
| N_Tcell | — | Number of T cells per microliter of blood | 1000 | — | Human normal value: www.merckmanuals.com | CD4+ count of 640‐1175/μL is reported for human and assumed to be the same in mouse in the absence of data |
| N_PD‐1_TC | — | Number of PD‐1 receptors per T cell | 10000 | — | Assumed | Constant across species |
| Tmulti | — | Initial ratio of target concentration in tumor vs. blood | 4.3 | — | Estimated | Constant across species |
| EMAXTP | — | Maximal increase in target production | 94.7 | — | Estimated | Constant across species |
| EC50TP | nM | Concentration of target‐receptor complex at half‐maximal induction of target production | 1.46 | — | Estimated | Constant across species |
| Kon_PD‐1 | 1E6/M/h | mAb–PD‐1 association rate constant | 340 | 2880 | In vitro value for DX400 (mouse) and pembrolizumab (man) | NA |
| Koff_PD‐1 | 1/h | mAb–PD‐1 dissociation rate constant | 0.106 | 0.144 | In vitro value for DX400 (mouse) and pembrolizumab (man) | NA |
| KdegPD‐1 | 1/h | Degradation of antibody–target complex (internalization, T‐cell death) | 0.0194 | 0.00246 | Estimated | Allometrically scaled |
| Tumor growth submodel | ||||||
| L0 | 1/day | Exponential growth rate | 0.113 | See Table S3 | Estimated in mouse/scaled in human | See supplemental material |
| L1 | μL/day | Linear growth | 187 | See Table S3 | Estimated in mouse/scaled in human | See supplemental material |
| W0 | μL | Baseline tumor volume at start of treatment | 170 | See Table S3 | Estimated in mouse/literature in human | See supplemental material |
| SLtg | %/day | Slope of drug effect on tumor kill rate | 1.98E‐05 | See Table S3 | Estimated in mouse/scaled in human | See supplemental material |
| gamma | — | Exponent of the power‐function of the drug effect | 2.3 | — | Estimated | Constant across species |
aIf different from the mouse value.
The parameter describing the rate of disappearance (degradation/elimination/internalization) of the antibody‐target complex (KdegPD‐1) was estimated in mice and allometrically scaled to humans based on body weight and the standard allometric exponent for rate constants (−0.25)14:
A standard body weight of 20 g and 70 kg was assumed for mice and humans, respectively. The association (Kon_FcRn) and dissociation (Koff_FcRn) constants of IgG‐like antibody binding to the FcRn receptor in human tissue were taken from the literature.11 The concentration of FcRn receptors in the endosomal space of the tumor was assumed to be the same in mouse and human.
The association (Kon_PD‐1) and dissociation (Koff_PD‐1) constants describing the binding of pembrolizumab to the human PD‐1 receptor were derived from in vitro experiments (Merck, data on file). These values replaced the rat DX400 binding parameters.
Fast, medium, and slow growth rates for melanoma lesions were derived from the literature.15, 16, 17, 18 Algebraic conversions were used to derive exponential growth rates (Supplementary Information). Only exponential growth patterns (L0) are reported for melanoma; therefore, an exponential (and not linear) growth was applied for the melanoma simulations in human. The initial tumor volume at the start of treatment was derived from Chiu and Ouellet,15 who reported a median baseline tumor size (sum of the longest diameters) of 64 mm. The one‐dimensional diameter was converted to volume according to an approach described by Elassaiss‐Schaap13 (details in Supplementary Information).
Two approaches were used to scale the slope parameter (SLtg) that relates receptor occupancy to tumor shrinkage. Allometric scaling assumes that factors leading to a decline in tumor size are related to a body‐size‐dependent mechanism (e.g., blood flow):
Tumor shrinkage proportional to tumor growth in melanoma (L0) assumes that the same factors that determine the growth difference between humans and mice also determine the rate of tumor shrinkage (drug effect being equal):
The two assumptions regarding determination of kill rate differences between mouse and man—body size and growth rate—were used in simulations as different and equally weighted scenarios. A summary of the final parameters used for different scenarios is shown in Table 1.
Dose–response simulations in humans
Dose–response simulations and sensitivity analyses were conducted in MatLab v. 7.9.0 and 7.14.0.739 (MathWorks, Natick, MA). Based on the results of the sensitivity analysis, and to explore the impact of the wide range of tumor growth rates as observed in the literature,15, 16, 17, 18 six scenarios were simulated (slow‐, medium‐, fast‐growing tumor, with either an allometrically scaled or a growth‐proportional shrinkage parameter). Human PK parameters were taken directly from the bootstrap results of the previously developed human PK model (see companion article by Elassaiss‐Schaap).13 Estimated parameters of the mouse PK/PD model that were assumed to be species invariant were taken from the bootstrap results of the mouse PK/PD model.
Uncertainty from the mouse parameters for melanoma growth rate (L0) and initial tumor volume (W0) were propagated to the human parameter by multiplying the human parameter with the corresponding mouse parameter, normalized by the original estimate:
Simulations were performed for pembrolizumab doses between 0.1 and 10 mg/kg Q2W and Q3W. The tumor volume at 0, 1, 3, and 6 months was predicted and converted back to the one‐dimensional scale (i.e., length) assuming a sphere, and the percentage change from baseline in tumor size was calculated for each replicate in each scenario. The results were summarized graphically as change from baseline vs. dose curves for each scenario at the postbaseline evaluation timepoints.
To provide an overall assessment of the dose–response relationship across scenarios, the predicted change from baseline in tumor size was also categorized in a manner similar to RECIST v. 1.1.19 Progressive disease was defined as a >20% increase in tumor size from baseline, stable disease as a <20% increase or a <10% decrease, intermediate response as a >10% but <30% decrease, partial response as a >30% but <50% decrease, and major response as a >50% decrease. The probability of response was computed for each dose level and visualized in a stacked bar diagram by taking the number of simulated replicates (i.e., simulations were binned and counted without averaging) falling in a certain category at 0, 1, 3, and 6 months over the total number of simulations (irrespective of scenario). All scenarios were assumed to have the same likelihood.
Sensitivity analysis
A sensitivity analysis was performed to determine the effect of any single parameter on change in tumor volume for 0.5‐ and 5‐mg/kg doses. Each parameter was individually varied between 5‐fold lower or 5‐fold higher values around the estimated value. The percentage change from baseline in tumor volume at 26 weeks was the main response variable. The magnitude of the effect of parameter changes on tumor volume was explored for both doses.
RESULTS
Experimental data
Mouse or rat DX400 concentration data were available for 276 of the 316 mice (a single sample per individual) for development of the PK model. The concentration was below the limit of quantification for 40 samples, which were not considered further (Table S1). Receptor occupancy in blood and tumor tissue and tumor volume were measured in 150 mice in the primary PD experiment. An additional 125 tumor volume measurements were obtained from 25 different mice for external validation (Table S1).
Mouse PK and PK/PD model development and qualification
Mouse PK model
A two‐compartment model best described the plasma PK of the rat and mouse DX400 antibodies, including two parallel elimination pathways from the central compartment: linear elimination and a saturable Michaelis–Menten‐type elimination.
Parameter estimates obtained with the model were reasonably precise, and the VPC showed an adequate description of the data (Table S2 and Figure S2a). The goodness‐of‐fit plots shown in Figure S2b may suggest a modest underprediction of the murine DX400 data and a minor overprediction of the rat DX400 data in the higher concentration range. Overall, however, the results demonstrate that it is reasonable to assume that the PK of both versions of the antibody are sufficiently similar for the purpose of the model.
Mouse PK/PD model
The final model structure for the mouse PK/PD model was obtained by combining the mouse PK model, a published physiologically based PK model,11 the receptor binding model, and the tumor growth model. Inclusion of a hyperbolic feedback representing the PD‐1 increase associated with T‐cell upregulation significantly improved the model fit (difference in objective function value (OFV) of −134.1, with two additional parameters, compared with the model without a feedback mechanism). In a final step, the three transit compartments of damaged cells from the original tumor growth model12 were removed without significantly worsening the OFV—now effectively resembling a Gompertz‐type model.20 The parameters used in the final model are detailed in Table 1. Figure 1 shows the schematic of the final PK/PD model. The set of differential equations describing the structural model and the parameter estimates is provided in the Supplementary Information and in Table S2. The final integrated PK‐receptor occupancy‐tumor growth model adequately captured the tumor size over time for the animals responding to treatment (i.e., reduced tumor growth), as demonstrated by the internal VPC (Figure 2 a). The external VPC (Figure S3) demonstrates that unperturbed tumor growth in the animals receiving vehicle and the dose‐dependent tumor growth inhibition in those animals that responded to treatment was reasonably characterized. Some animals in the 0.4‐ to 5‐mg/kg groups only responded very poorly to treatment, showing profiles of almost unperturbed growth. These nonresponding animals cannot be described by the model.
Figure 2.
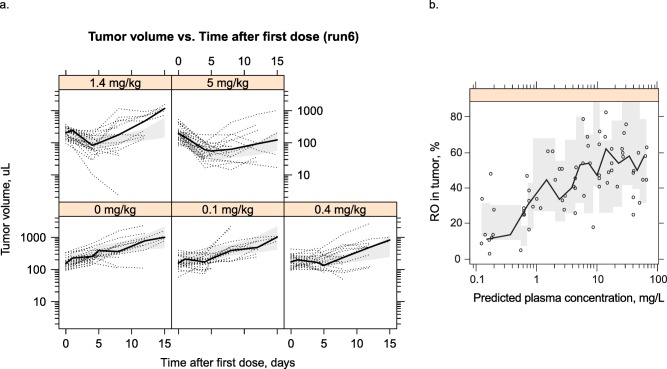
(a) Visual predictive check of tumor volume. Black circles: observations; black line: median of observations; gray area: 90% confidence interval of the median prediction. (b) Receptor occupancy (RO) in tumor vs. plasma concentration of DX400 plotted on a logarithmic scale. Symbols: observations; black line connects median of observations in each bin; shaded gray area: 90% confidence interval around the median prediction.
The receptor occupancy in the tumor increased with an increase in antibody concentration, and appeared to approach a maximum at ∼60% occupancy (Figure 2 b). The model was able to characterize these behaviors very well. Because of random noise in the assay, >100% occupancy was observed. This was accounted for by an exponential residual error model (CV%: 62). Consistent with theory, the individual predicted or population predicted receptor occupancy in blood did not exceed 100%.
Dose–response simulations in humans
To simulate the reduction in tumor size in humans following pembrolizumab treatment, model parameters were translated by replacing mouse parameters with human parameters (e.g., PK parameters; Table 1), allometrically scaling mouse parameters (e.g., KdegPD‐1), or keeping parameters constant across species (e.g., EMAXTP, EC50TP). Five of the six scenarios performed consistently; the simulation incorporating a slow tumor growth rate and growth‐proportional scaling of the kill rate had the smallest rate of tumor shrinkage, leading to the lowest tumor reduction at steady state (Figure 3 a).
Figure 3.
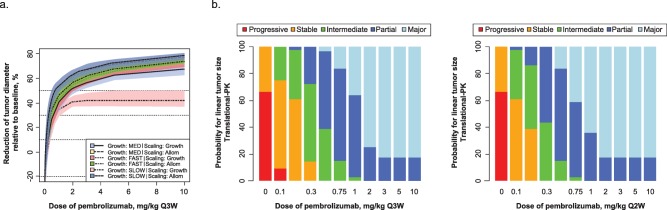
(a) Simulated tumor response in melanoma (percentage change from baseline diameter) following treatment with pembrolizumab (once every 3 weeks) over 6 months for the six scenarios for melanoma using the fast, medium (MED), and slow growth rates, scaled using two different methods each (see Methods for details). Confidence intervals per scenario are derived on the basis of bootstrap analysis and represent the uncertainty for a typical individual. Allom, allometric. (b) Probability of tumor response of a certain size in melanoma. For each dose level, Monte Carlo simulations were performed taking into account the uncertainty in model parameters, as well as uncertainty in the scaling of the tumor growth/shrinkage. The change from baseline for each simulation replicate was categorized in a manner analogous to RECIST v1.1 (left panel, Q3W; right panel, Q2W).
The probabilities of achieving a reduction in tumor size within the predefined response categories are shown in Figure 3 b. The probability of achieving a >30% reduction in tumor size reached a plateau for doses ≥2 mg/kg Q3W. There was a reduced probability of achieving a >30% reduction at lower doses. Minimal incremental benefit was seen in simulations of Q2W vs. Q3W dosing. The slightly higher response predicted for the Q2W schedule, particularly at lower doses, could be attributable to the 1.5‐fold higher total dose administered over the same time interval (i.e., the total dose over a 6‐month period would be 12 mg/kg for pembrolizumab 1 mg/kg Q2W vs. 8 mg/kg for 1 mg/kg Q3W).
Sensitivity analysis
A sensitivity analysis was performed to determine the effect of any single parameter on change in tumor volume for the 0.5‐ and 5‐mg/kg doses. Parameter values were changed over a wide range of 0.2× to 5× to explore the effect of uncertainty in parameter estimation, biology, experimental measurements, and translation. The effect of the 16 most sensitive parameters on change from baseline in tumor volume at 26 weeks is summarized in Figure 4. Model predictions were the most sensitive to changes in parameters related to the effect of drug on tumor volume (gamma, SLtg); tumor growth (L0); the fraction of FcRn recycled in the vascular space (FR); the number of targets/receptors available in blood (N_Tcell, N_PD‐1_TC, V_blood) and tumor (Tmulti); and the ability of the complex to positively regulate PD‐1 production (EMAXTP). For most parameters, the magnitude of change in tumor volume was larger for parameter perturbations at 0.5 mg/kg compared with 5 mg/kg, implying that there is higher sensitivity in the model at the lower dose. Parameters with the highest sensitivity for 5 mg/kg, but not 0.5 mg/kg, included SLtg, L0, and FR. The magnitude of change in tumor volume for these parameters was comparable for both doses.
Figure 4.
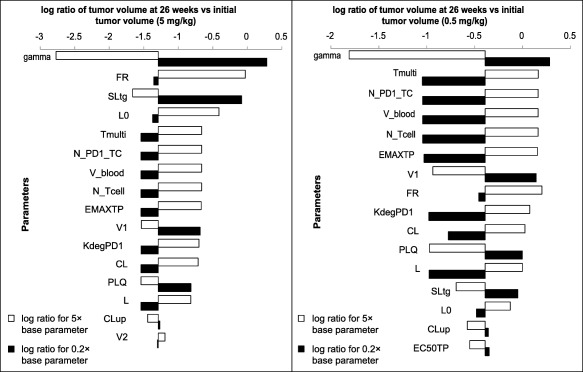
Tornado plot showing the top 16 parameters that have the greatest effect on percentage change from baseline in tumor volume at 26 weeks either with 5× or 0.2× the base parameter value for the 5 mg/kg (left) and 0.5 mg/kg (right) doses. The values plotted are the log (base 10) ratio of the tumor volume at 26 weeks vs. the initial tumor volume, so that negative values represent reduction in tumor volume. For the 0.5‐mg/kg dose, the y axis crosses the x axis at −0.39, which is the log ratio for the baseline parameter values. Similarly, for the 5‐mg/kg dose, the y axis crosses the x axis at −1.29, which is the log ratio for the base parameter values.
For the 5‐mg/kg dose, the parameter gamma can push the system toward tumor growth rather than regression. Gamma relates to the scale of the tumor‐volume‐reducing effect of pembrolizumab; therefore, changes in gamma can result in a reduced drug effect and an increase in tumor volume. No other single parameter can lead to this switch from tumor regression to tumor growth within the boundaries tested. Note that gamma was estimated relatively precisely in the mouse model (80% CI: 1.79–2.85). Although the true value of gamma in humans is unknown, the 5‐fold decrease tested in the sensitivity analysis that would render the drug ineffective likely represents an extreme case.
While the model was sensitive to parameters related to target engagement and PD‐1 upregulation, it was insensitive to other parameters. Of note, the initial tumor volume (W0) and the binding rate constants (Kon_PD‐1, Koff_PD‐1, Kon_FcRn, and Koff_FcRn) had a minimal effect on the change in tumor volume within the range tested.
DISCUSSION
The mechanism of action of the anti–PD‐1 antibody involves a complex interplay of receptor binding, target engagement, and positive feedback mechanisms.21 Integrating information from preclinical and clinical experiments and the literature to gain insight into this mechanism and to inform the likely effective dose range in humans is challenging. A translational model was developed based on known biological mechanisms that successfully described experimental data and provided meaningful insights to aid dose selection for clinical trials of pembrolizumab.
The overall fit of the mouse PK/PD model was adequate, with the tumor growth profiles of most animals captured by the median pattern. Predictions from external model qualification also adequately described the general tendency of tumor regression for animals that responded well to the treatment. A greater proportion of animals in the qualification dataset were less sensitive to growth inhibition than in the training dataset. The differences between experimental and model results may be related to interexperimental variability. Alternatively, they may be related to slight differences between the original rat chimeric DX400 antibodies used in the original dataset and the chimeric mouse DX400 antibodies used in the external qualification experiment, although no relevant differences in PK between the two antibodies were evident from the goodness‐of‐fit plots.
The model was developed to closely follow the current knowledge of the mechanism of action of pembrolizumab, which blocks the PD‐1 checkpoint pathway of cytotoxic T cells. Some related parameters had wide confidence intervals (e.g., SLtg, EMAXtp, Tmulti) and were correlated with each other (SLtg∼gamma; EMAXtp∼Tmulti). Attempts to reduce the complexity of the model by eliminating these parameters resulted in deterioration of the model fit. The model including receptor dynamics was adopted for human extrapolation.
To account for the “biological” uncertainty in the translation of drug efficacy across species, a mechanistic approach was undertaken and the pathway between dosing and efficacy was divided into manageable discrete steps: blood exposure (PK), tumor disposition, target binding, target dynamics, disease progression, and disease intervention. Human equivalents or parameters were used where possible to replace mouse counterparts in the model. Scaling factors were applied for some parameters for which the human value was unknown. The use of different scenarios for the different scaling methods ensured coverage of identified plausible biological hypotheses regarding the mouse–human extrapolation in the final results.
Integration of the translational approaches to allow for the biological uncertainty regarding cross‐species translation of drug efficacy resulted in three main assumptions that must be considered when interpreting the results. First, the tumor volume and tumor growth rate in humans derived from multiple literature sources are relevant and applicable to our specific population and tumor type. Second, the tumor microenvironment is comparable between species, and the parameters associated with the microenvironment can be used directly for the human model. Third, the target dynamics, including the impact of T‐cell proliferation on target expression, are assumed to be similar between humans and mice. Sensitivity analysis was performed to explore how changes in parameters based on these assumptions might affect the overall simulation results, as well as to cover cases in which biological uncertainty on a parameter (i.e., “unknown unknown”) is greater than the uncertainty identified mathematically. The sensitivity analysis showed that, overall, the model is more sensitive to parameter changes at the lower dose of 0.5 mg/kg compared with 5 mg/kg. For both doses, the model was most sensitive to gamma, an important parameter for determining the relationship between receptor occupancy in the tumor and tumor growth inhibition. The other parameters that had an effect on tumor volume at 26 weeks could be broadly separated into those directly related to tumor growth (SLtg and L0) and those that affect receptor number and engagement (EMAXTP, Tmulti, and N_PD‐1_TC).
PD‐1 receptor occupancy is modeled in the tissue compartment associated with tumor, indicating that the pathway leading to antitumor activity is effectively saturated at clinically relevant pembrolizumab concentrations. While PD‐1 is expressed in all tissues, immune evasion by cancer cells is a local process associated with ligand (PD‐L1) expression in tumors.22 The model therefore drives efficacy through pembrolizumab exposure to T cells in the local environment. The concentration of PD‐1 receptors in blood and tissue is not known, and hence an assumption had to be made on the number of PD‐1 receptors on T cells (N_PD‐1_TC). It is not surprising that the model is sensitive to this and related parameters, as they all determine the target concentration. The model is sufficiently robust that a 5‐fold higher PD‐1 receptor abundance would still lead to a meaningful antitumor efficacy, indicating that the pathway leading to antitumor activity is effectively saturated at clinically relevant pembrolizumab concentrations.
Interestingly, the rate constants for pembrolizumab binding to the PD‐1 receptor had little or no effect within the ranges tested. This suggests that the binding affinity of the antibody is sufficiently potent that increasing or decreasing it by 5‐fold does not affect receptor engagement. Such relative insensitivity to changes in antibody affinity has been described previously.23
Supported by the results from the sensitivity analysis, the effect of various tumor growth scenarios over a range of doses to predict tumor growth inhibition behavior were explored. Overall, the simulations suggest that the lowest dose regimen of pembrolizumab achieving a maximal response would be 2 mg/kg Q3W, with the probability of tumor size reduction only slightly lower, at 1 mg/kg Q3W. The sensitivity to parameter change, as a reflection of biological uncertainty, is higher with the low range of doses investigated, reinforcing a focus on the high end of responses in our results.
Different tumor types are also associated with different aggressiveness and growth rates. Some changes with a lower growth rate were shown in simulations. Low‐growth scenarios had a significant impact exclusively in the allometric scaling scenario; outcomes were still consistent with observed drug effect and would not have led to selection of a different dose. Additional simulations representing a different tumor type were performed and resulted in very similar dose–response patterns (data not shown). Taken together, with the target being localized on normal T cells, it is concluded that the results are very likely to be generalizable to other solid tumor types. Moreover, the cell line used in mice was not melanoma‐specific but was selected for its immune‐system blockade and, therefore, also supports extrapolations to different malignancies.
Potentially inefficacious doses should be avoided when designing trials for patients with advanced malignancies, even at the expense of lower tolerability. The aim of this work was thus to identify the lowest clinical dose with a high probability of reducing tumor size by ≥30%, equivalent to the RECIST definition of partial response,19 across a wide range of scenarios. A 2‐mg/kg Q3W dose consistently met this threshold, supporting selection of that dose as the lowest for formal efficacy evaluation in clinical trials. Randomized comparisons of pembrolizumab dose levels10, 24 have confirmed the activity of 2 mg/kg Q3W, and exposure–response analysis demonstrates that 2‐ and 10‐mg/kg doses are clinically equivalent with respect to their ability to reduce tumor size.25 The shallow exposure–response relationship was not significant given the dose range studied in the clinical trial (see companion article by Chatterjee), further supporting 2 mg/kg Q3W as the lowest dose at the plateau in efficacy.
The integrated translational framework presented here successfully combined mechanistic and empirical elements. Where informed by data or the literature, a mechanistic solution was pursued, focusing on the specific process considered critical for the prediction of clinical efficacy. The sensitivity analyses have provided further insight into the key contributing factors for clinical tumor response. While not the first example of translational predictions of tumor size effects from mice to men,26 we believe that the current explorations add important components (such as tumor distribution, target binding) that enhance the utility and applicability of this framework, or components thereof, for future use in the development of other targeted anticancer treatments.
In conclusion, the translational model captures the dynamics of tumor inhibition by pembrolizumab, together with its biological and mathematical uncertainty. The expected dose–response relationship of pembrolizumab in patients supported 2 mg/kg Q3W as the lowest maximally efficacious dose for clinical trials assessing the efficacy and safety of pembrolizumab.
Supporting information
Supporting Information
Supporting Information
Supporting Information
Supporting Information
Supporting Information
Supporting Information
Supporting Information
Supporting Information
Acknowledgments
A Lindauer is currently employed at SGS Exprimo NV, Mechelen, Belgium; V Sriram is currently employed at Gilead Sciences, Foster City, California, USA; R de Greef is currently employed at Quantitative Solutions, a Certara Company, Oss, Netherlands; J Elassaiss‐Schaap is currently employed at PD‐value, Houten, Netherlands. We thank Joe Phillips and Ruban Mangadu of Merck & Co., Inc. (Kenilworth, NJ) for scientific input and technical support, and Roger Dansey of Merck & Co., Inc. (Kenilworth, NJ), for critical review of the article. Medical writing and editorial support in the preparation of this article was provided by Jacqueline Kolston, PhD, and Melanie Leiby, PhD (The ApotheCom Merck oncology team, Yardley, PA), and was funded by Merck & Co., Inc. (Kenilworth, NJ).
Author Contributions
A.L., D.P.D.A., C.R.V., K.M., and J.E‐S. wrote the article; V.S. and J.E‐S. designed the research; V.S. and J.E‐S. performed the research; A.L., C.R.V., K.M., V.S., R.dG., and J.E‐S. analyzed the data.
Conflict of Interest
All authors are employees of the stated companies. Dr. Lindauer reports personal fees from Merck Sharpe and Dohme during the conduct of the study; Dr. Valiathan has nothing additional to disclose; Khamir Mehta holds stock in Merck & Co.; Dr. Sriram has nothing additional to disclose; Dr. de Greef reports personal fees from Merck & Co. during the conduct of the study; Dr. Elassaiss‐Schaap reports personal fees from Merck & Co. during the conduct of the study and after leaving started an independent consultancy company as indicated in the acknowledgments; Dr. De Alwis has nothing additional to disclose.
References
- 1. Drake, C.G. , Jaffee, E. & Pardoll, D.M. Mechanisms of immune evasion by tumors. Adv. Immunol. 90, 51–81 (2006). [DOI] [PubMed] [Google Scholar]
- 2. Pardoll, D.M. The blockade of immune checkpoints in cancer immunotherapy. Nat. Rev. Cancer 12, 252–264 (2012). [DOI] [PMC free article] [PubMed] [Google Scholar]
- 3. Ribas, A. Tumor immunotherapy directed at PD‐1. N. Engl. J. Med. 366, 2517–2519 (2012). [DOI] [PubMed] [Google Scholar]
- 4. Disis, M.L. Immune regulation of cancer. J. Clin. Oncol. 28, 4531–4538 (2010). [DOI] [PMC free article] [PubMed] [Google Scholar]
- 5. Hodi, F.S. et al Improved survival with ipilimumab in patients with metastatic melanoma. N. Engl. J. Med. 363, 711–723 (2010). [DOI] [PMC free article] [PubMed] [Google Scholar]
- 6. Gangadhar, T.C. & Salama, A.K. Clinical applications of PD‐1‐based therapy: a focus on pembrolizumab (MK‐3475) in the management of melanoma and other tumor types. Onco Targets Ther. 8, 929–937 (2015). [DOI] [PMC free article] [PubMed] [Google Scholar]
- 7. Patnaik, A. et al Phase I study of pembrolizumab (MK‐3475; anti‐PD‐1 monoclonal antibody) in patients with advanced solid tumors. Clin. Cancer Res. 21, 4286–4293 (2015). [DOI] [PubMed] [Google Scholar]
- 8. Daud, A. et al Long‐term efficacy of pembrolizumab (pembro; MK‐3475) in a pooled analysis of 655 patients (pts) with advanced melanoma (MEL) enrolled in KEYNOTE‐001. J. Clin. Oncol. 33, abstract 9005 (2015). [Google Scholar]
- 9. Hamid, O. et al Safety and tumor responses with lambrolizumab (anti‐PD‐1) in melanoma. N. Engl. J. Med. 369, 134–144 (2013). [DOI] [PMC free article] [PubMed] [Google Scholar]
- 10. Robert, C. et al Anti‐programmed‐death‐receptor‐1 treatment with pembrolizumab in ipilimumab‐refractory advanced melanoma: a randomised dose‐comparison cohort of a phase 1 trial. Lancet 384, 1109–1117 (2014). [DOI] [PubMed] [Google Scholar]
- 11. Shah, D.K. & Betts, A.M. Towards a platform PBPK model to characterize the plasma and tissue disposition of monoclonal antibodies in preclinical species and human. J. Pharmacokinet. Pharmacodyn. 39, 67–86 (2012). [DOI] [PubMed] [Google Scholar]
- 12. Simeoni, M. et al Predictive pharmacokinetic‐pharmacodynamic modeling of tumor growth kinetics in xenograft models after administration of anticancer agents. Cancer Res. 64, 1094–1101 (2004). [DOI] [PubMed] [Google Scholar]
- 13. Elassaiss‐Schaap, J. Allometric scaling in oncology disease progression from xenograft tumor growth to human non‐small‐cell lung cancer. 19th Annual Meeting of the Population Approach Group in Europe June 8–11; Berlin, Germany; 2010.
- 14. West, G.B. , Woodruff, W.H. & Brown, J.H. Allometric scaling of metabolic rate from molecules and mitochondria to cells and mammals. Proc. Natl. Acad. Sci. U. S. A. 99 (suppl. 1), 2473–2478 (2002). [DOI] [PMC free article] [PubMed] [Google Scholar]
- 15. Chiu, J. & Ouellet, D. Exposure‐response analysis of the effect of trametinib, a MEK inhibitor, on tumor size in patients with V600 BRAF mutation positive melanoma. J. Pharmacokinet. Pharmacodyn. 40, S115 (2013). [Google Scholar]
- 16. Kusama, S. , Spratt, J.S., Jr. , Donegan, W.L. , Watson, F.R. & Cunningham, C. The cross rates of growth of human mammary carcinoma. Cancer 30, 594–599 (1972). [DOI] [PubMed] [Google Scholar]
- 17. Liu, W. et al Rate of growth in melanomas: characteristics and associations of rapidly growing melanomas. Arch. Dermatol. 142, 1551–1558 (2006). [DOI] [PubMed] [Google Scholar]
- 18. Tejera‐Vaquerizo, A. et al Chronology of metastasis in cutaneous melanoma: growth rate model. J. Invest. Dermatol. 132, 1215–1221 (2012). [DOI] [PubMed] [Google Scholar]
- 19. Eisenhauer, E.A. et al New response evaluation criteria in solid tumours: revised RECIST guideline (version 1.1). Eur. J. Cancer 45, 228–247 (2009). [DOI] [PubMed] [Google Scholar]
- 20. Ribba, B. et al A review of mixed‐effects models of tumor growth and effects of anticancer drug treatment used in population analysis. CPT Pharmacometrics Syst. Pharmacol. 3, e113 (2014). [DOI] [PMC free article] [PubMed] [Google Scholar]
- 21. Okazaki, T. , Chikuma, S. , Iwai, Y. , Fagarasan, S. & Honjo, T. A rheostat for immune responses: the unique properties of PD‐1 and their advantages for clinical application. Nat. Immunol. 14, 1212–1218 (2013). [DOI] [PubMed] [Google Scholar]
- 22. Dolan, D.E. & Gupta, S. PD‐1 pathway inhibitors: changing the landscape of cancer immunotherapy. Cancer Control 21, 231–237 (2014). [DOI] [PubMed] [Google Scholar]
- 23. Agoram, B.M. , Martin, S.W. & van der Graaf, P.H. The role of mechanism‐based pharmacokinetic‐pharmacodynamic (PK‐PD) modelling in translational research of biologics. Drug Discov. Today 12, 1018–1024 (2007). [DOI] [PubMed] [Google Scholar]
- 24. Ribas, A. et al Pembrolizumab vs. investigator‐choice chemotherapy for ipilimumab‐refractory melanoma (KEYNOTE‐002): a randomised, controlled, phase 2 trial. Lancet Oncol. 16, 908–918 (2015). [DOI] [PMC free article] [PubMed] [Google Scholar]
- 25. Chatterjee, M.S. , Turner, D.C. , Dong, D. , Ahamadi, M. , De Alwis, D.P. & Kondic, A. Model‐based analysis of the relationship between pembrolizumab exposure and response in melanoma. 6th American Conference on Pharmacometrics October 3–9; Arlington, VA; 2015.
- 26. Simeoni, M. , De Nicolao, G. , Magni, P. , Rocchetti, M. & Poggesi, I. Modeling of human tumor xenografts and dose rationale in oncology. Drug Discov. Today Technol. 10, e365–e372 (2013). [DOI] [PubMed] [Google Scholar]
Associated Data
This section collects any data citations, data availability statements, or supplementary materials included in this article.
Supplementary Materials
Supporting Information
Supporting Information
Supporting Information
Supporting Information
Supporting Information
Supporting Information
Supporting Information
Supporting Information