

Abstract
Green bacteria are chlorophotorophs that synthesize bacteriochlorophyll (BChl) c, d, or e, which assemble into supramolecular, nanotubular structures in large light-harvesting structures called chlorosomes. The biosynthetic pathways of these chlorophylls are known except for one reaction. Null mutants of bciD, which encodes a putative radical S-adenosyl-l-methionine (SAM) protein, are unable to synthesize BChl e but accumulate BChl c; however, it is unknown whether BciD is sufficient to convert BChl c (or its precursor, bacteriochlorophyllide (BChlide) c) into BChl e (or BChlide e). To determine the function of BciD, we expressed the bciD gene of Chlorobaculum limnaeum strain DSMZ 1677T in Escherichia coli and purified the enzyme under anoxic conditions. Electron paramagnetic resonance spectroscopy of BciD indicated that it contains a single [4Fe-4S] cluster. In assays containing SAM, BChlide c or d, and sodium dithionite, BciD catalyzed the conversion of SAM into 5′-deoxyadenosine and BChlide c or d into BChlide e or f, respectively. Our analyses also identified intermediates that are proposed to be 71-OH-BChlide c and d. Thus, BciD is a radical SAM enzyme that converts the methyl group of BChlide c or d into the formyl group of BChlide e or f. This probably occurs by a mechanism involving consecutive hydroxylation reactions of the C-7 methyl group to form a geminal diol intermediate, which spontaneously dehydrates to produce the final products, BChlide e or BChlide f. The demonstration that BciD is sufficient to catalyze the conversion of BChlide c into BChlide e completes the biosynthetic pathways for all “Chlorobium chlorophylls.”
Keywords: chlorophyll, iron-sulfur protein, light-harvesting complex (antenna complex), photosynthesis, S-adenosylmethionine (SAM), bacteriochlorophyll e, green sulfur bacteria, radical SAM protein
Introduction
Green bacteria are an eclectic ensemble of anoxygenic chlorophototrophic bacteria that belong to three phyla: Chloroflexi, Chlorobi, and Acidobacteria (1–3). Although physiologically and metabolically diverse, green bacteria share the defining properties of synthesizing bacteriochlorophyll (BChl)2 c, d, or e and assembling these BChls into very large light-harvesting complexes known as chlorosomes (4–6). Chlorosomes of green sulfur bacteria (GSB), which can contain up to ∼250,000 BChl molecules (4, 7–9), are the largest known light-harvesting antenna complexes, and correspondingly, these structures allow GSB to grow under extraordinarily low light intensities. For example, a population of BChl e-producing Prosthecochloris sp. BS-1 (formerly Chlorobium phaeobacteroides BS-1) stably grows at the chemocline of the Black Sea, which occurs at a depth of ∼100–110 m beneath the surface (3, 10, 11). At this depth, the light intensity is nearly 106-fold lower than at the surface, ∼3 nmol of photons m−2 s−1 photons/day at the irradiance levels where these bacteria occur (12).
BChls c, d, and e (and BChl f, which does not occur naturally) (13–17) comprise the so-called “Chlorobium chlorophylls” (Chls). These molecules are not actually BChls but are chlorins that are structurally and spectroscopically more similar to Chl a than BChl a (18). Mutational analyses made possible by the availability of genome sequences for numerous green bacteria led to the establishment of the pathway for the synthesis of BChls c and d (12, 18–25). These BChls are synthesized from a pathway that diverges from chlorophyllide (Chlide) a (Fig. 1) (18). The first committed step in the biosynthesis of BChl c, d, and e is the removal of the C-132 carboxymethyl group from Chlide a by BciC (23, 26). BchQ and BchR methylate the resulting product at the C-82 and C-121 positions, respectively, to produce a family of related homologs (18). These methylation homologs are then hydroxylated at C-31 by BchF or BchV to produce bacteriochlorophyllide (BChlide) d (21, 27–29), and in BChl c-producing strains, they are subsequently methylated by BchU at C-20 to produce BChlide c homologs (12, 30, 31). Finally, the BChlide c or BChlide d homologs are esterified with farnesol pyrophosphate by BchK to produce BChl c or BChl d homologs with differing numbers of methyl groups (20). The methylation reactions catalyzed by BchU, BchQ, and BchR help to tune the absorption properties of BChl c, d, and e in chlorosomes and also lead to inhomogeneous broadening of the near-infrared absorption band of aggregated BChls in chlorosomes (12, 17, 18). Naturally occurring or genetically engineered mutants of bchU in formerly BChl c-producing strains exclusively synthesize BChl d (12, 32–35).
FIGURE 1.
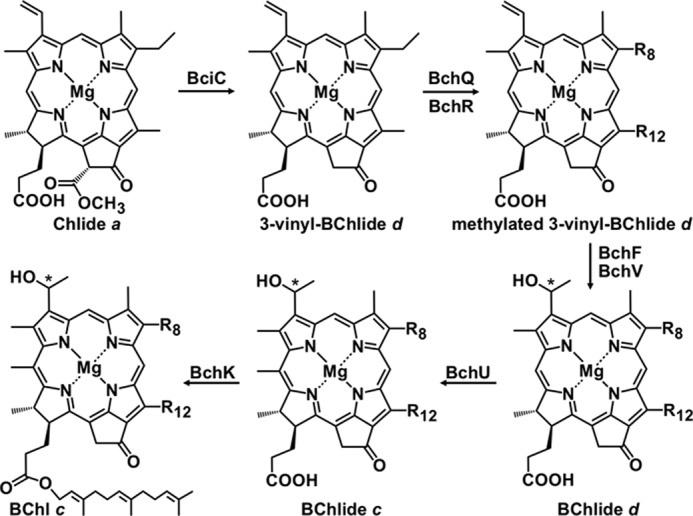
Scheme showing the biosynthetic pathway leading from Chlide a to BChl c. The side chain at C-8 (R-8) can be ethyl, n-propyl, isobutyl, or neo-pentyl. The side chain at C-12 (R12) can be methyl or ethyl. The C-8 ethyl group of 3-vinyl-BChlide d is methylated by BchQ, and the C-12 methyl group of 3-vinyl-BChlide d is methylated by BchR (22). The asterisk at C-31 indicates a chiral carbon center that can have either R- or S-stereochemistry. For further details, see the Introduction (3, 18, 24, 25).
GSB that synthesize either BChl d or BChl c are green in color, whereas those containing BChl e or the unnatural BChl f are brown. BChl e only differs from BChl c by the presence of a formyl group instead of a methyl group at the C-7 position. Similarly, BChl f is identical to BChl d except for the C-7 formyl group. The available genome sequences of brown-colored GSB contain homologs of all of the genes required for BChl c biosynthesis; thus, the BChl e biosynthetic pathway is predicted to proceed via the same reactions as that for BChl c until the oxidation of the methyl group at the C-7 position (18, 24, 25). A similar oxidation occurs at the C-7 position during the biosynthesis of Chl b from Chl a; Chl b differs from Chl a by the presence of a formyl group instead of a methyl group at the C-7 position (36). In the case of Chl b, this reaction is catalyzed by an oxygen-dependent enzyme, chlorophyllide a oxygenase (37, 38). However, because GSB are strictly anaerobic organisms and their genomes do not encode a homolog of this oxygenase, an as yet uncharacterized enzyme (or enzymes) capable of oxidizing the C-7 methyl group must be responsible for this reaction in the biosynthesis of BChl e.
Comparative genomics of brown-colored and green-colored GSB previously identified a conserved gene cluster that could potentially encode an enzyme involved in the conversion of BChlide c to BChlide e (3, 24, 25, 39). Similar versions of this gene cluster occur in all BChl e-producing strains (supplemental Fig. S1), and recent evidence suggests that this conserved gene cluster can be horizontally transferred among GSB by the action of bacteriophages (40). The smallest of these clusters contains about 11 genes extending approximately from a putative radical S-adenosyl-l-methionine (SAM) methyltransferase (bchQ2) similar to bchQ on one border to a gene encoding a homolog of isoprenylcysteine carboxyl methyltransferase, an enzyme that methylates the C-terminal carboxyl group of prenylated proteins (41), near the other border. Previous studies showed that one gene in this cluster, cruB, encodes a γ-carotene cyclase that is essential for the synthesis of β-carotene and isorenieratene, carotenoids that are uniquely and nearly universally produced by brown-colored GSB (42). This gene cluster also includes a third homolog of bchF and bchV, genes that encode C-3 vinyl hydratases (21, 27–29).
The conserved gene cluster in brown-colored GSB notably contains an open reading frame, designated as bciD, which encodes a putative radical SAM enzyme. Radical SAM enzymes are capable of performing a variety of radical-mediated reactions under anoxic conditions (43), and they often act as substitutes for oxygen-dependent enzymes in anaerobic organisms. For example, BchE is a radical SAM enzyme that catalyzes the 6-electron oxidation and cyclization of the isocylic E ring in chlorins in anaerobic chlorophototrophs (3, 18, 24, 25). BchE catalyzes the same reaction as an oxygen-dependent monooxygenase, AcsF, during chlorophyll biosynthesis in aerobic and microaerophilic chlorophototrophs (3, 24, 25, 44, 45).
When the bciD gene was inactivated by natural transformation in Chlorobaculum limnaeum strain RK-j-1, the resulting strain could no longer synthesize BChl e but instead produced BChl c (46). Although this result shows that BciD is necessary for the synthesis of BChlide e, it does not show that BciD alone is sufficient to catalyze this transformation. Repeated attempts to express the bciD gene, as well as some of the surrounding genes from the conserved gene cluster shown in Fig. 2, in Chlorobaculum tepidum uniformly failed to produce a strain that could synthesize BChl e.3 Because the phenotype of the bciD mutant reported by Harada et al. (46) was not verified by complementation, these failures led us to question whether BciD was directly involved in the synthesis of BChl e.
FIGURE 2.

Absorbance spectra of whole cells and pigment extracts. A, whole-cell absorbance spectra of the wild-type (solid line) and bciD mutant (dotted line) strains of C. limnaeum compared with wild-type C. tepidum (dashed line). B, absorbance spectra of pigments extracted with 100% methanol from the wild-type (solid line) and bciD mutant (dotted line) strains of C. limnaeum compared with wild-type C. tepidum (dashed line). To facilitate the comparison, the spectra were normalized at the Qy absorbance maxima for A and at the Soret maxima for B. AU, absorbance units.
In this study, we verified that inactivation of bciD in a second strain of C. limnaeum, strain DSMZ 1677T, also led to the synthesis of BChl c in the resulting mutant. The bciD gene was heterologously expressed in Escherichia coli, and the resultant protein was purified and characterized. The purified enzyme contains a single [4Fe-4S] cluster, and when incubated with S-adenosyl-l-methionine (SAM) and sodium dithionite, it catalyzed the conversion of BChlide c into BChlide e and BChlide d into BChlide f, and it produced 5′-deoxyadenosine as a by-product. These results demonstrate that BciD is a radical SAM enzyme and that it is sufficient to catalyze these two transformations. Thus, the biosynthetic pathway for all Chlorobium Chls is now complete.
Results
Inactivation of bciD in C. limnaeum
To confirm the phenotype of the bciD mutant described by Harada et al. (46), we insertionally inactivated the bciD gene in C. limnaeum 1677T. The mutant was made by conjugation from E. coli strain S17-1 carrying the plasmid pCLCON::bciD with C. limnaeum 1677T. This plasmid contained a single homologous region completely internal to the bciD gene. After a single homologous recombination event, this should disrupt the bciD gene as shown in supplemental Fig. S2A. Transconjugants were screened by PCR with primers bciDtestF and aadAtestR flanking one border of the insertion site (Table 1). Positive transconjugants produced a PCR amplicon of ∼1.1 kb as expected (supplemental Fig. S2B), whereas wild-type cells did not produce an amplicon. The resulting 1.1-kb PCR product was verified by DNA sequencing.
TABLE 1.
Oligonucleotide primers used in this study
| Primer name | Sequence (5′ to 3′)a |
|---|---|
| CLbciDconSphIF | ATCGATCGGCATGCTTAACAAACCACCAGCCTCCG |
| CLbciDconSalIR | ATCGATCGGTCGACGTTCGAGCCCCATCAGGAT |
| CLbciDtestF | TAAAGGCGCGACTGCTTTCC |
| aadAtestR | ATCACTGTGTGGCTTCAGGC |
| CLbciDNdeIF | GCTATACATATGAGCACAAAAAGGGTT |
| CLbciDEcoRIR | GCTATAGAATTCCTAACAGACGGGGT |
| CLbciDstopLeuF | GAGCTCGAATTCAAACAGACGGGGTAGGCTTC |
| CLbciDstopLeuR | GAAGCCTACCCCGTCTGTTTGAATTCGAGCTC |
a Introduced restriction sites appear in boldface type and are underlined.
Cultures of the bciD mutant of C. limnaeum were green in color, whereas wild-type cultures are brown. To confirm that this color change was due to a change in the BChl content of the bciD mutant strain, we compared the UV-visible absorption spectra of whole cells and of the methanol-extracted pigments of wild-type C. limnaeum, the bciD mutant of C. limnaeum, and wild-type C. tepidum, a closely related BChl c-containing GSB (Fig. 2) (47). Whole-cell spectra (Fig. 2A) of the bciD mutant very closely matched the spectrum of wild-type C. tepidum. The only notable difference was observed around 515 nm, where C. tepidum appears to have greater absorbance due to its greater carotenoid content. Similar to C. tepidum, the Qy absorption peak of the green-colored, bciD mutant strain shifted to longer wavelength, whereas the Soret absorption peak of the mutant shifted to shorter wavelength. The bciD mutant also lacked the secondary absorption peak at around 525 nm that is typical of brown-colored, BChl e-containing strains. The UV-visible absorption spectra of the extracted pigments of the bciD mutant again matched that of C. tepidum except for the carotenoid region (450–500 nm), where C. tepidum again exhibited greater absorbance (Fig. 2B). These observations agree with those reported by Harada et al. (46) and confirm that inactivation of bciD in the C. limnaeum strain DSMZ 1677T results in loss of the ability to synthesize BChl e.
Purification and Characterization of BciD-His6
To clarify the role of BciD in the synthesis of BChl e, BciD from C. limnaeum strain DSMZ 1677T was overproduced as a C-terminally His6-tagged protein in E. coli. The isc operon from plasmid pDB1282 was co-expressed with bciD to promote [Fe-S] cluster assembly (48). Protein purification was monitored by SDS-PAGE (Fig. 3). After induction, cells contained an abundant protein with an apparent mass of about 44 kDa (Fig. 3, lane 1), which is similar to the expected mass of BciD-His6 (47.3 kDa). Cells were lysed under anoxic conditions, and the lysate was subjected to ultracentrifugation to separate the soluble fraction from unbroken cells, membranes, and other debris. Although some of the protein formed inclusion bodies (data not shown), a sufficient amount of the protein of interest was observed in the soluble fraction (Fig. 3, lane 2) to justify continuing with the purification. The protein was purified by nickel affinity chromatography under strictly anoxic conditions. After concentration and buffer exchange, a relatively pure protein of roughly the expected size was obtained (Fig. 3, lane 7). This protein was subjected to in-gel trypsin digestion, and the resulting peptides were analyzed by mass spectrometry, and the analysis confirmed that the protein was BciD-His6.
FIGURE 3.
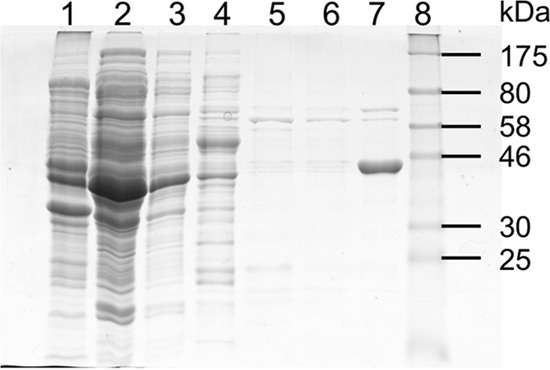
SDS-PAGE analysis of fractions from the purification of recombinant BciD-His6. Lane 1, whole-cell extract of the BciD-His6 expression strain; lane 2, crude supernatant after low speed centrifugation to remove membranes and debris; lane 3, flow-through fraction from nickel chelation chromatography; lane 4, column wash, fraction 1; lane 5, column wash, fraction 2; lane 6, column wash, fraction 3; lane 7, purified BciD-His6; lane 8, protein mass markers. BciD-His6 has an apparent mass of about 44 kDa.
As expected for a radical SAM protein, which by precedent is predicted to contain at least one [4Fe-4S] cluster, the purified BciD-His6 protein was brown in color. Fig. 4 shows the UV-visible absorption spectrum of the as-isolated protein, which had broad, weak absorbance characteristics of an S → Fe charge transfer band with a maximum at about 400 nm. After reconstitution with iron and sulfide as described under “Experimental Procedures,” this absorbance band increased substantially (roughly 2-fold), indicating that the Fe/S cluster binding site in the as-isolated protein was not completely occupied. To confirm the presence of the predicted [4Fe-4S] cluster, we measured the EPR spectra of as-isolated and reconstituted BciD. Fig. 5 shows the difference spectra of protein samples reduced with 5 mm dithionite minus the spectra of the untreated samples. In the untreated (oxidized) samples, no EPR resonances were observed; however, after reduction, as seen in the difference spectra, both the as-isolated and the reconstituted protein showed spectral features with axial symmetry and g values of 2.038 and 1.945. These spectra correspond to those typical of proteins with a single, reduced [4Fe-4S] cluster as predicted for this putative radical SAM enzyme.
FIGURE 4.
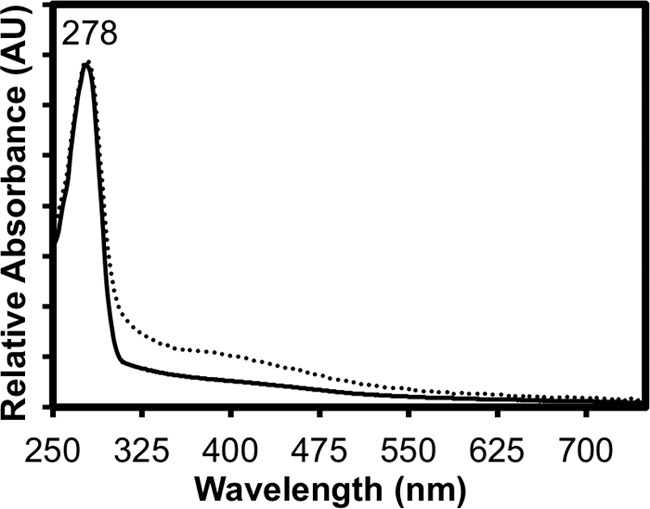
UV-visible absorbance spectra of as-isolated and reconstituted recombinant BciD-His6. The spectra for as-isolated (solid line) and reconstituted BciD-His6 are shown. To facilitate comparison, the spectra were normalized at the UV absorbance maxima. AU, absorbance units.
FIGURE 5.

EPR spectra of as-isolated and reconstituted recombinant BciD-His6. EPR spectra of as-isolated (solid line) and reconstituted recombinant BciD-His6 (dotted line). Each spectrum represents the difference spectrum between the reduced sample and the untreated (oxidized) sample. The samples were reduced by the addition of 5 mm sodium dithionite. The concentration of reconstituted BciD was 25 μm, and the concentration of as-isolated BciD was 55 μm. Spectrometer conditions are provided under “Experimental Procedures.” The g values of the axial signal are indicated above the spectra. AU, absorbance units; mT, millitesla.
BciD-His6 Activity Assay with BChlide c
Activity assays for BciD-His6 were performed under strictly anoxic conditions at room temperature. Purified BciD-His6 was incubated with a mixture of methylation homologs of BChlide c or BChlide d, SAM as a cofactor, and sodium dithionite as reductant. Control reactions without added BciD-His6 were always prepared in parallel. The pigments present in the mock control reaction were compared with those present after incubation with the enzyme by reversed-phase HPLC, and the masses of the products and reactants were determined by mass spectrometry in parallel reactions. Fig. 6A shows the HPLC elution profile of the pigments present in the samples containing BChlide c as the substrate. The dotted line contains a series of peaks that make up the substrate; the peaks at 22.3, 26.1, 29.0, 32.3, and 35.0 min account for the various methylation homologs of BChlide c, whereas the peaks at 36.9, 39.6, 40.3, and 43.0 min represent the methylation homologs of BPheide c, a breakdown product of BChlide c from which the central magnesium atom has been lost. As shown in Fig. 6B, the UV-visible spectra of BChl c in methanol and the in-line absorption spectrum of the major BChlide c substrate peak eluting at 26 min are essentially identical. The solid line in the HPLC elution profiles in Fig. 6A shows a series of peaks that are derived from reaction products and unreacted substrate molecules. The peaks at 12.1, 15.3, 16.6, 18.7, 20.0, and 21.6 min uniquely occur in the elution profile of the products (Fig. 6A and Table 2). The earlier elution times of the product peaks are consistent with the increased hydrophilicity expected for BChlide e due to replacement of the methyl group by the formyl group at the C-7 position. In Fig. 6C, the UV-visible spectra of the major 20-min product peak and the 26-min substrate peak are compared. Compared with the substrate BChlide c, the Qy absorption peak of the product is blue-shifted, and its Soret peak is red-shifted, as expected for BChlide e. In Fig. 6D, the spectra of the 20-min product and BChl e in methanol are compared, which confirms that the reaction product is BChlide e. Mass spectrometry showed that the masses of the BChlide c substrate peaks increase in 14-Da increments as they become more hydrophobic because of the additional methyl groups of the homologs (Table 2). Correspondingly, the product peaks are shifted toward earlier elution times due to greater hydrophilicity, and these compounds had masses that were 14 Da larger than the corresponding substrate peak, which diminished in intensity during the reaction (Table 2). This is consistent with the results expected if the methyl group of BChlide c was transformed into a formyl group to yield BChlide e.
FIGURE 6.

Reversed-phase HPLC analysis of BciD reaction with BChlide c. A, reversed-phase HPLC elution profile of BciD control reaction (dotted line) and the 1-h reaction (solid line) using BChlide c as the substrate. Masses of selected peaks in Da are indicated above the peaks. The numbered ranges indicated by brackets in A indicate the ranges at which 7–1-OH-BChlide c (range 1), BChlide e (range 2), BChlide c (range 3), and BPheide c (range 4) methylation homologs elute (also see Table 2). The arrows indicate the conversion of [Pr,Et]-BChlide c into 71-OH-BChlide c and then to BChlide e. B, comparison of the absorbance spectra of the 26.1-min substrate peak in A (dotted line) with BChl c in methanol (dashed line). C, comparison of the absorbance spectra of the 26.1-min substrate peak in A (dotted line) and the 20.0-min BChlide e product peak (solid line). D, comparison of the absorbance spectra of the 20.0-min product peak (solid line) and BChl e in methanol (dashed-dotted line). E, comparison of the 26.1-min substrate peak (dotted line) with the 15.3-min product peak (long-dashed line). For identities of compounds and additional information, see Table 2.
TABLE 2.
Summary of properties and assignments of peaks in BciD reaction with BChlide c (see Fig. 6)
ND, not determined; Me, methyl; Et, ethyl, Pr, n-propyl; Ib, isobutyl, Np, neo-pentyl.
| Peak number | Control reaction, BChlide c |
Complete reaction, BChlide c |
||||||
|---|---|---|---|---|---|---|---|---|
| Retention time | Absorbance peaks | Mass | Proposed pigment assignment | Retention time | Absorbance peaks | Mass | Proposed pigment assignment | |
| min | nm | Da | min | nm | Da | |||
| 1 | 12.1 | 440, 666 | ND | 71-OH-BChlide c | ||||
| 2 | 15.3 | 441, 666 | 632 | 71-OH-[Pr,Et]-BChlide c | ||||
| 3 | 16.6 | 475, 660 | ND | BChlide e | ||||
| 4 | 18.7 | 441, 666 | 646 | 71-OH-[Ib,Et]-BChlide c | ||||
| 5 | 20.0 | 475, 660 | 630 | [Pr,Et]-BChlide e | ||||
| 6 | 21.6 | 442, 474, 666 | ND | Mixed peak | ||||
| 7 | 22.3 | 437, 671 | 602 | [Et, Et]-BChlide c | 22.5 | 437, 671 | 602 | [Et,Et]-BChlide c |
| 8 | 26.1 | 437, 671 | 616 | [Pr, Et]-BChlide c | 26.3 | 437, 671 | 616 | [Pr,Et]-BChlide c |
| 9 | 29 | 437, 671 | 616, 630 | BChlide c | 29.2 | 437, 671 | 616, 630 | BChlide c |
| 10 | 32.3 | 437, 671 | 630 | [Ib, Et]-BChlide c | 32.5 | 437, 671 | 630 | [Ib,Et]-BChlide c |
| 11 | 32.8 | 413, 670 | 580 | [Et, Et]-BPheide c | 32.9 | 413, 670 | 580 | [Et,Et]-BPheide c |
| 12 | 35 | 438, 671 | 644 | [Np, Et]-BChlide c | 35.1 | 438, 671 | 644 | [Np,Et]-BChlide c |
| 13 | 36.9 | 414, 670 | 594 | [Pr, Et]-BPheide c | 37.0 | 414, 670 | 594 | [Pr,Et]-BPheide c |
| 14 | 39.6 | 414, 670 | 594 | BPheide c | 39.7 | 414, 670 | 594 | BPheide c |
| 15 | 40.3 | 414, 670 | 608 | BPheide c | 40.4 | 413, 670 | 608 | BPheide c |
| 16 | 43 | 414, 670 | 608 | [Ib, Et]-BPheide c | 43.1 | 414, 670 | 608 | [Ib,Et]-BPheide c |
In a separate analysis by HPLC, SAM was consumed, and 5′-deoxyadenosine was formed in the complete reaction containing BciD-His6, but these changes were not observed in a control reaction lacking the enzyme (Fig. 7). All of these observations are consistent with the expected functioning of a radical SAM enzyme that converts BChlide c into BChlide e.
FIGURE 7.
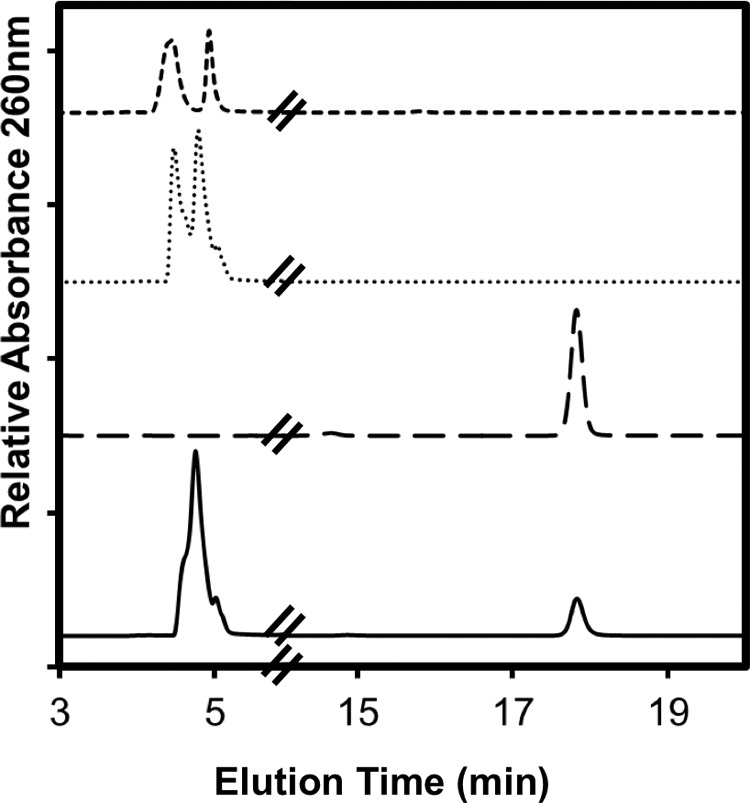
Reversed-phase HPLC analysis of 5′-deoxyadenosine produced by BciD during reaction with BChlide c. Shown is a reversed-phase HPLC elution profile of SAM standard (dashed line), 5′-deoxyadenosine standard (long-dashed line), 1-h control reaction with BChlide c (dotted line), and 1-h complete reaction with BciD (solid line) using BChlide c as the substrate. SAM (4.5 min) is consumed, and 5′-deoxyadenosine (17.8 min) is produced during the reaction.
The minor product peak at 15.2 min is particularly noteworthy. This product is obviously more hydrophilic than the major BChlide e product peak at 20 min. The in-line absorption spectrum of this product, with maxima at 441 and 666 nm (Fig. 6E and Table 2), more closely resembled the spectrum of the BChlide c substrate than the BChlide e product but was nevertheless distinct. The mass of this compound was 2 Da larger than that of the BChlide e product at 20 min. These properties are consistent with those expected for 71-hydroxy-BChlide c. These observations strongly imply that BciD is a radical SAM enzyme that acts by catalyzing two consecutive hydroxylation reactions of the C-7 methyl group.
BciD-His Activity Assay with BChlide d
A similar activity analysis is shown in Fig. 8 for the complete reaction and control with BChlide d as the substrate. Similar to the results shown for BChlide c in Fig. 6, the substrate contained methylation homologs of BChlide d and small amounts of BPheide d (Fig. 8A), and as expected, the UV-visible spectrum of the major substrate peak at 21.6 min matched that of BChl d in methanol (Fig. 8B). The major product peak at 18.9 min differs from BChlide d (Fig. 8C) but matches the spectrum of BChl f, as expected for the conversion of BChlide d to BChlide f (Fig. 8D). The main product peak appears at 18.9 min and appears to come from the second most abundant substrate peak at 25.4 min. The shift to an earlier elution time, from 25.4 min for the substrate peak to 18.9 min for the product, as well as the increase in mass by 14 Da, are the expected results if the C-7 methyl group of BChlide d has been transformed into a formyl group to produce BChlide f (Table 3). These data establish that BciD is not only necessary for the conversion of BChlide c and d into BChlide e and f, respectively, but it is sufficient to catalyze these transformations. As observed with BChlide c as substrate, a product peak at 14 min was probably due to 71-hydroxy-BChlide d. This product was more hydrophilic than the BChlide f products and had an absorption spectrum with maxima at 433 and 653 nm (Table 3 and Fig. 8E) that was more similar to BChlide d than to BChlide f. These data strongly imply that BciD-His6 sequentially hydroxylates the C-7 methyl group twice during the synthesis of BChlide f.
FIGURE 8.

Reversed-phase HPLC analysis of BciD reactions with BChlide d. A, reversed-phase HPLC elution profile of control reaction (dotted line) and the 1-h complete reaction (solid line) using BChlide d as the substrate for BciD. The numbered ranges indicated by brackets in A indicate the ranges at which 7–1-OH-BChlide d (range 1), BChlide f (range 2), BChlide d (range 3), and BPheide d (range 4) methylation homologs elute (also see Table 2). The arrow indicates the conversion of [Pr,Et]-BChlide d into [Pr,Et]-BChlide f. Masses of selected peaks in Da are indicated above the peaks. B, comparison of the absorbance spectra of the 21.6-min substrate peak in A (dotted line) with BChl d in methanol (dashed line). C, comparison of the absorbance spectra of the 21.6-min substrate peak in A (dashed line) and the 18.9-min product peak (solid line). D, comparison of the absorbance spectra of the 18.9-min product peak (solid line) and BChl f in methanol (dashed-dotted line). E, comparison of the absorption spectrum of the product peak at 16.5 min (71-OH-BChlide d) with the absorption spectrum of the substrate peak at 21.6 min ([Et,Et]-BChlide d). See Table 3 for identities of compounds and additional information.
TABLE 3.
Summary of properties and assignments of peaks in BciD reaction with BChlide d (see Fig. 8)
Masses in parentheses are inferred from those identified for the control reaction. ND, not determined; Me, methyl; Et, ethyl, Pr, n-propyl; Ib, isobutyl.
| Peak number | Control reaction, BChlide d |
Complete reaction, BChlide d |
||||||
|---|---|---|---|---|---|---|---|---|
| Retention time | Absorbance peaks | Mass | Proposed pigment assignment | Retention time | Absorbance peaks | Mass | Proposed pigment assignment | |
| min | nm | Da | min | nm | Da | |||
| 1 | 11.4 | 433, 653 | ND | 71-OH-BChlide d | ||||
| 2 | 14.1 | 433, 653 | ND | 71-OH-BChlide d | ||||
| 3 | 15.5 | 465, 646 | ND | [Et,Et]-BChlide f | ||||
| 4 | 16.5 | 433, 653 | ND | 71-OH-BChlide d | ||||
| 5 | 18.0 | 430, 659 | 574 | [Me,Et]-BChlide d | 18 | 430, 659 | (574) | [Me,Et]-BChlide d |
| 6 | 18.9 | 465, 645 | 616 | [Pr,Et]-BChlide f | ||||
| 7 | 21.6 | 429, 658 | 588 | [Et,Et]-BChlide d | 21.7 | 430, 658 | 588 | [Et,Et]-BChlide d |
| 8 | 25.4 | 430, 658 | 602 | [Pr,Et]-BChlide d | 25.5 | 430, 659 | (602) | [Pr,Et]-BChlide d |
| 9 | 26.9 | 430, 658 | 602 | BChlide d | 27 | 430, 658 | (602) | BChlide d |
| 10 | 30.2 | 430, 659 | 616 | [Ib,Et]-BChlide d | 30.2 | 430, 659 | 616 | [Ib,Et]-BChlide d |
| 11 | 31.5 | 408, 659 | 566 | [Et,Et]-BPheide d | 31.5 | 408, 659 | 566 | [Et,Et]-BPheide d |
| 12 | 35.6 | 408, 660 | 580 | [Pr,Et]-BPheide d | 35.6 | 408, 660 | (580) | [Pr,Et]-BPheide d |
Discussion
The goal of this study was to clarify the role of BciD in the biosynthetic pathway of BChl e. Previous studies (46) had shown that inactivation of the bciD gene in C. limnaeum prevented the biosynthesis of BChl e, resulting in production of BChl c in the mutant. However, repeated attempts to express bciD in C. tepidum failed to produce strains capable of BChl e synthesis or related compounds (e.g. 71-hydroxy-BChl c). Therefore, we first verified the phenotype reported for a bciD mutant of C. limnaeum strain RK-j-1 (46). The results presented in Fig. 2 agree well with those from the previous study and show that inactivation of bciD of C. limnaeum DSMZ 1677T also produced a BChl c-producing mutant strain.
The EPR spectra of recombinant BciD-His6 had features that are consistent with the presence of a single [4Fe-4S] cluster in the enzyme. In radical SAM enzymes, the SAM-activating [4Fe-4S] cluster has a binding motif consisting of three cysteines, and the canonical motif is CXXXCXXC. Supplemental Fig. S3 shows a multiple sequence alignment of BciD from four brown-colored, BChl e-producing GSB. These proteins contain five conserved cysteine residues at positions 78, 124, 133, 136, and 261; we propose that the cysteines at positions 124, 133, and 136 are ligands to the observed [4Fe-4S] cluster. The proposed roles of these three cysteine residues in ligating the [4Fe-4S] cluster in BciD will be tested by site-specific mutagenesis in future studies. In the presence of SAM and dithionite, BciD-His6 converted BChlide c and BChlide d to BChlide e and BChlide f, respectively. We additionally observed the formation of more hydrophilic products. Based upon the elution properties, absorption spectra, and masses of these compounds, we propose that they are methylation homologs of 71-OH BChlide c and 71-OH BChlide d, respectively (Tables 2 and 3). Finally, we observed that BciD consumed SAM as a cofactor and produced 5′-deoxyadenosine as a by-product of the reaction. Taken together, these observations lead us to conclude that BciD is a radical SAM enzyme with a non-canonical cysteine motif of three cysteine residues that ligates a SAM-activating [4Fe-4S] cluster and that catalyzes the conversion of the C-7 methyl group of BChlide c or d to the formyl group of BChlide e or BChlide f via consecutive hydroxylation reactions (Fig. 9).
FIGURE 9.
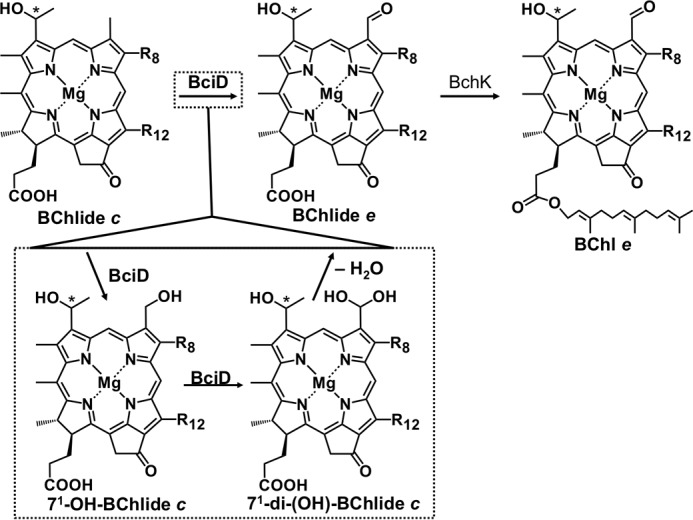
Proposed reaction scheme for BciD and BchK to convert BChlide c into BChl e. BciD is proposed to act by sequential hydroxylation of the C-7 methyl group, producing 71-monohydroxy and 71-dihydroxy derivatives of BChlide c as intermediates. Spontaneous dehydration of the geminal-diol intermediate produces the 7-formyl group of BChlide e. BChlide e is esterified in vivo by BchK to produce BChl e.
Given that BciD appears to be sufficient to convert BChlide c into BChlide e in vitro, it is still a mystery why expression of bciD in the BChl c-containing GSB C. tepidum has repeatedly failed to produce BChls containing either hydroxymethyl or formyl side chains at C-7. One possible explanation is that C. limnaeum and C. tepidum have significantly different optimal growth temperatures, and BciD might not be active at higher temperature. C. tepidum is routinely grown at 40–48 °C in the laboratory, whereas C. limnaeum is typically grown at 25–30 °C. However, we were still able to observe BciD-His6 activity in vitro at 40 °C (data not shown), which seemingly excludes this explanation. Alternatively, although it seems unlikely, one could postulate that there is no appropriate electron donor for this reaction in C. tepidum. Obviously, sodium dithionite is not the biological electron donor for this reaction in vivo in C. limnaeum. GSB, including C. tepidum, contain small, highly abundant soluble ferredoxins that typically serve this function (3, 49, 50). A counterargument to this point is that there is no gene encoding a ferredoxin or other potential electron donor protein encoded in the gene cluster that is specifically found in brown-colored, BChl e-producing GSB strains. Although it again seems unlikely because C. tepidum produces many Fe/S proteins, it is possible that the [4Fe-4S] cluster of BciD is unable to assemble, or that BciD is unable to fold properly, in the context of the C. tepidum cytoplasm.
An alternative explanation is that there is a biosynthetic problem downstream from BciD and BChlide e that prevents the accumulation of BChl e in C. tepidum. Specifically, the enzymes responsible for adding the esterifying alcohols to Chls and BChls show considerable specificity for the (B)Chlide substrate but usually have broader specificity for the esterifying alcohol (20, 51–53). In C. tepidum BchK is responsible for the addition of the farnesyl tail to BChl c, and ChlG and BchG add phytadienol and phytol to Chl a and BChl a, respectively (20). A comparative analysis of the genomes of GSB shows that all have at least three esterifying enzymes: BchK, ChlG, and BchG. Interestingly, C. limnaeum has two paralogs of the bchK gene; one paralog encodes BchK1, which is very similar to the enzyme found in C. tepidum, but paralog BchK2 is much more divergent (supplemental Fig. S4). Moreover, all brown-colored, BChl e-producing GSB species contain a BchK enzyme that is phylogenetically distant from the BchK of C. tepidum. These observations suggest that a possible problem in producing BChl e in C. tepidum might result from an incompatibility between the esterifying enzyme (BchK) in C. tepidum and the BChlide e substrate. If this is correct, then it might be possible to circumvent this problem by expressing the bchK2 gene of C. limnaeum together with bciD in C. tepidum. The construction of a brown-colored, BChl e-producing strain of C. tepidum would be very useful for physiological and biophysical studies on the specific role(s) of the BChl e in adaptation of GSB to growth at very low light intensities.
When assembled into chlorosomes, BChls c, d, and e have distinctive absorption features that are associated with specific light niches in nature (4, 6). In aquatic systems, organisms with chlorosomes containing BChl d typically occur at shallower depths than organisms containing BChl c (12, 54–56). A similar pattern is observed in benthic mat systems in chlorophototrophic mats associated with alkaline siliceous hot springs in Yellowstone National Park (57, 58). When BChl e assembles into supramolecular aggregates in chlorosomes, an emergent absorption band appears at about 525 nm (see Fig. 4) that allows these organisms to very efficiently harvest blue light (6). Such organisms are also typically able to grow at greater depths and at remarkably low light intensities (10–13, 54–56). Thus, the ability to synthesize BChl e is associated with the ability to inhabit a light niche that is inaccessible to other chlorophototrophs. Should the bciD gene be horizontally transferred to a recipient capable of BChl c synthesis, the ability to synthesize BChl e would allow that organism to modify its light-harvesting chlorosomes and invade niches with lower light intensities and fewer competitors.
Evidence exists for horizontal gene transfer for the entire gene cluster that includes bciD and cruB (40). In Lake Cisó in Spain, the resident population of GSB recently shifted from green to brown, and a metagenomic analysis showed that the genome of the brown-colored organism was extremely similar to the type strain of Chlorobium luteolum DSM 273T, a green-colored, BChl c-producing strain (3). Some evidence pointed to a DNA phage as a possible vector for this transfer (40). Interestingly, Chlorobium luteolum DSM 273T has two bchK genes, one of which is similar to the bchK gene of C. tepidum and one of which (bchK2) belongs to the clade of enzymes that are found in brown-colored, BChl e-producing GSB strains (supplemental Fig. S4). The presence of a bchK2 gene, the product of which can presumably esterify BChlide e with farnesol, might “predispose” Chlorobium luteolum to transformation from a BChl c-producing into a BChl e-producing strain by the acquisition of bciD, although the horizontally transferred, conserved gene cluster does not include a gene for a chlorophyll synthase. These ideas can be tested in future studies by inactivating the bchK1 and bchK2 genes in C. limnaeum as well as by introducing the bciD gene into C. tepidum in combination with each of the two bchK genes encoding the two paralogous esterification enzymes of C. limnaeum.
Questions remain about the detailed mechanism of hydroxylation, the source of oxygen for this reaction (presumably water), and the structure of the BciD enzyme. BciD is the first radical SAM enzyme of its subclass to be characterized. A blastp comparison of BciD against the UCSF structure-function linkage database showed that BciD is most closely related to uncharacterized subgroup 20 and uncharacterized subgroup 11 of the radical SAM superfamily (59). A blastp search of the NCBI protein database with the BciD query returned 928 sequences with an e value <0.001; however, none of these proteins have been characterized in vitro. The blastp search also showed that BciD has similarity to the following conserved domains: Elp3, rSAM_MSMEG_0568, Radical_SAM, and BioB. These conserved domains correspond to the superfamily denoted Elongator protein 3/MiaB/radical SAM, which contains several radical SAM enzyme families, the protein family radical SAM MSMEG_0568, which has no characterized function, the radical SAM superfamily, and a domain found in biotin synthase and related enzymes. The absence of obviously close relatives makes the BciD enzyme interesting for future study, not just from the perspective of BChl synthesis, but also from the perspective of radical SAM biochemistry more broadly.
Experimental Procedures
Strains Used in This Study
C. limnaeum strain DSMZ 1677T (47) was obtained from the culture collection of Dr. Johannes Imhoff (University of Kiel, Germany). C. limnaeum is capable of thiosulfate utilization (13), and it was routinely grown on medium CL used for C. tepidum (60, 61) at irradiances of 10–100 μmol of photons m−2 s−1 provided by either tungsten or cool white fluorescent lamps. C. limnaeum cells were grown at room temperature in CL medium in liquid and the same medium solidified with 1.5% (w/v) BactoTM Agar (BD Biosciences) in a Coy anoxic chamber under an atmosphere of N2/CO2/H2 (80:10:10, v/v/v). Plates were further enclosed in Gas-Pak jars containing thioacetamide as described previously (61). The complete genome of this organism has been sequenced and is available in GenBankTM as accession number CP017305.4
Routine cloning to produce constructions for gene inactivation were performed using chemically competent α-select Escherichia coli cells (Bioline, Taunton, MA). The E. coli strain used for conjugation was S17-1 (62), and E. coli strain BL21 (DE3) was used for expression of the bciD gene. E. coli strains were grown in Luria-Bertani (LB) medium containing antibiotics as required. For overproduction of BciD, the medium was supplemented with ferric ammonium citrate (100 μm) and l-cysteine (100 μm). Antibiotic concentrations for E. coli were as follows: spectinomycin, 100 μg ml−1; ampicillin, 100 μg ml−1 streptomycin, 50 μg ml−1; and kanamycin, 50 μg ml−1. Antibiotic concentrations for C. limnaeum grown on solid medium were as follows: spectinomycin, 200 μg ml−1; streptomycin, 100 μg ml−1; kanamycin, 30 μg ml−1. When grown in liquid medium, antibiotic concentrations for C. limnaeum were as follows: spectinomycin, 37.5 μg ml−1; streptomycin, 18.75 μg ml−1.
Cloning and Inactivation of bciD in C. limnaeum
Inactivation of the bciD gene of C. limnaeum strain DSMZ 1677T was performed by conjugative gene transfer essentially as described (13). A gene-internal region of the bciD gene was amplified by PCR using oligonucleotide primers CLbciDconSphIF and CLbciDconSalIR (Table 1) and cloned into the SphI and SalI sites of the conjugation vector pCLCON (13) to create vector pCLCON::bciD (supplemental Fig. S2A) The resulting plasmid was transformed into E. coli strain S17-1. Conjugation between the S17-1 strain and wild-type C. limnaeum was performed as described previously (13), and transconjugants were selected on solid medium containing spectinomycin, streptomycin, and kanamycin. Transconjugant colonies were screened by PCR using oligonucleotide primers CLbciDtestF and aadAtestR (Table 1) that flank one border of the gene insertion site; amplicons were analyzed by agarose gel electrophoresis (supplemental Fig. S2 B), and positive PCR amplicons were confirmed by DNA sequencing at the Genomics Core Facility (Pennsylvania State University, University Park, PA).
Cloning and Heterologous Expression of bciD in E. coli
The bciD gene from C. limnaeum was amplified via PCR using oligonucleotide primers CLbciDNdeIF and CLbciDEcoRIR (Table 1). The resulting PCR amplicon and plasmid pET26b were digested with NdeI and EcoRI, and the products were ligated to insert the bciD gene upstream of the sequence for a C-terminal His6 tag. Site-directed mutagenesis was used to change the bciD stop codon to a leucine codon using the QuikChange II mutagenesis kit (Agilent Technologies, Santa Clara, CA) and oligonucleotide primers CLbciDstopLeuF and CLbciDstopLeuR (Table 1). The complete coding sequence and the downstream flanking region encoding the His6 tag in the resulting plasmid, pET26b(bciD-His6), were confirmed by DNA sequencing at the Genomics Core Facility.
The expression and purification of BciD-His6 was modified from protocols used for other radical SAM enzymes (48). The expression plasmid pET26b(bciD-His6) was transformed into E. coli strain BL21 (DE3) together with plasmid pDB1282, which contains part of the Azotobacter vinelandii isc operon for [Fe-S] cluster assembly under the control of an arabinose repressor and operator (48, 63, 64). A starter culture of the expression strain was grown overnight at 37 °C in LB medium supplemented with ampicillin and kanamycin. A 2.5-liter culture in minimal medium containing 2% (v/v) glycerol, ampicillin, and kanamycin was inoculated with a 25-ml overnight culture. The culture was grown at 37 °C with gentle rotation to an OD600 of 0.2–0.3, and expression of the isc operon of pDB1282 was induced with 0.2% l-arabinose after supplementing the medium with ferric ammonium citrate (100 μm) and cysteine (100 μm). After the addition of arabinose, cells were grown at 37 °C to an OD600 of 0.7–0.8 and then cooled to ∼18 °C. Finally, BciD-His6 production was induced by adding isopropyl-β-d-1-thiogalactopyranoside (50 μm). After further incubation at 18 °C for 16–20 h, cells were harvested by centrifugation and either immediately transferred to an anoxic chamber or frozen and placed at −80 °C for short term storage before lysis.
BciD Purification
Buffers used for purification of BciD were made in an anoxic chamber by dissolving the solid materials in anoxic water. The cell pellet was thawed on ice in the anoxic chamber, and cells were resuspended in lysis buffer containing 50 mm HEPES, pH 7.5, 300 mm NaCl, 20 mm imidazole, and 10 mm 2-mercaptoethanol. Lysozyme was added to 1 mg ml−1, and the suspension was incubated with rocking for 30 min at room temperature. Cells were cooled on ice and then lysed by sonication. Lysed cells were transferred to ultracentrifuge tubes and sealed inside the anoxic chamber before pelleting the cell debris by ultracentrifugation. The tubes were returned to the anoxic chamber, and the soluble fraction was loaded onto a nickel affinity column pre-equilibrated with lysis buffer. The column was washed three times with three volumes of wash buffer. Wash buffer contained 50 mm HEPES, pH 7.5, 300 mm NaCl, 40 mm imidazole, 10 mm 2-mercaptoethanol, and 20% glycerol. BciD was eluted with a minimal volume of elution buffer, which was the same as the wash buffer except for the imidazole concentration (250 mm). The dark brown-colored fractions were pooled and concentrated using an Amicon stirred ultrafiltration cell with a YM-10 filter (10,000 molecular weight cut-off; Millipore, Bedford, MA). The protein was exchanged into storage buffer containing 50 mm HEPES, pH 7.5, 100 mm NaCl, 10 mm dithiothreitol, and 20% glycerol using PD-10 gel filtration columns (GE Healthcare) and stored in aliquots in liquid nitrogen.
Protein Analyses and Verification
The purity of the BciD-His6 protein was assessed by electrophoresis on 12% (w/v) polyacrylamide gels in the presence of SDS; proteins were stained with Coomassie Blue R-250 (65). The identity of purified BciD-His6 was verified by in-gel trypsin digestion (66) accompanied by mass spectrometry at the Proteomics and Mass Spectrometry Core Facility (The Pennsylvania State University, University Park, PA). Protein concentrations were determined by the Bradford assay using a BSA standard (67). Quantitative amino acid analysis performed by the University of California-Davis Proteomics Core Facility established that a correction factor of 0.87 was necessary for protein concentrations determined by the Bradford assay.
Reconstitution of Fe/S Cluster
The reconstitution procedure (48, 68, 69) was carried out on ice with gentle stirring in an anoxic chamber. A final concentration of dithiothreitol (2 mg ml−1) was added to reconstitution buffer (100 mm HEPES, pH 7.5, 300 mm NaCl, 10% (v/v) glycerol), and the solution was incubated for 10 min before adding 300 μm FeCl3. Purified BciD-His6 was added to a final concentration of 30 μm, and the solution was incubated for 1 h. A Na2S solution (100 mm) was slowly added to the protein solution over a 3-h period to produce a final concentration of 300 μm, and the resulting reaction mixture was incubated on ice for 12 h. The protein solution was centrifuged at 10,000 × g for 10 min, and the supernatant was concentrated and exchanged into storage buffer. To remove adventitiously bound iron, BciD-His6 was chromatographed on a Superdex 75 10/300 GL size exclusion column (GE Healthcare) maintained in an anoxic chamber.
Spectroscopic Measurements
UV-visible absorbance spectra of protein and pigment samples were measured on a GENESYS 10 spectrophotometer (ThermoFisher Scientific Corp., Waltham, MA). Spectra of protein samples were measured in quartz cuvettes that were sealed inside an anoxic chamber.
For EPR measurements, samples of as-isolated and reconstituted BciD-His6 were transferred to EPR tubes in storage buffer. To characterize the presence of Fe/S cluster(s), each protein preparation was measured in both the untreated and reduced states. To reduce the Fe/S cluster(s) fully, dithionite in storage buffer was added to a final concentration of 5 mm to the appropriate protein samples, and the samples were then frozen in liquid nitrogen. EPR spectra were collected using a cylindrical TE 011 mode resonator and a Bruker E500 spectrometer (Bruker Biospin Corp., Billerica, MA) at X-band (9.39 GHz). The temperature was maintained using an ESR 900 liquid helium cryostat and an ITC-4 temperature controller (Oxford Instruments, Concord, MA). EPR spectra were recorded at 15 K at 0.2-milliwatt microwave power with modulation amplitude of 20 G (2 millitesla) at a modulation frequency of 100 kHz. Sixteen scans were collected and averaged for each sample; the difference spectrum was calculated by subtracting the spectrum for the untreated protein from that for the dithionite-reduced protein.
Pigment Separation and Preparation of Substrate Compounds
Pigments were separated and analyzed by reversed-phase HPLC using a 25 cm × 4.6-mm Discovery 5-μm C-18 column (Supelco, Bellefonte, PA) and an Agilent series 1100 HPLC system equipped with a diode array detector (Agilent Technologies, Palo Alto, CA) (70). The data were analyzed using Agilent ChemStation software (revision B.02.01-SR1 6100 series). Pigment samples or reaction products were filtered through a 0.2-μm syringe filter, and 10 mm ammonium acetate was added before injection onto the column. Previously described separation methods (71–73) were modified slightly to separate the BChlide and bacteriopheophorbide (BPheide) components of interest. The column was pre-equilibrated with 12% solvent B (methanol, ethyl acetate, acetonitrile, 50:30:20 (v/v/v)) and 88% solvent A (methanol, 1 m ammonium acetate, 70:30 (v/v)) at a flow rate of 0.75 ml min−1 at injection and maintained for 5 min. After 5 min, solvent B was increased linearly to 43%, and the flow rate was increased linearly to 1 ml min−1 at 44 min. Solvent B was linearly increased to 100% from 44 to 55 min and then held constant for 10 min. The column was then returned to 12% solvent B and washed extensively before the next injection.
BChlide c was prepared from a 2-liter culture of the bciD mutant of C. limnaeum (see “Results”), and BChlide d was prepared from a 2-liter culture of the bchU mutant of C. tepidum (12). Cells were harvested by centrifugation, and pigments were extracted with 7:2 acetone/methanol (40 ml) for 1 h at room temperature in the dark with stirring. Cell debris was removed by centrifugation, and the solubilized pigments were purified using a previously described, reversed-phase HPLC method (13). The BChl fractions were collected, pooled, dried under liquid nitrogen, washed with acetone, and finally dried again. To hydrolyze the esterifying alcohol groups of the BChls, the dried pigments were suspended in 4:1 solution of acetone/water containing 0.1 m NaOH, and the solution was incubated in the dark for 3 h (53). One volume of hexane was added to extract unreacted BChls, and the acetone layer was dried under liquid nitrogen and washed three times with acetone. Dried samples were stored at −20 °C until required.
Mass Spectrometry
Mass spectrometric analysis was performed on a Waters Q-TOF Premier quadrupole/time-of-flight mass spectrometer (Waters Corp. (Micromass Ltd.), Manchester, UK). MassLynxTM software version 4.1 was used to operate the mass spectrometer. Samples were introduced into the mass spectrometer using a Waters 2695 high performance liquid chromatograph. The separation was performed using the same HPLC column and solvent gradient described above for analysis of the reaction products. The samples were resuspended in acetonitrile (100 μl) and vortexed until dissolved. The injection volume was 25 μl. The nitrogen drying gas temperature was set to 300 °C at a flow of 7 liters min−1, and the capillary voltage was 2.8 kV. The mass spectrometer was set to scan from 400 to 700 m/z in positive ion mode, using electrospray ionization. Data acquisition was performed in the middle of the run, dependent upon the anticipated elution time of the analytes.
Enzyme Activity Assay
Enzyme assays were performed inside an anoxic chamber in the dark at room temperature. The reaction buffer consisted of 100 mm MOPS, pH 8.0, 100 mm NaCl. Tryptophan (200 μm final concentration) was added as an internal standard. In addition, a final concentration of 700 μm SAM and 1 mm dithionite were added as cofactor and reductant, respectively. Reactions contained a final concentration of 0.2 mg ml−1 purified BciD; an equal volume of enzyme storage buffer was added to control reactions. BChlide c (final concentration, 0.05 mg ml−1) or BChlide d (final concentration, 0.18 mg ml−1) in acetone was added to the enzyme solution to start the reaction. At appropriate times, aliquots were removed from each reaction for analysis. An equal volume of cold acetone was added to stop the reaction, and precipitated protein was pelleted by centrifugation. Samples were stored on ice or at −20 °C until the pigments were analyzed by reversed-phase HPLC.
To analyze SAM-related products, separate aliquots were taken at each time point, and an equal volume of 100 mm H2SO4 was added to stop the reaction. SAM products were separated by a reversed-phase HPLC procedure modified from Lanz et al. (48), using a 150 × 4.6-mm Kinetex 5-μm C-18 column (Phenomenex Inc., Torrance, CA) and a Shimadzu UFLC system (Shimadzu Scientific Instruments, Columbia, MD). Reaction products were filtered through a syringe filter (0.2 μm) before being injected onto the column. The column was pre-equilibrated with 2% solvent B (HPLC grade acetonitrile) and 98% solvent A (5% methanol, 40 mm ammonium acetate, pH 6.2) at a flow rate of 0.5 ml min−1 at injection and maintained for 6.5 min. Solvent B was increased linearly to 12% from 6.5 to 25 min, then to 24% from 25 to 33 min, and finally to 50% from 33 to 40 min. Solvent B was maintained at 50% for 10 min and then returned to the starting conditions. Products were monitored by UV-visible detection at 260 nm and were compared with authentic standards for SAM and 5′-deoxyadenosine.
Phylogenetic Analyses
Phylogenetic relationships were inferred by the maximum likelihood method based on the JTT matrix-based model (74). The tree with the highest log likelihood value (−10,582.4753) is shown. Based upon 100 bootstrap resamplings of the data, the percentage of trees in which the associated taxa clustered together is indicated next to the branches. Initial tree(s) for the heuristic search were obtained automatically by applying neighbor-joining and BioNJ algorithms to a matrix of pairwise distances that were estimated using a JTT model and then by selecting the topology with the highest log likelihood value. The tree is drawn to scale, with branch lengths scaled to the number of substitutions per site. The analysis employed 52 amino acid sequences. All positions containing gaps due to insertions/deletions were eliminated from the alignment. The final alignment data set contained 244 positions. Evolutionary analyses were conducted in MEGA7 (75).
Author Contributions
J. L. T. designed and performed the experiments, interpreted the data, and wrote the initial draft of the manuscript; B. H. F. performed the electron paramagnetic resonance measurements; and J. H. G. assisted in the interpretation of the EPR data and edited the manuscript. D. A. B. conceived the project, directed the research, assisted in the interpretation of the data, and wrote and edited the manuscript. All authors approved the final version of the manuscript.
Acknowledgments
We are grateful to Dr. Squire Booker and members of the Booker laboratory for providing the plasmid pDB1282 and for guidance and suggestions for characterizing radical SAM enzymes. We particularly thank Dr. Nick Lanz for assistance and Mohammad Almishwat for use of an anoxic size exclusion column and for helpful discussion. Finally, we gratefully acknowledge Dr. James Miller of the Proteomics and Mass Spectrometry Core Facility for expert assistance in collecting and analyzing the mass spectrometric data.
This work was supported by Grants DE-FG02-94ER20137 (to D. A. B.) and DE-FG02-98ER20314 (to J. H. G) from the Photosynthetic Systems Program, Division of Chemical Sciences, Geosciences, and Biosciences (CSGB), Office of Basic Energy Sciences of the United States Department of Energy. The authors declare that they have no conflicts of interest with the contents of this article.

This article contains supplemental Figs. S1–S4.
J. A. Maresca, Z. Liu, J. L. Thweatt, and D. A. Bryant, unpublished results.
M. Tank, Z. Liu, L. P. Thomsho, S. C. Schuster, and D. A. Bryant, manuscript in preparation.
- BChl
- bacteriochlorophyll
- BChlide
- bacteriochlorophyllide
- BPheide
- bacteriopheophorbide
- GSB
- green sulfur bacteria
- Chl
- chlorophyll
- Chlide
- chlorophyllide
- SAM
- S-adenosyl-l-methionine
- Et
- ethyl
- Pr
- n-propyl
- Ib
- isobutyl
- Np
- neo-pentyl.
References
- 1. Bryant D. A., and Frigaard N.-U. (2006) Prokaryotic photosynthesis and phototrophy illuminated. Trends Microbiol. 14, 488–496 [DOI] [PubMed] [Google Scholar]
- 2. Bryant D. A., Costas A. M., Maresca J. A., Chew A. G., Klatt C. G., Bateson M. M., Tallon L. J., Hostetler J., Nelson W. C., Heidelberg J. F., and Ward D. M. (2007) “Candidatus Chloracidobacterium thermophilum”: an aerobic phototrophic acidobacterium. Science 317, 523–526 [DOI] [PubMed] [Google Scholar]
- 3. Bryant D. A., Liu Z., Li T., Zhao F., Garcia Costas A. M., Klatt C. G., Ward D. M., Frigaard N.-U., and Overmann J. (2012) Comparative and functional genomics of anoxygenic green bacteria from the taxa Chlorobi, Chloroflexi, and Acidobacteria. In Advances in Photosynthesis and Respiration, Vol. 35 (Burnap R. L., and Vermaas W., eds) pp. 47–102, Springer, Dordrecht, Netherlands [Google Scholar]
- 4. Frigaard N.-U., and Bryant D. A. (2006) Chlorosomes: antenna organelles in green photosynthetic bacteria. In: Complex Intracellular Structures in Prokaryotes (Shively J. M., ed) pp. 79–114, Springer, Berlin [Google Scholar]
- 5. Oostergetel G. T., van Amerongen H., and Boekema E. J. (2010) The chlorosome: a prototype for efficient light harvesting in photosynthesis. Photosynth. Res. 104, 245–255 [DOI] [PMC free article] [PubMed] [Google Scholar]
- 6. Orf G. S., and Blankenship R. E. (2013) Chlorosome antenna complexes from green photosynthetic bacteria. Photosynth. Res. 116, 315–331 [DOI] [PubMed] [Google Scholar]
- 7. Montaño G. A., Bowen B. P., LaBelle J. T., Woodbury N. W., Pizziconi V. B., and Blankenship R. E. (2003) Characterization of Chlorobium tepidum chlorosomes: a calculation of bacteriochlorophyll c per chlorosome and oligomer modeling. Biophys. J. 85, 2560–2565 [DOI] [PMC free article] [PubMed] [Google Scholar]
- 8. Bryant D. A., Vassilieva E. V., Frigaard N.-U., and Li H. (2002) Selective protein extraction from Chlorobium tepidum chlorosomes using detergents: evidence that CsmA forms multimers and binds bacteriochlorophyll a. Biochemistry 41, 14403–14411 [DOI] [PubMed] [Google Scholar]
- 9. Adams P. G., Cadby A. J., Robinson B., Tsukatani Y., Tank M., Wen J., Blankenship R. E., Bryant D. A., and Hunter C. N. (2013) Comparison of the physical characteristics of chlorosomes from three different phyla of green phototrophic bacteria. Biochim. Biophys. Acta 1827, 1235–1244 [DOI] [PubMed] [Google Scholar]
- 10. Manske A. K., Glaeser J., Kuypers M. M., and Overmann J. (2005) Physiology and phylogeny of green sulfur bacteria forming a monospecific phototrophic assemblage at a depth of 100 meters in the Black Sea. Appl. Environ. Microbiol. 71, 8049–8060 [DOI] [PMC free article] [PubMed] [Google Scholar]
- 11. Marschall E., Jogler M., Hessge U., and Overmann J. (2010) Large-scale distribution and activity patterns of an extremely low-light-adapted population of green sulfur bacteria in the Black Sea. Environ. Microbiol. 12, 1348–1362 [DOI] [PubMed] [Google Scholar]
- 12. Maresca J. A., Gomez Maqueo Chew A., Ponsatí M. R., Frigaard N.-U., Ormerod J. G., Jones A. D., and Bryant D. A. (2004) The bchU gene of Chlorobium tepidum encodes the bacteriochlorophyll C-20 methyltransferase. J. Bacteriol. 186, 2558–2566 [DOI] [PMC free article] [PubMed] [Google Scholar]
- 13. Vogl K., Tank M., Orf G. S., Blankenship R. E., and Bryant D. A. (2012) Bacteriochlorophyll f: properties of chlorosomes containing the “forbidden chlorophyll.” Front. Microbiol. 3, 298. [DOI] [PMC free article] [PubMed] [Google Scholar]
- 14. Orf G. S., Tank M., Vogl K., Niedzwiedzki D. M., Bryant D. A., and Blankenship R. E. (2013) Spectroscopic insights into the decreased efficiency of chlorosomes containing bacteriochlorophyll f. Biochim. Biophys. Acta 1827, 493–501 [DOI] [PubMed] [Google Scholar]
- 15. Niedzwiedzki D. M., Orf G. S., Tank M., Vogl K., Bryant D. A., and Blankenship R. E. (2014) Photophysical properties of the excited states of bacteriochlorophyll f in solvents and in chlorosomes. J. Phys. Chem. B 118, 2295–2305 [DOI] [PubMed] [Google Scholar]
- 16. Harada J., Mizoguchi T., Tsukatani Y., Noguchi M., and Tamiaki H. (2012) A seventh bacterial chlorophyll driving a large light-harvesting antenna. Sci. Rep. 2, 671. [DOI] [PMC free article] [PubMed] [Google Scholar]
- 17. Tsukatani Y., Harada J., Mizoguchi T., and Tamiaki H. (2013) Bacteriochlorophyll homolog compositions in the bchU mutants of green sulfur bacteria. Photochem. Photobiol. Sci. 12, 2195–2201 [DOI] [PubMed] [Google Scholar]
- 18. Chew A. G., and Bryant D. A. (2007) Chlorophyll biosynthesis in bacteria: the origins of structural and functional diversity. Annu. Rev. Microbiol. 61, 113–129 [DOI] [PubMed] [Google Scholar]
- 19. Eisen J. A., Nelson K. E., Paulsen I. T., Heidelberg J. F., Wu M., Dodson R. J., Deboy R., Gwinn M. L., Nelson W. C., Haft D. H., Hickey E. K., Peterson J. D., Durkin A. S., Kolonay J. L., Yang F., et al. (2002) The complete genome sequence of the green sulfur bacterium Chlorobium tepidum. Proc. Natl. Acad. Sci. U.S.A. 99, 9509–9514 [DOI] [PMC free article] [PubMed] [Google Scholar]
- 20. Frigaard N.-U., Voigt G. D., and Bryant D. A. (2002) A bacteriochlorophyll c-less mutant of Chlorobium tepidum made by inactivation of the bchK gene encoding bacteriochlorophyll c synthase. J. Bacteriol. 184, 3368–3376 [DOI] [PMC free article] [PubMed] [Google Scholar]
- 21. Gomez Maqueo Chew A., Frigaard N.-U., and Bryant D. A. (2005) Characterization of BchV, a C-31 hydratase specific for hypermethylated bacteriochlorophyll c in Chlorobium tepidum. In Photosynthesis: Fundamental Aspects to Global Perspectives (van der Est A., and Bruce D., eds) pp. 875–877, Allen Press, Lawrence, KS [Google Scholar]
- 22. Gomez Maqueo Chew A., Frigaard N.-U., and Bryant D. A. (2007) Bacteriochlorophyllide c C-82 and C-121 methyltransferases are essential for adaptation to low light in Chlorobaculum tepidum. J. Bacteriol. 189, 6176–6184 [DOI] [PMC free article] [PubMed] [Google Scholar]
- 23. Liu Z., and Bryant D. A. (2011) Identification of a gene essential for the first committed step in the synthesis of bacteriochlorophyll c. J. Biol. Chem. 286, 22393–22402 [DOI] [PMC free article] [PubMed] [Google Scholar]
- 24. Liu Z., and Bryant D. A. (2012) Biosynthesis and assembly of bacteriochlorophyll c in green bacteria: theme and variations. In Handbook of Porphyrin Science, Vol. 20, (Kadish K. M., Smith K. M., Guilard R., eds) pp. 108–142, World Scientific Publishing, Hackensack, NJ [Google Scholar]
- 25. Bryant D. A., and Liu Z. (2013) Green bacteria: insights into green bacterial evolution through genomic analyses in Advances in Botanical Research. In Genome Evolution of Photosynthetic Bacteria (Beatty J. T., ed.), Vol. 66, pp. 99–150, Elsevier, New York, NY [Google Scholar]
- 26. Teramura M., Harada J., Mizoguchi T., Yamamoto K., and Tamiaki H. (2016) In vitro assays of BciC showing C132-demethoxycarbonylase activity requisite for biosynthesis of chlorosomal chlorophyll pigments. Plant Cell Physiol. 57, 1048–1057 [DOI] [PubMed] [Google Scholar]
- 27. Gomez Maqueo Chew A., Frigaard N.-U., and Bryant D. A. (2005) Characterization of BchV, a C-31 hydratase specific for hypermethylated bacteriochlorophyll c in Chlorobium tepidum. In Photosynthesis: Fundamental Aspects to Global Perspectives (van der Est A., and Bruce D., eds) pp. 875–877, Allen Press, Lawrence, KS [Google Scholar]
- 28. Harada J., Teramura M., Mizoguchi T., Tsukatani Y., Yamamoto K., and Tamiaki H. (2015) Stereochemical conversion of C3-vinyl group to 1-hydroethyl group in bacteriochlorophyll c by the hydratases BchF and BchV: adaptation of green sulfur bacteria to light-limited environments. Mol. Microbiol. 98, 1184–1198 [DOI] [PubMed] [Google Scholar]
- 29. Teramura M., Harada J., and Tamiaki H. (2016) In vitro stereospecific hydration activities of the 3-vinyl group of chlorophyll derivatives by BchF and BchV enzymes involved in bacteriochlorophyll c biosynthesis of green sulfur bacteria. Photosynth. Res. 130, 33–45 [DOI] [PubMed] [Google Scholar]
- 30. Harada J., Saga Y., Yaeda Y., Oh-Oka H., and Tamiaki H. (2005) In vitro activity of C-20 methyltransferase, BchU, involved in bacteriochlorophyll c biosynthetic pathway in green sulfur bacteria. FEBS Lett. 579, 1983–1987 [DOI] [PubMed] [Google Scholar]
- 31. Wada K., Yamaguchi H., Harada J., Niimi K., Osumi S., Saga Y., Oh-Oka H., Tamiaki H., and Fukuyama K. (2006) Crystal structures of BchU, a methyltransferase involved in bacteriochlorophyll c biosynthesis, and its complex with S-adenosylhomocysteine: implications for reaction mechanism. J. Mol. Biol. 360, 839–849 [DOI] [PubMed] [Google Scholar]
- 32. Broch-Due M., and Ormerod J. G. (1978) Isolation of a BCHL c mutant from Chlorobium with BCHL d by cultivation at low light intensity. FEMS Microbiol. Lett. 3, 305–308 [Google Scholar]
- 33. Bobe F. W., Pfennig N., Swanson K. L., and Smith K. M. (1990) Red shift of absorption maxima in Chlorobineae through enzymic methylation of their antenna bacteriochlorophylls. Biochemistry 29, 4340–4348 [DOI] [PubMed] [Google Scholar]
- 34. Saga Y., and Tamiaki H. (2004) Comparison between chlorosomes containing bacteriochlorophyll-c and and chlorosomes containing bacteriochlorophyll-d isolated from two substrains of green sulfur photosynthetic bacterium Chlorobium vibrioforme NCIB 8327. J. Photochem. Photobiol. B 75, 89–97 [DOI] [PubMed] [Google Scholar]
- 35. Harada J., Oh-Oka H., Saga Y., and Tamiaki H. (2005) Natural reverse mutations of the inactivated bchU gene in Chlorobium vibrioforme NCIB 8327. In Photosynthesis: Fundamental Aspects to Global Perspectives (van der Est A., Bruce D., eds) pp. 119–120, Allen Press, Lawrence, KS [Google Scholar]
- 36. Scheer H. (2006) An overview of chlorophylls and bacteriochlorophylls: biochemistry, biophysics, functions and applications. In Advances in Photosynthesis and Respiration, Vol. 25 (Grimm B., Porra R. J., Rüdiger W., and Scheer H., eds) pp. 1–26, Springer, Dordrecht, Netherlands [Google Scholar]
- 37. Tanaka A., Ito H., Tanaka R., Tanaka N. K., Yoshida K., and Okada K. (1998) Chlorophyll a oxygenase (CAO) is involved in chlorophyll b formation from chlorophyll a. Proc. Natl. Acad. Sci. U.S.A. 95, 12719–12723 [DOI] [PMC free article] [PubMed] [Google Scholar]
- 38. Tomitani A., Okada K., Miyashita H., Matthijs H. C., Ohno T., and Tanaka A. (1999) Chlorophyll b and phycobilins in the common ancestor of cyanobacteria and chloroplasts. Nature 400, 159–162 [DOI] [PubMed] [Google Scholar]
- 39. Maresca J. A. (2007) The genetic basis for pigment variation among green sulfur bacteria. Ph.D. thesis, The Pennsylvania State University [Google Scholar]
- 40. Llorens-Marès T., Liu Z., Allen L. Z., Rusch D. B., Craig M. T., Dupont C. L., Bryant D. A., and Casamayor E. O. (2017) Speciation and ecological success in dimly lit waters: horizontal gene transfer in a green sulfur bacteria bloom unveiled by metagenomic assembly. ISME J. 11, 201–211 [DOI] [PMC free article] [PubMed] [Google Scholar]
- 41. Yang J., Kulkarni K., Manolaridis I., Zhang Z., Dodd R. B., Mas-Droux C., and Barford D. (2011) Mechanism of isoprenylcysteine carboxylmethylation from the crystal structure of the integral membrane methyltransferase ICMT. Mol. Cell 44, 997–1004 [DOI] [PubMed] [Google Scholar]
- 42. Maresca J. A., Romberger S. P., and Bryant D. A. (2008) Isorenieratene biosynthesis in green sulfur bacteria requires the cooperative actions of two carotenoid cyclases. J. Bacteriol. 190, 6384–6391 [DOI] [PMC free article] [PubMed] [Google Scholar]
- 43. Wang J., Woldring R. P., Román-Meléndez G. D., McClain A. M., Alzua B. R., and Marsh E. N. (2014) Recent advances in radical SAM enzymology: new structures and mechanisms. ACS Chem. Biol. 9, 1929–1938 [DOI] [PMC free article] [PubMed] [Google Scholar]
- 44. Ouchane S., Steunou A.-S., Picaud M., and Astier C. (2004) Aerobic and anaerobic Mg-protoporphyrin monomethyl ester cyclases in purple bacteria. J. Biol. Chem. 279, 6385–6394 [DOI] [PubMed] [Google Scholar]
- 45. Chen G. E., Canniffe D. P., Martin E. C., and Hunter C. N. (2016) Absence of the cbb3 terminal oxidase reveals an active oxygen-dependent cyclase involved in bacteriochlorophyll biosynthesis in Rhodobacter sphaeroides. J. Bacteriol. 198, 2056–2063 [DOI] [PMC free article] [PubMed] [Google Scholar]
- 46. Harada J., Mizoguchi T., Satoh S., Tsukatani Y., Yokono M., Noguchi M., Tanaka A., and Tamiaki H. (2013) Specific gene bciD for C7-methyl oxidation in bacteriochlorophyll e biosynthesis of brown-colored green sulfur bacteria. PLoS One 8, e60026. [DOI] [PMC free article] [PubMed] [Google Scholar]
- 47. Imhoff J. F. (2003) Phylogenetic taxonomy of the family Chlorobiaceae on the basis of 16S rRNA and fmo (Fenna-Matthews-Olson protein) gene sequences. Int. J. Syst. Evol. Microbiol. 53, 941–951 [DOI] [PubMed] [Google Scholar]
- 48. Lanz N. D., Grove T. L., Gogonea C. B., Lee K. H., Krebs C., and Booker S. J. (2012) RlmN and AtsB as models for the overproduction and characterization of radical SAM proteins. Methods Enzymol. 516, 125–152 [DOI] [PubMed] [Google Scholar]
- 49. Yoon K.-S., Bobst C., Hemann C. F., Hille R., and Tabita F. R. (2001) Spectroscopic and functional properties of novel 2[4Fe4S] cluster-containing ferredoxins from the green sulfur bacterium Chlorobium tepidum. J. Biol. Chem. 276, 44027–44036 [DOI] [PubMed] [Google Scholar]
- 50. Seo D., Tomioka A., Kusumoto N., Kamo M., Enami I., and Sakurai H. (2001) Purification of ferredoxins with purified reaction center complex from the green sulfur bacterium Chlorobium tepidum. Biochim. Biophys. Acta 1503, 377–384 [DOI] [PubMed] [Google Scholar]
- 51. Oster U., Bauer C. E., and Rüdiger W. (1997) Characterization of chlorophyll a and bacteriochlorophyll a synthetases by heterologous expression in E. coli. J. Biol. Chem. 272, 9671–9676 [DOI] [PubMed] [Google Scholar]
- 52. Suzuki J. Y., Bollivar D. W., and Bauer C. E. (1997) Genetic analysis of chlorophyll biosynthesis. Annu. Rev. Genet. 31, 61–89 [DOI] [PubMed] [Google Scholar]
- 53. Saga Y., Hirota K., Harada J., and Tamiaki H. (2015) In vitro enzymatic activities of bacteriochlorophyll a synthase derived from the green sulfur photosynthetic bacterium Chlorobaculum tepidum. Biochemistry 54, 4998–5005 [DOI] [PubMed] [Google Scholar]
- 54. Montesinos E., Guerrero R., Abella C., and Esteve I. (1983) Ecology and physiology of the competition for light between Chlorobium limicola and Chlorobium phaeobacteroides. Appl. Environ. Microbiol. 46, 1007–1016 [DOI] [PMC free article] [PubMed] [Google Scholar]
- 55. Vila X., and Abella C. A. (2001) Light-harvesting adaptations of planktonic phototrophic microorganisms to different light quality conditions. Hydrologia 452, 15–30 [Google Scholar]
- 56. van Gemerden H., and Mas J. (1995) Ecology of phototrophic sulfur bacteria. In Advances in Photosynthesis and Respiration, Vol. 2 (Blankenship R. E., Madigan M. T., and Bauer C. E., eds) pp. 49–85, Springer, Dordrecht, Netherlands [Google Scholar]
- 57. Liu Z., Klatt C. G., Ludwig M., Rusch D. B., Jensen S. I., Kühl M., Ward D. M., and Bryant D. A. (2012) “Candidatus Thermochlorobacter aerophilum”: an aerobic chlorophotoheterotrophic member of the phylum Chlorobi. ISME J. 6, 1869–1882 [DOI] [PMC free article] [PubMed] [Google Scholar]
- 58. Tank M., Thiel V. Ward D. M., and Bryant D. A. (2016) A panoply of phototrophs: a photomicrographic overview of chlorophototrophs found in the microbial mats of alkaline siliceous hot springs in Yellowstone National Park, WY, U.S.A. In Modern Topics in the Phototrophic Prokaryotes: Environmental and Applied Aspects (Hallenbeck P. C., ed) Springer, Berlin, in press. [Google Scholar]
- 59. Akiva E., Brown S., Almonacid D. E., Barber A. E. 2nd, Custer A. F., Hicks M. A., Huang C. C., Lauck F., Mashiyama S. T., Meng E. C., Mischel D., Morris J. H., Ojha S., Schnoes A. M., Stryke D., et al. (2014) The structure-function linkage database. Nucleic Acids Res. 42, D521–D530 [DOI] [PMC free article] [PubMed] [Google Scholar]
- 60. Wahlund T. M., and Madigan M. T. (1995) Genetic transfer by conjugation in the thermophilic green sulfur bacterium. Chlorobium tepidum. J. Bacteriol. 177, 2583–2588 [DOI] [PMC free article] [PubMed] [Google Scholar]
- 61. Frigaard N.-U., and Bryant D. A. (2001) Chromosomal gene inactivation in the green sulfur bacterium Chlorobium tepidum by natural transformation. Appl. Environ. Microbiol. 67, 2538–2544 [DOI] [PMC free article] [PubMed] [Google Scholar]
- 62. Simon R., Priefer U., and Pühler A. (1983) A broad host range mobilization system for in vivo genetic engineering: transposon mutagenesis in Gram-negative bacteria. Nat. Biotechnol. 1, 784–791 [Google Scholar]
- 63. Zheng L., Cash V. L., Flint D. H., and Dean D. R. (1998) Assembly of iron-sulfur clusters: identification of an iscSUA-hscBA-fdx gene cluster from Azotobacter vinelandii. J. Biol. Chem. 273, 13264–13272 [DOI] [PubMed] [Google Scholar]
- 64. Delli-Bovi T. A., Spalding M. D., and Prigge S. T. (2010) Overexpression of biotin synthase and biotin ligase is required for efficient generation of sulfur-35 labeled biotin in E. coli. BMC Biotechnol. 10, 73. [DOI] [PMC free article] [PubMed] [Google Scholar]
- 65. Shen G., and Bryant D. A. (1995) Characterization of a Synechococcus sp. strain PCC 7002 mutant lacking Photosystem I: protein assembly and energy distribution in the absence of the photosystem I reaction center core complex. Photosynth. Res. 44, 41–53 [DOI] [PubMed] [Google Scholar]
- 66. Ho M.-Y., Gan F., Shen G., and Bryant D. A. (2016) Far-red light photoacclimation (FaRLiP) in Synechococcus sp. PCC 7335. II. Characterization of phycobiliproteins produced during acclimation to far-red light. Photosynth. Res. 10.1007/s11120-016-0303-5 [DOI] [PubMed] [Google Scholar]
- 67. Bradford M. (1976) A rapid and sensitive method for the quantitation of microgram quantities of protein utilizing the principle of protein-dye binding. Anal. Biochem. 72, 248–254 [DOI] [PubMed] [Google Scholar]
- 68. Zhao J. D., Warren P. V., Li N., Bryant D. A., and Golbeck J. H. (1990) Reconstitution of electron transport in Photosystem I with PsaC and PsaD proteins expressed in Escherichia coli. FEBS Lett. 276, 175–180 [DOI] [PubMed] [Google Scholar]
- 69. Lovenberg W., Buchanan B. B., and Rabinowitz J. C. (1963) Studies on the chemical nature of clostridial ferredoxin. J. Biol. Chem. 238, 3899–3913 [PubMed] [Google Scholar]
- 70. Frigaard N.-U., Takaichi M., Hirota K., Shimada K., and Matsuura K. (1997) Quinones in chlorosomes of green sulfur bacteria and their role in the redox-dependent fluorescence studied in chlorosome-like bacteriochlorophyll c aggregates. Arch. Microbiol. 167, 343–349 [Google Scholar]
- 71. Borrego C. M., and Garcia-Gil L. J. (1994) Separation of bacteriochlorophyll homologues from green photosynthetic bacteria by reversed-phase HPLC. Photosynth. Res. 41, 157–164 [DOI] [PubMed] [Google Scholar]
- 72. Borrego C. M., Gerola P. D., Miller M., and Cox R. P. (1999) Light intensity effects on pigment composition and organization in the green sulfur bacterium Chlorobium tepidum. Photosynth. Res. 59, 159–166 [Google Scholar]
- 73. Mallorquí N., Arellano J. B., Borrego C. M., and Garcia-Gil L. J. (2005) Signature pigments of green sulfur bacteria in lower Pleistocene deposits from the Banyoles lacustrine area (Spain). J. Paleolimnol. 34, 271–280 [Google Scholar]
- 74. Jones D. T., Taylor W. R., and Thornton J. M. (1992) The rapid generation of mutation data matrices from protein sequences. Comput. Appl. Biosci. 8, 275–282 [DOI] [PubMed] [Google Scholar]
- 75. Kumar S., Stecher G., and Tamura K. (2016) MEGA7: Molecular Evolutionary Genetics Analysis version 7.0 for bigger datasets. Mol. Biol. Evol. 33, 1870–1874 [DOI] [PMC free article] [PubMed] [Google Scholar]