

Abstract
GPRC6A is a G protein-coupled receptor activated by l-amino acids, which, based on analyses of knock-out mice, has been suggested to have physiological functions in metabolism and testicular function. The human ortholog is, however, mostly retained intracellularly in contrast to the cell surface-expressed murine and goldfish orthologs. The latter orthologs are Gq-coupled and lead to intracellular accumulation of inositol phosphates and calcium release. In the present study we cloned the bonobo chimpanzee GPRC6A receptor, which is 99% identical to the human receptor, and show that it is cell surface-expressed and functional. By analyses of chimeric human/mouse and human/bonobo receptors, bonobo receptor mutants, and the single nucleotide polymorphism database at NCBI, we identify an insertion/deletion variation in the third intracellular loop responsible for the intracellular retention and lack of function of the human ortholog. Genetic analyses of the 1000 genome database and the Inter99 cohort of 6,000 Danes establish the distribution of genotypes among ethnic groups, showing that the cell surface-expressed and functional variant is much more prevalent in the African population than in European and Asian populations and that this variant is partly linked with a stop codon early in the receptor sequence (rs6907580, amino acid position 57). In conclusion, our data solve a more than decade-old question of why the cloned human GPRC6A receptor is not cell surface-expressed and functional and provide a genetic framework to study human phenotypic traits in large genome sequencing projects linked with physiological measurement and biomarkers.
Keywords: 7-helix receptor, cell surface receptor, G protein-coupled receptor (GPCR), human genetics, molecular pharmacology, GPRC6A receptor, third intracellular loop
Introduction
Communication between the exterior and interior of cells is essential for cellular survival. A pivotal class of proteins, specialized to carry out such signal transduction, is the G protein-coupled receptors (GPCRs),2 a family that includes ∼800 subtypes in humans. The GPCR class C, group 6, member A (GPRC6A) belongs to the non-olfactory GPCRs as part of the class C receptors. Human GPRC6A (h6A) was cloned from a human kidney cDNA library in 2004 (1). Cloning and deorphanization of the mouse (2, 3) and rat (4) GPRC6A orthologs rapidly followed. These studies, together with recent evidence (5) support the existence of GPRC6A as a dimer on the cell surface. However, surprisingly, h6A has been shown to be retained intracellularly and thus does not respond to agonists, which contrasts findings for the mouse, rat, and goldfish orthologs (2, 3, 6). To deorphanize h6A, we generated chimeras between the human and goldfish GPRC6A orthologs. We found that a fusion of the human large extracellular amino-terminal domain (ATD) to the 7-transmembrane (7TM) and C-terminal domains of the orthologous goldfish 5.24 receptor allowed efficient surface expression of the chimera and thereby a way to test a range of potential ligands targeting the h6A ATD. The reverse construct (5.24 ATD + human 7TM-C-terminal) did not express on the cell surface, suggesting that part of the 7TM and/or C-terminal region of h6A prevents surface expression (3). Using these chimeras it was shown that h6A is a promiscuous l-α-amino acid receptor, most potently activated by the basic amino acids l-arginine, l-lysine, and l-ornithine (3). Other groups later confirmed these agonists on mouse GPRC6A (m6A) using various experimental systems (2, 7, 8). Divalent cations such as Ca2+ and Mg2+ have also been suggested to function either as positive allosteric modulators (2, 9) or as direct, endogenous agonists on m6A (10, 11). The steroid testosterone and the peptide osteocalcin have also been suggested as endogenous agonists on m6A (12–14); however, we and others have been unable to confirm this (6, 11).
GPRC6A shows wide tissue distribution, which, combined with the diverse range of suggested endogenous ligands, has led to speculations of involvement in a broad range of physiological functions (15, 16). Because of a lack of potent and selective ligands, these suggested functions have mainly been investigated by phenotyping of knock-out mice where the gene function has been destroyed by deletion of exon 6 (Bräuner-Osborne group (17)), exon 2 (Quarles (18) and Karsenty (14) groups), or the full gene (Murphy (19) and Bräuner-Osborne groups (20)). Under normal physiological conditions, these mouse strains have shown very different phenotypes. Thus, although we and the Murphy group have not observed any significant metabolic phenotypes (17, 19–23), the Quarles and Karsenty groups have reported complex metabolic and testicular phenotypes in their mouse strains (13, 14, 18, 24–26). The reason for these discrepancies remain unknown, but it is evident that the exon 2 knock-out mice show much more pronounced phenotypes than the exon 6 and whole gene knock-out mice.
In the present study we localize the cause of the intracellular retention of h6A to the third intracellular loop (ICL3), which is two amino acids shorter in h6A than all other species for which there is sequence information available. We also provide genetic data to show that the short h6A ICL3 loop is a result of an insertion/deletion variation. The insertion/deletion variation in ICL3 is partly linked to a single nucleotide polymorphism (SNP), causing an early gene stop codon in European and Asian populations. Furthermore, we use a Danish human cohort to make a preliminary assessment of metabolic and testicular phenotypic traits of the different GPRC6A genotypes.
Results
Chimeric Mouse/Human GPRC6A Receptors Show ICL3 Is Pivotal for Cell Surface Expression and Function
Human and mouse GPRC6A share 80% amino acid identity; however, h6A is very poorly surface-expressed compared with the mouse, rat, and goldfish orthologs (Fig. 1A and Refs. 1, 3, 4, and 6). We know from previous chimeric receptor studies that the domain(s) preventing surface expression of h6A is located in the 7TM and/or C-terminal region of h6A (3). It is well established that particularly the third intracellular loop (ICL3) and the C-terminal tail play important roles for receptor signaling and trafficking (27), and we therefore focused our studies on these regions. We generated an array of human/mouse chimeras, systematically substituting the ICL3 region and/or C-terminal tail of h6A with the corresponding regions from m6A. By analyzing cell surface expression of these amino-terminally c-Myc-tagged chimeras with ELISA, we found that the ICL3 from m6A enables surface expression of the chimeric constructs, whereas the C-terminal region of m6A does not promote this (Fig. 1A). The GABAB system was used as a positive control in ELISA, because the GABAB1 construct cannot express on the cell surface unless it is co-expressed with GABAB2. Total receptor expression was determined after permeabilization with the detergent Triton X-100 and used to calculate the ratio between surface and total receptor expression as shown in the figures (28). Because m6A, in our hands, signals via the Gq pathway (11), we then tested the functional importance of ICL3 and the C-terminal tail in an IP-One assay, which measures the accumulation of d-myo-inositol monophosphate (IP1) as a consequence of Gq activation (5). We have previously shown that the co-transfection with Gαq(G66D) boosts the m6A response (5, 9) without changing the pharmacological profile of the m6A receptor (10, 11). We found that mouse ICL3 is essential for functionality of the receptor when cells were stimulated with l-ornithine, whereas the C-terminal part of m6A had no positive effect on the functionality of the chimeras (Fig. 1B and Table 1).
FIGURE 1.
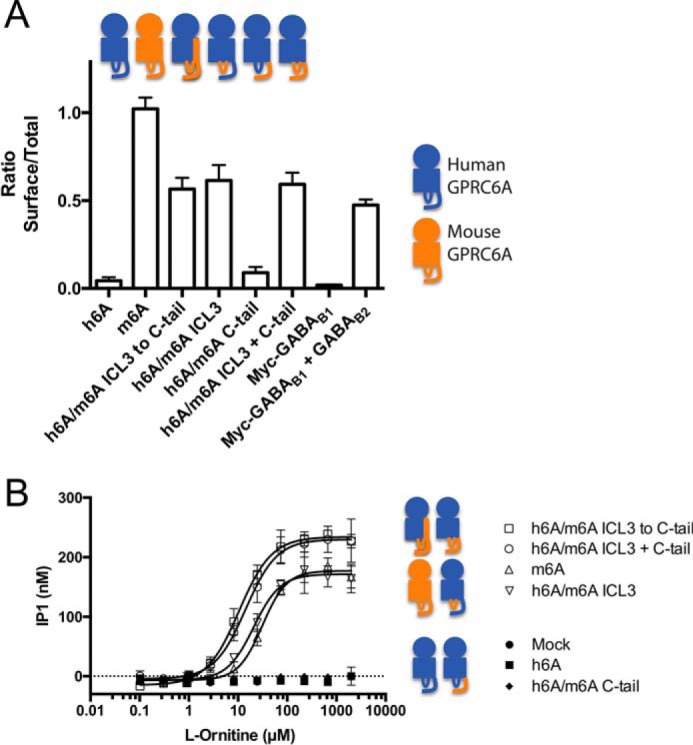
Mouse ICL3 allows surface expression and function of human/mouse GPRC6A chimera. A, c-Myc tagged GPRC6A constructs were expressed for 48 h in HEK293T cells and analyzed by ELISA. Shown is the ratio between surface and total expression of receptor constructs (n = 4). The GABAB system is used as a control for surface and total expression because c-Myc-tagged GABAB1 is only expressed on the cell surface when co-expressed with GABAB2. B, constructs were expressed as in A, stimulated with l-ornithine, and analyzed functionally using the IP-One assay measuring accumulation of IP1. The graph shown is one representative experiment (see Table 1 for averaged means of multiple experiments). The cartoons above/next to the graphs illustrate the different receptor constructs. Circle, amino-terminal domain; square, transmembrane region; loop, ICL3 domain; tail, C-terminal tail; blue, human GPRC6A; orange, mouse GPRC6A. The data are means ± S.E.
TABLE 1.
l-Ornithine activation of human, mouse, and chimeric GPRC6A
The table is based on results from three independent IP1 accumulation assays performed as in Fig. 1B. NA, no activity in the assay; CI, confidence interval.
| pEC50 ± S.E. | EC50 | 95% CI | |
|---|---|---|---|
| μm | μm | ||
| h6A | NA | ||
| m6A | 4.40 ± 0.07 | 40.2 | 29.2–55.5 |
| h6A/m6A_ICL3 to C-tail | 4.82 ± 0.08 | 15.0 | 10.5–21.4 |
| H6A/m6A_ICL3 | 4.64 ± 0.08 | 23.0 | 16.2–32.7 |
| h6A/m6A_C-tail | NA | ||
| h6A/m6A_ICL3 + C-tail | 4.81 ± 0.09 | 15.5 | 10.4–23.2 |
Bonobo Chimpanzee GPRC6A Receptor Is Cell Surface-expressed and Functional, Further Evidence of Importance of ICL3
To corroborate the above finding, we aligned the amino acid sequences of human and mouse ICL3 to search for specific differences between the two orthologs. We also searched for orthologs with even greater sequence identity to human GPRC6A and found that bonobo (Pan paniscus) GPRC6A (b6A) is 99% identical to h6A (data not shown). Interestingly, we found a major difference between h6A and b6A located in the ICL3 region, where four amino acids differ between the two orthologs (Fig. 2A). Another four amino acid differences were located in the ATD and the transmembrane helix VII (TMVII; Fig. 2B). Intriguingly, we found that the bonobo ICL3 sequence was identical to the mouse ICL3, which led us to hypothesize that b6A may be expressed better on the surface than h6A. We therefore had the full sequence of b6A synthesized and cloned into the pEGFP-N1 expression vector. The sequence regions that differed between h6A and b6A were later verified by amplification and sequencing of the corresponding exons from genomic bonobo DNA (data not shown). In support of our hypothesis we found that b6A was expressed on the cell surface to the same extent as m6A when analyzed by ELISA (Fig. 2C).
FIGURE 2.

Eight amino acids differ between human and bonobo GPRC6A. A, sequence alignment of human, mouse, and bonobo GPRC6A ICL3 regions, where bonobo GPRC6A ICL3 is identical to mouse GPRC6A ICL3. B, four amino acid differences are found in the amino-terminal domain (R222Q, Q374R, and Q546E) and transmembrane helix VII (Y829C). C, human, mouse, and bonobo GPRC6A constructs were expressed in HEK293T cells prior to ELISA assay. Shown is the ratio between the surface and total receptor expression (n = 3). The data are means ± S.E.
To understand which amino acids that contribute to the dramatic difference in surface expression between h6A and b6A, we mutated the eight amino acids in the bonobo sequence into the corresponding human counterparts. Mutation of one or all three amino acids located in the extracellular amino-terminal domain (Gln222, Arg374, or Glu546) did not reduce surface expression of b6A; neither did mutation of Cys829 in the TMVII (Fig. 3A). However, mutation of the ICL3 sequence from wild type b6A sequence (KGRKLP) into the shorter h6A (KGKY) sequence resulted in a marked reduction in surface expression (compare bar 3 (b6A) with bar 9 (b6A_KGKY); Fig. 3A). Importantly, when we performed the opposite experiment and mutated the short ICL3 in h6A into the long, a pronounced surface expression of h6A was achieved (compare bar 1 (h6A) with bar 12 (h6A_KGRKLP; Fig. 3A). To assay the functional impact of mutating the ICL3, we then tested b6A, b6A_KGKY, and h6A_KGRKLP constructs in the IP1 accumulation assay. When tested against a fixed concentration of l-arginine, we found that b6A was active in the IP1 accumulation assay, albeit not to the same extent as m6A. Mutation of the ICL3 sequence into the short human version in b6A resulted in loss of functionality, whereas insertion of the long ICL3 in h6A rendered this mutant functional to the same extent as b6A (Fig. 3B). These data identify the ICL3 region as pivotal in dictating both surface expression and functionality in bonobo and human GPRC6A. In addition, we observe a significant boost of the h6A_KGRKLP response by co-transfection with Gαq(G66D) (Fig. 3B) as we have previously done for m6A (5, 9).
FIGURE 3.

ICL3 is pivotal for surface expression and functionality. A, GPRC6A constructs were expressed in HEK293T cells and analyzed by ELISA. The GABAB system was used as control. Shown is the ratio between surface and total receptor expression. B, GPRC6A constructs were co-expressed with Gαq(G66D) in HEK293T cells and stimulated with 2 mm l-arginine, and receptor function was analyzed using the IP1 accumulation assay. Shown is fold increase compared with the h6A response. Black crosses in the cartoons above the graph indicates where mutations were generated, either in the amino-terminal domain, transmembrane domain, or ICL3 (n = 3). C, mRNA expression of h6A in HEK293T cells co-transfected with Gαq(G66D) measured by real time qPCR (n = 2). The housekeeping gene GAPDH was used as control. All data are means ± S.E.
To exclude that the observed responses were mediated by endogenously expressed h6A in the HEK293T cells we (a) mock transfected cells with the Gαq(G66D) and observed no response (Fig. 1B) and (b) performed real time qPCR of h6A using two different primer pairs (both detecting all ICL3 variants) in mock and h6A_KGRKLP and h6A_KGKY transfected HEK293T cells and found cycle threshold values of ∼30 in mock transfected cells and ∼15 in h6A transfected cells (Fig. 3C). Collectively, these data show that h6A is endogenously expressed in HEK293T cells at very low levels, which does not affect the functional responses observed in GPRC6A transfected cells.
l-α-Amino acids have previously been identified as h6A agonists using h6A/5.24 chimeric constructs (3); however, we wished to rank the reported agonists according to potency on the surface-expressed and functional version of h6A (h6A_KGRKLP). We therefore tested the 20 proteinogenic l-α-amino acids in addition to l-ornithine (3) in one fixed concentration and selected the 10 most potent agonists for generation of full concentration-response curves. We found that l-ornithine, l-arginine, and l-lysine were the most potent agonists on h6A_KGRKLP (Table 2) in accordance with previous results on m6A (6, 11).
TABLE 2.
Agonist pharmacology of l-α-amino acids at the long ICL3_KGRKLP human GPRC6A variant
The long ICL3_KGRKLP GPRC6A construct was co-expressed with Gαq(G66D) in HEK293T cells and stimulated with the indicated l-α-amino acids, and functional responses were measured using the IP1 accumulation assay (n = 3).
| EC50 (pEC50 ± S.E.) | Maximum response ± S.E.a | |
|---|---|---|
| μm (m) | % | |
| l-Ornithine | 8.8 (5.06 ± 0.03) | 100 |
| l-Arg | 12.6 (4.90 ± 0.17) | 108 ± 14 |
| l-Lys | 15.6 (4.81 ± 0.09) | 80 ± 10 |
| l-Gly | 31.9 (4.50 ± 0.02) | 95 ± 6 |
| l-Ala | 45.4 (4.36 ± 0.05) | 101 ± 10 |
| l-Ser | 154.3 (3.81 ± 0.09) | 92 ± 7 |
| l-Met | 294.5 (3.53 ± 0.09) | 90 ± 7 |
| l-Glu | 386.1 (3.41 ± 0.06) | 106 ± 6 |
| l-Thr | 462.0 (3.34 ± 0.08) | 80 ± 10 |
| l-Asp | >1000 | 63 ± 6 |
a The maximal responses were calculated as percentages of the maximum response to that observed for 10 mm l-ornithine in the same experiment (set to 100%). For compounds with low activities (EC50 values > 1000 μm), relative efficacies were calculated as percentages of response at 10 mm for the compound divided by the response for l-ornithine at 10 mm.
Human Genetic Variants Exist in ICL3 of GPRC6A and Control Cell Surface Expression and Function
Our in vitro studies suggest a crucial role for h6A ICL3. To examine the biological significance of these findings, we therefore searched human sequence databases for evidence of insertions and/or deletions in this region. We found reports of three such variants in the SNP database at the National Center for Biotechnology Information, verifying the existence of individuals with ICL3 regions corresponding to KGRKY (rs368671066 and rs111974433), KGKKLY (rs148346142), and KGRKLP (rs386705086) (Fig. 4A). We were intrigued to find evidence of the functional and cell surface-expressed KGRKLP ICL3 loop in humans. To determine whether the specific sequence and/or length of the ICL3 region played an important role in surface expression and functionality, we generated the two other ICL3 variants KGRKY and KGKKLY. The ELISA and IP1 accumulation assay results in Fig. 4 (B and C) showed that surface expression and function of these two variants were greatly reduced compared with the h6A_KGRKLP variant. Together these data suggest that a random increase in the length of the third intracellular loop is not enough to improve surface expression and/or functionality; this is dependent on the specific sequence of the ICL3 region.
FIGURE 4.
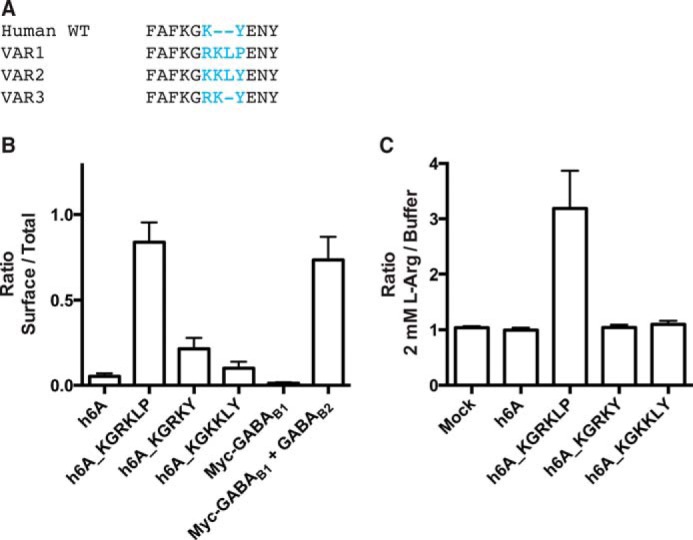
The ICL3 amino acid sequence dictates if human GPRC6A (h6A) is cell surface-expressed and functional. A, a search in the NCBI SNP database identified three variants of the human ICL3. Shown is an alignment of the published, short ICL3_KGKY variant, as well as the three longer variants. B, receptors expressing the four different ICL3 variants were expressed in HEK293T cells, and surface expression was analyzed using ELISA. Shown is the ratio between surface and total receptor expression. C, cells transfected as in B were used to assay the functional importance of the ICL3 region. GPRC6A constructs were expressed in HEK293T cells and stimulated with 2 mm l-arginine, and receptor function was analyzed using the IP1 accumulation assay. Shown is fold increase compared with the h6A response (n = 3). The data are means ± S.E.
To demonstrate that the observed functional differences between these h6A genetic variants (Fig. 4C) and the key human/mouse receptor chimeras (Fig. 1B) were not caused by differences in Gαq(G66D) function, we co-transfected the receptor constructs with Gαq(G66D) in Gαq/11-null HEK293 cells generated by CRISPR/Cas9 gene editing (29). As shown in Fig. 5A, 2 mm l-arginine show the same activation pattern as observed in the HEK293T WT cells. Importantly, activation of Gαq(G66D) via the endogenously expressed muscarinic acetylcholine M3 receptor gave consistent responses for all receptor constructs (Fig. 5B), demonstrating that the observed differences in GPRC6A activations are not caused by differences in Gαq(G66D) function.
FIGURE 5.

Mouse and human GPRC6A chimeras/variants characterized in Gαq/11-null HEK293 cells. Gαq/11-null HEK293 cells were co-transfected with the indicated mouse/human GPRC6A receptor chimeras/variants and Gαq(G66D). Mock cells were transfected with empty vector. Transfected cells were stimulated with 2 mm l-arginine (A) or 100 μm carbachol (CCh) (B) to activate GPRC6A or endogenously expressed muscarinic acethylcholine M3 receptor, respectively, and receptor function was analyzed using the IP1 accumulation assay. Shown is fold increase compared with the buffer level. The data demonstrate that the observed differences in functional responses to 2 mm l-arginine were not caused by differences in Gαq(G66D) function as evidenced by the consistent functional M3 receptor responses. The data are means ± S.D. of a representative experiment performed in triplicate. One additional experiment gave similar results.
To corroborate the findings of the h6A genetic variants, we expanded our database searches to include data from 1000 Genomes phase III (1KG (30)), the Exome Variant Server (EVS, NHLBI GO Exome Sequencing Project, Seattle, WA) (31) and deep targeted next generation sequencing of GPRC6A in the Danish Inter99 population sample (32) (CT00289237, ClinicalTrials.gov) to estimate the frequency of the different alleles among human populations.
Fig. 6A is a schematic presentation of the haplotypes that are defined analyzing the human GPRC6A genetic variants in the present study. The surface-expressed KGRKLP variant (rs386705086) is present in both 1KG and the Inter99 data sets; however, it is not present in the EVS, whereas the KGKKLY variant (rs148346142) is only found in the EVS data set. We did not find any reports of the medium length variant KGRKY (rs368671066 and rs111974433) in any of these data sets, suggesting that the frequency of this variant is very low.
FIGURE 6.
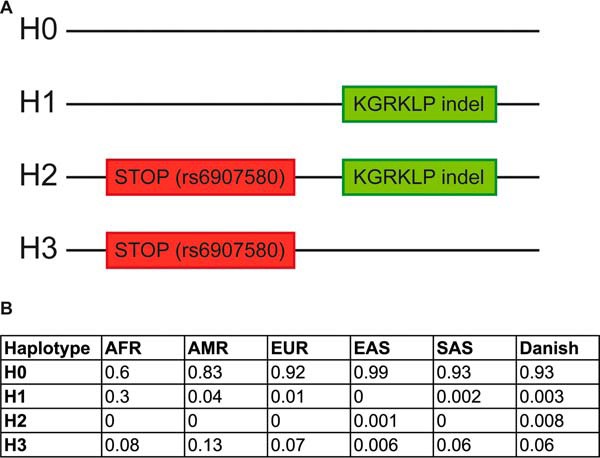
GPRC6A haplotypes. A, the figure shows the four different GPRC6A haplotypes found in human populations. H0 is the wild type haplotype (ICL3_KGKY), which is not surface-expressed. Only haplotype H1 can be surface-expressed, because H2 and H3 are truncated by a premature stop codon (rs6907580). B, the frequencies of the four haplotypes in individuals from 1000 Genomes phase III release 20130502 (1KG) divided into the predefined super-populations, African (AFR), European (EUR), American (AMR), South Asian (SAS), and East Asian (EAS), as well their frequency in the Danish population.
ICL3 Genetic Variant Frequency Differ among Geographical Groups and Is in Linkage with a SNP Conferring a Premature Stop Codon
Data from the 1KG database can be sorted into specific subpopulations, whereas the Inter99 data originates from a Danish population sample (Fig. 6B). Interestingly, we found that the KGRKLP variant is much more frequent among the African population compared with all other geographical groups represented (Fig. 6B, AFR). Our studies also revealed that the KGRKLP indel very often is linked with the rs6907580 SNP located in the first exon of the h6A gene changing a C into a T (amino acid position 57 in h6A, depicted in Fig. 6A, H2 and H3). This SNP results in a premature stop codon and thereby most consequently a non-functional receptor protein. Our data suggest a strong linkage between the STOP-SNP and the indel among the American (r2 = 0.73, D′ = 1), European (r2 = 0.83, D′ = 1), East Asian (r2 = 0.86, D′ = 1), and South Asian (r2 = 0.97, D′ = 1) populations because the H1 haplotype where the indel occurs alone is rare in these populations. This is, however, not the case for the African population where there is less linkage disequilibrium between the STOP-SNP and the indel (r2 = 0.926, D′ = 0.996) and the frequency of the H1 haplotype is as high as 30%.
Metabolic and Testicular Phenotypic Traits of Different Genotypes in a Danish Cohort
It is evident from the analyses above that the ICL3 genetic variant and premature STOP-SNP allow testing of human phenotypic traits in large cohorts where the GPRC6A exons have been sequenced (because the ICL3 variant is not detectable in a SNP analyses). The need for high quality GPRC6A exon sequences unfortunately limits the number of cohorts available for study, but as a preliminary analysis we chose to analyze the Danish Inter99 cohort where we recently sequenced the GPRC6A exons. As evident from Tables 3 and 4, the number of males/females with two STOP-SNP alleles or one functional long KGRKLP allele (without the STOP-SNP) is quite rare in the Danish population, lowering the statistical power of our study. Our findings should thus be interpreted with great caution and repeated in larger cohorts and/or in African populations when such cohorts with sequenced GPRC6A exons annotated with physiological data become available.
TABLE 3.
Selected phenotypic traits in STOP codon alleles versus wild type h6A alleles
No changes were observed in metabolic profile or body composition of male h6A knockouts. The effect of selected measures of metabolism and testicular phenotypes in a European population are compared between the group having only wild type alleles (ICL3_KGKY) versus the group being homozygous for the rs6907580 STOP-SNP allele in men and women. The female carriers have markedly higher insulin resistance, although the effect is carried by only three individuals and should be interpreted with caution. The knockout and wild type values are the means ± S.E. The selected phenotypic traits were analyzed between people with two STOP codon alleles (knockouts with only H2 or H3 haplotypes) versus wild type people carrying two copies of the short variant H0/H0. Serum insulin is measured in pmol/liter, plasma glucose is measured in mmol/liter, testosterone is measured in nmol/liter, and serum triglycerides are measured in mmol/liter.
| Phenotype | N | Knockout (STOP codon) | Wild type (short variant) | p value |
|---|---|---|---|---|
| Men | ||||
| BMI | 10/2225 | 27.75 ± 1.05 | 26.89 ± 0.09 | 0.5043 |
| Fasting serum insulin | 9/2041 | 41.44 ± 5.63 | 45.05 ± 0.66 | 0.8543 |
| 30-min serum insulin | 10/2029 | 275.20 ± 39.75 | 308.71 ± 4.43 | 0.8180 |
| 2-h serum insulin | 9/2050 | 130.11 ± 29.95 | 210.84 ± 4.74 | 0.1823 |
| Fasting plasma glucose | 10/2121 | 5.73 ± 0.1 | 5.73 ± 0.02 | 0.8626 |
| 30-min plasma glucose | 10/2095 | 8.83 ± 0.78 | 9.26 ± 0.04 | 0.2651 |
| 2-h plasma glucose | 10/2113 | 5.54 ± 0.69 | 6.22 ± 0.05 | 0.1864 |
| HOMA-IR | 9/2039 | 1.73 ± 0.21 | 1.96 ± 0.03 | 0.8545 |
| ISI Matsuda | 8/1899 | 7.85 ± 1.09 | 8.18 ± 0.11 | 0.6686 |
| Insulinogenic index | 9/1953 | 31.16 ± 5.30 | 29.01 ± 0.44 | 0.4877 |
| Has children | 10/2225 | 0.80 ± 0.13 | 0.86 ± 0.01 | 0.5618 |
| Testosterone | 10/2165 | 14.95 ± 0.78 | 15.23 ± 0.12 | 0.8036 |
| Serum triglycerides | 10/2224 | 1.27 ± 0.25 | 1.57 ± 0.03 | 0.3586 |
| Women | ||||
| BMI | 4/2260 | 28.52 ± 2.37 | 25.72 ± 0.10 | 0.2546 |
| Fasting serum insulin | 3/1995 | 59.33 ± 20 | 40.22 ± 0.58 | 0.1582 |
| 30-min serum insulin | 2/1936 | 337 ± 95.53 | 283.86 ± 3.65 | 0.4776 |
| 2-h serum insulin | 3/2004 | 410.33 ± 109.48 | 230.96 ± 4.61 | 0.0463 |
| Fasting plasma glucose | 3/2073 | 6.33 ± 1.24 | 5.37 ± 0.02 | 0.0235 |
| 30-min plasma glucose | 3/2009 | 10.77 ± 2.23 | 8.23 ± 0.04 | 0.0317 |
| 2-h plasma glucose | 3/2069 | 10.90 ± 3.23 | 6.27 ± 0.04 | 0.0006a |
| HOMA-IR | 3/1995 | 3.13 ± 1.51 | 1.64 ± 0.03 | 0.0785 |
| ISI Matsuda | 2/1824 | 2.73 ± 0.58 | 8.75 ± 0.11 | 0.0019 |
| Insulinogenic index | 2/1871 | 33.62 ± 20.20 | 30.4 ± 0.41 | 0.7691 |
| Serum triglycerides | 4/2261 | 1.18 ± 0.19 | 1.15 ± 0.01 | 0.6290 |
a p < 0.05 after adjusting for multiple tests (family wise error rate).
TABLE 4.
Male carriers of surface-expressed GPRC6A displays increased first phase insulin response in an oral glucose tolerance test
The effect of selected measures of metabolism and testicular phenotypes in a European population are compared between the group having only wild type alleles (H0 haplotype, ICL3_KGKY) versus the group having at least one surface-expressed allele ICL3_KGRKLP (H1 haplotype) in men and women. The only detectable difference is an increased first phase insulin response in male carriers, which is not observed in female carriers. The selected phenotypic traits were analyzed between people with a possibly functional long variant not truncated by the STOP codon variant, i.e., H1/H0 versus wild type people carrying only the short variant H0/H0. Serum insulin is measured in pmol/liter, plasma glucose is measured in mmol/liter, testosterone is measured in nmol/liter, and serum triglyceride is measured in mmol/liter. The long variant without STOP and wild type values are the means ± S.E.
| Phenotype | N | Long variant without STOP | Wild type (short variant) | p value |
|---|---|---|---|---|
| Men | ||||
| BMI | 13/2225 | 28.41 ± 0.93 | 26.89 ± 0.09 | 0.1783 |
| Fasting serum insulin | 11/2041 | 61.09 ± 8.05 | 45.05 ± 0.66 | 0.0077 |
| 30-min serum insulin | 11/2029 | 474.27 ± 53.7 | 308.71 ± 4.43 | 0.0006a |
| 2-h serum insulin | 11/2050 | 298.27 ± 87.24 | 210.84 ± 4.74 | 0.2269 |
| Fasting plasma glucose | 11/2121 | 5.50 ± 0.15 | 5.73 ± 0.02 | 0.2825 |
| 30-min plasma glucose | 11/2095 | 9.18 ± 0.57 | 9.26 ± 0.04 | 0.8816 |
| 2-h plasma glucose | 10/2113 | 6.23 ± 0.47 | 6.22 ± 0.05 | 0.7622 |
| HOMA-IR | 11/2039 | 2.50 ± 0.35 | 1.96 ± 0.03 | 0.0216 |
| ISI Matsuda | 10/1899 | 5.00 ± 0.74 | 8.18 ± 0.11 | 0.0061 |
| Insulinogenic index | 11/1953 | 45.98 ± 5.95 | 29.01 ± 0.44 | 0.0011a |
| Has children | 13/2225 | 0.69 ± 0.13 | 0.86 ± 0.01 | 0.0723 |
| Testosterone | 13/2165 | 15.47 ± 1.37 | 15.23 ± 0.12 | 0.7438 |
| Serum triglyceride | 13/2224 | 2.03 ± 0.24 | 1.57 ± 0.03 | 0.0140 |
| Women | ||||
| BMI | 20/2260 | 24.18 ± 0.80 | 25.72 ± 0.10 | 0.1630 |
| Fasting serum insulin | 19/1995 | 34.47 ± 4.05 | 40.22 ± 0.58 | 0.4109 |
| 30-min serum insulin | 16/1936 | 259.50 ± 25.71 | 283.86 ± 3.65 | 0.6697 |
| 2-h serum insulin | 19/2004 | 166.53 ± 16.72 | 230.96 ± 4.61 | 0.2849 |
| Fasting plasma glucose | 19/2073 | 5.16 ± 0.10 | 5.37 ± 0.02 | 0.1190 |
| 30-min plasma glucose | 18/2009 | 8.01 ± 0.30 | 8.23 ± 0.04 | 0.6533 |
| 2-h plasma glucose | 19/2069 | 5.81 ± 0.36 | 6.27 ± 0.04 | 0.2261 |
| HOMA-IR | 19/1995 | 1.33 ± 0.17 | 1.64 ± 0.03 | 0.2837 |
| ISI Matsuda | 16/1824 | 9.37 ± 0.79 | 8.75 ± 0.11 | 0.2364 |
| Insulinogenic index | 16/1871 | 29.47 ± 3.46 | 30.4 ± 0.41 | 0.9147 |
| Serum triglyceride | 20/2261 | 0.90 ± 0.07 | 1.15 ± 0.01 | 0.0788 |
a p < 0.05 after adjusting for multiple tests (family wise error rate).
Because the vast majority of the European population expresses the short KGKY variant of h6A, we wondered whether this variant could play a role in vivo despite our inability to detect the exogenously expressed receptor on the cell surface and in a functional assay in human HEK293T cells. We therefore selected phenotypic traits previously observed in exon 2 GPRC6A knock-out mice. We analyzed whether these traits were significantly different in people with two non-functional receptors because of two alleles of the STOP-SNP variant and compared with people with only the short KGKY, i.e. homozygous for haplotype H0, in approximately 6,000 Danish individuals from the population-based randomized controlled trial Inter99 (32). Table 3 compares body mass index (BMI), serum triglyceride levels, and measures of serum insulin and plasma glucose levels in men and women in response to an oral glucose tolerance test for rs6907580 STOP-SNP knock-outs (haplotypes H2 and H3) versus the subset of the of the population homozygous for the short KGKY (haplotype H0). In males, none of the investigated traits were significant at a family wise error rate of 5% (Table 3). Female knock-outs have significantly elevated 2-h glucose levels but do not otherwise differ significantly (Table 3).
To test whether people with the surface-expressed KGRKLP variant are associated with any of the phenotypic traits observed in mice, we compared carriers of at least one surface-expressed allele (haplotype H1) with people with only the common short variant, i.e. homozygous for haplotype (H0), in the Inter99 cohort. Table 4 shows a comparison for selected traits in men and women. We found that none of the investigated traits differed significantly in women, but the 30-min serum insulin and first phase insulin response assessed by the insulinogenic index were increased among male carriers.
Discussion
The starting point of the present study was the surprising observation that recombinantly expressed h6A is retained intracellularly in contrast to mouse, rat, and goldfish analogs (2, 3, 6). Our previous analyses of h6A/5.24 chimeric analyses uncovered that the lack of surface expression was due to a motif located in the 7TM domain and/or the C-terminal region of h6A (3). We used these findings as the basis for additional chimeric receptor studies and found dramatic changes in both surface expression and functionality of the human GPRC6A expression construct when we exchanged the human ICL3_KGKY loop with the mouse ICL3_KGRKLP loop. Our alignments identified bonobo GPRC6A as a very close ortholog of h6A, and synthesis of the b6A sequence allowed us to determine the importance of the eight amino acids that differed between the two orthologs. We verified the significance of the ICL3 region for surface expression and functionality; however, the mechanistic role of this region is still unknown. Mutational studies of the ICL3 region, changing ICL3_KGKY to the human ICL3_KGKKLY variant, showed us that the lack of surface expression is not simply due to a shorter loop that prohibits proper folding of the receptor. Instead our results suggest that the ICL3 region does more than just adding length to the receptor; the specific sequence is also important. Given that many signaling and scaffolding proteins bind to the intracellular side of GPCRs regulating their trafficking (33), it is tempting to speculate that GPCR-interacting proteins, absent in the HEK293T cells, recognize the ICL3 loop of h6A and thereby regulate its cell surface expression. However, a search for motifs in neither the short (ICL3_KGKY) or long (ICL3_KGRKLP) loop at the MyHits website returned any hits associated with trafficking. To this end, it would be highly interesting to delineate the trafficking of both the short and long variants, which could elucidate the mechanism of the intracellular retention of the short (ICL3_KGKY) h6A variant. Alternatively, the shorter ICL3_KGKY loop might pose constraints of proper folding of the receptor. Indeed, according to alignments at GPCRdb (34), all the 21 other human class C GPCRs have ICL3 loops 2–4 amino acids longer than the short (ICL3_KGKY) h6A variant. Interestingly, the closest homolog, human calcium-sensing receptor, shares the RKLP motif present in the long h6A (ICL3_KGRKLP) variant, and the RXXP motif is conserved in 11 of the 21 other human class C GPCRs, which suggests that the motif is important for the function of the class C receptors. Finally, the receptor variant might have an ability to signal from intracellular compartments as observed for other GPCRs (35, 36). However, further studies are warranted to delineate the mechanism of the intracellular retention and/or function of the most common H0 haplotype.
Our studies, for the first time, identify a variant of h6A (ICL3_KGRKLP) that we can detect on the surface of a transfected human cell line and test in our functional assay. Using these tools, we verify the primary agonists as basic l-α-amino acids, and we also, in sequence databases, found evidence for the existence of the long ICL3_KGRKLP variant in the human population. Looking into the prevalence of the different alleles, we found great variance between different populations. Only a small percentage of the European and Asian population encodes the long ICL3_KGRKLP and, in our hands, functional variant of h6A. The number of individuals with a potential functional long ICL3_KGRKLP variant among the European and Asian population is even smaller because a large fraction of this group also carries a SNP that results in a premature stop codon and therefore most likely eliminates the functional receptor protein. This is, however, not the case for the African population, in which a much larger fraction of the group is either heterozygous or homozygous for the long ICL3_KGRKLP variant. In addition, we find no evidence for strong linkage between the long variant and the STOP-SNP in the African population. It should be noted, however, that genetic diversity of the African population is much larger than it is in populations of European ancestry and that the rather small number of African samples in the 1000 genomes data set may not reflect this diversity. Nevertheless, it is tempting to speculate that the short ICL3_KGKY variant and strong linkage to the STOP-SNP occurred after migration of Europeans and Asians out of Africa.
One of the major questions regarding the functions of GPRC6A is whether the short ICL3_KGKY h6A variant, predominant in European/Asian populations, plays a physiological role even though it is not functional in the IP1 assay and is intracellularly retained when recombinantly expressed. As outlined in the introduction, exon 2 GPRC6A knock-out mice have shown complex metabolic and testicular phenotypes under normal physiological conditions (13, 14, 18, 24–26), which, however, are not observed in exon 6 and whole gene knock-out mice under normal physiological conditions (17, 19–23) with the exception of a mild metabolic phenotype observed in exon 6 knock-out mice on high fat diet for several months (22).
To resolve whether Europeans would recapitulate the exon 2 or exon 6/whole gene mouse knock-out models, we used data obtained from a population-based sampled adult cohort to compare selected phenotypic traits between people with or without expression of the h6A receptor caused by STOP-SNP alleles. Interestingly, our results show no significant anthropometric or metabolic differences as a result of h6A loss in males. We had only three females with two STOP-SNP alleles and oral glucose tolerance test measurements, and although these three exhibit significantly higher 2-h glucose levels, we were careful not to overinterpret this difference, which may well be a chance finding. Finally, we analyzed testosterone in males in the Inter99 data set but did not observe statistical significant h6A-loss induced changes (Table 3). Because testosterone production can affect fertility, we also looked at the proportion of men with two STOP-SNP alleles in Inter99 who had offspring, which was not significantly different from the rest of the men in Inter99.
The other major question is whether the cell surface-expressed and functional ICL3_KGRKLP variant (H1 haplotype) of h6A has a physiological function compared with the most common ICL3_KGKY h6A variant (H0). Although the H1 haplotype, without the deleterious STOP-SNP, is quite rare in the Danish population, we do observe a statistically significant increased first phase insulin response among male carriers. This aligns with the observations that exon 2 GPRC6A knock-out mice display lower levels of insulin release than wild type male mice (which have the H3 haplotype) (13, 25). However, the low number of H1 haplotype carriers in the Danish cohort warrants confirmation in larger (African) cohorts before drawing conclusions about the biological significance of the observation.
Altogether, our studies identify a long ICL3_KGRKLP variant of h6A that can be recombinantly expressed on the cell surface and assayed in a functional assay of human HEK293T cells. We find evidence for expression of this variant in a subset of the human population, but the biological role of this variant is still unknown.
We were unable to detect any significant evidence of metabolic or testosterone-related differences between male human GPRC6A knock-outs and the short ICL3_KGKY h6A variant in a Danish population. Although we observed increased 2-h glucose in the female knock-outs, the number of these is too small to draw any firm conclusions. Our data do not rule out that the possibility that GPRC6A can be involved in other physiological functions observed in mouse knock-out models of, for example, bone mineralization (18), inflammation (37), prostate cancer (8), or exercise behavior (38) or have biological functions such as regulation of first phase insulin response in particular in an African population where the long ICL3_KGRKLP variant is much more prevalent. Our discovery of the STOP-SNP and long ICL3_KGRKLP variant in the h6A gene allows future studies using other human cohorts to test these hypotheses.
Experimental Procedures
Cell Culture and Reagents
Human HEK293T cells (ATCC) and Gαq/11-null HEK293 cells (29) were grown in DMEM GlutaMAX (Invitrogen) supplemented with 10% dialyzed fetal bovine serum (Thermo Fisher Scientific) and 1% penicillin/streptomycin (Invitrogen). Lipofectamine 2000 was purchased from Invitrogen. Poly-d-lysine, the 20 proteinogenic l-α-amino acids (LAA21), l-ornithine (W419001), and l-arginine (A5131) were purchased from Sigma-Aldrich. Antibodies: c-Myc (R950-25) was purchased from Invitrogen. Anti-mouse IgG HRP-coupled secondary antibody (PI-2000) was purchased from VWR. ELISA SuperSignal Femto (PI37075) was purchased from Thermo Scientific. IP-One HTRF assay kit was purchased from Cisbio.
GPRC6A Constructs
Chimeric constructs were generated using overlay extension PCR techniques as previously described (39). All PCRs were performed with Pfu Ultra II polymerase (Stratagene) according to the manufacturer's protocol. Point mutations insertions/deletions were generated using QuikChange mutagenesis (Stratagene) and verified by sequencing (GATC, Constance, Germany). The bonobo GPRC6A sequence was synthesized by GenScript, c-Myc-tagged, and inserted into the pEGFP-N1 vector (1).
Sequencing of Bonobo GPRC6A DNA
A sample of bonobo (Pan paniscus) genomic DNA was received from Antwerp zoo. Primers targeting regions surrounding exons 2, 3, 5, and 6 were used to amplify these regions, and the PCR products were sequenced by GATC Biotech.
Real Time qPCR
RNA extraction was performed using the PureLink RNA mini kit (12183018A; Life Technologies) according to the manufacturer's protocol. Genomic DNA contamination was eliminated by perming an on-column digestion with a DNase kit (12185-010; Life Technologies). The mRNA content was quantified with a NanoDrop. cDNA was synthesized using a high capacity cDNA reverse transcription kit (4368814; Applied Biosystems, Life Technologies). qPCR was performed using the Agilent Mx3005P qPCR System in a 20 μl reaction mixture containing 10 μl of SYBR Green qPCR Master Mix (QUNT95074-012), 5 μl of cDNA sample, 15 pmol of forward and reverse gene-specific primer pairs (Pentabase for h6A primers and TAGCopenhagen for GAPDH, Denmark), and DNase-free water to a total volume of 20 μl. The specific sequences of the primer sets used in this study are shown below. The thermal profile was: initial denaturation at 95 °C for 30 s followed by 40 temperature cycles of 95 °C for 5 s, 60 °C for 15 s, and 72 °C for 10 s. The default cycle threshold value was used. The sequences of primers used were h6A (primer pair 1, forward 5′-ATGCCACAGGTGGGTTATGA-3′ and reverse 5′-CACTGGGCACAGTCCGTAAA-3′; product length, 85 bp), h6A (primer pair 2, forward 5′-GCTTGCAGTGTTTGCCCTTGG-3′ and reverse 5′-AGCACACCAAGTAACTCCCAT-3′; product length, 102 bp), and GAPDH (forward 5′-GTTCGACAGTCAGCCGCATC-3′ and reverse 5′-GCCCAATACGACCAAATCCGTT-3′; product length, 106 bp).
DNA Transfections
Transfections were carried out as follows: 96-well plates were coated with poly-d-lysine prior to transfection. DNA constructs and Lipofectamine 2000 were mixed according to guidelines and transferred to the 96-well plates. 12,500 cells/well were plated on top of DNA/Lipofectamine 2000 mix and incubated for 48 h at 37 °C and 5% CO2.
ELISA
The plates were washed with Hanks' balanced salt solution (HBSS, 20 mm HEPES, pH 7.4, 1 mg/ml BSA) buffer twice for 2 h at 37 °C prior to fixation (4% paraformaldehyde in PBS) for 5 min at room temperature. All wells were washed twice with washing buffer (PBS, 1 mm CaCl2) before the wells used to determine the total expression were permeabilized (0.1% Triton X-100 in PBS, 1 mm CaCl2) for 5 min. The c-Myc tagged GABAB1a and GABAB2 system was used as an internal control for proper permeabilization in every experiment (28). The permeabilized wells were washed twice with washing buffer, and all wells were blocked for 30 min with blocking solution (3% skim milk in PBS, 1 mm CaCl2, and 50 mm Tris, pH 7.5). The wells were then incubated 45 min with primary antibody in blocking solution, followed by washing (one wash with blocking solution and two with washing buffer). Secondary antibody in blocking solution was added and incubated for 45 min followed by washing (four washes in blocking solution and four in washing buffer). ELISA SuperSignal Femto solution was used for detection, and the plates were read immediately on an EnSpire reader (PerkinElmer Life Sciences). The normalized data of the individual constructs are calculated as the ratio of surface expression over total expression (obtained after permeabilization with Triton X-100).
IP1 Accumulation Assay
All transfections were performed using equal amounts of the indicated plasmids and Gαq(G66D) as previously published (2, 9). Plates with HEK293T cells were washed twice with buffer (HBSS, 20 mm HEPES, pH 7.4, BSA 1 mg/ml) for 2 h at 37 °C. Plates with HEK293 Gαq/11-null cells were washed twice with wash buffer supplemented with 0.5 mm CaCl2 and 0.5 mm MgCl2 for 2 h at 37 °C. Prior to addition of ligands, the plates were washed once with ligand buffer (HBSS, 20 mm HEPES, pH 7.4, 1 mm CaCl2, 1 mm MgCl2, and 40 mm LiCl). Ligands were diluted in ligand buffer as indicated in the figures, and plates were incubated with ligands for 1 h at 37 °C. Ligand solution was removed, and cells were lysed using IP-One lysis buffer (provided in the kit) for 30 min at room temperature. 10 μl of cell lysate was transferred from each well to a 384-well OptiPlate (PerkinElmer). 10 μl of detection solution (HBSS, 20 mm HEPES, pH 7.4, 1 mm CaCl2 and MgCl2 with 2.5% anti-IP1 cryptate Tb conjugate and 2.5% d-myo-inositol monophosphate (IP1)-d2 conjugate) was added to each well, and the plate was centrifuged shortly to mix the liquids. The plates were sealed and left to incubate for 1 h in the dark. The plates were read on an EnVision multilabel reader (PerkinElmer Life Sciences) with excitation at 340 nm and emission at 615 and 665 nm. The fluorescence resonance energy transfer ratios (665 nm/615 nm) were converted to IP1 concentrations by interpolating values from an IP1 standard curve generated from an IP1 calibrator provided by the manufacture (Cisbio).
Study Population
6293 individuals from the Inter99 randomized control trial in the Danish population (32) (CT00289237, ClinicalTrials.gov) were sequenced in the present study. All participants were between 29 and 61 years at examination, with a median age of 45 years. Of these, 49 and 51% are male and female, respectively. All participants were Danes by self-report. Written informed consent was obtained from all participants, and the study was approved by the Scientific Ethics Committee of the Capital Region of Denmark (Inter99: KA98155) and was in accordance with the principles of the Declaration of Helsinki II.
Sequencing of GPRC6A
The coding regions and intron-exon boundaries of GPRC6A was examined using targeted region capture and next generation sequencing as described (40). The coding regions were covered with a minimum mean depth of 38 in 99.9% of all individuals, and the median depth per individual was 196.
Software
Alignments were all carried out using Clustal Omega software provided by EMBL-EBI. Indels in the Inter99 data were called using GATK (41). The data analysis and graphs were generated using GraphPad Prism 6.0g and R.
Bioinformatics Studies
Genetic association analyses were conducted using linear regression with a recessive model. All traits were adjusted for age and gender, and all traits except BMI were adjusted for BMI. All metabolic traits (insulin and glucose and related indices) were log-transformed prior to analysis. The Bonferroni method was used to adjust for multiple testing.
Author Contributions
H. B.-O., T. H., and P. W. conceived the project. S. J., C. T. H., C. R. U., A. P. G., S. Q., G. R., C. V. J., and L. D. J. performed experiments. A. I. provided cell lines and protocols. H. B.-O. and T. H. supervised experiments. S. J., C. T. H., and H. B.-O wrote the manuscript. S. J., C. T. H., C. R. U., P. W., A. P. G., C. V. J., A. L., N. G., W. J., O. P., T. H., and H. B.-O. revised the manuscript. All authors reviewed the results and approved the final version of the manuscript.
Acknowledgment
We thank Antwerp Zoo for generously providing the sample of bonobo genomic DNA.
This work was supported by funds from the Danish Council for Independent Research, Medical Sciences (to H. B.-O.), the Novo Nordisk Foundation (to H. B.-O.), the Lundbeck Foundation (to C. R. U.), the Japan Science and Technology Agency, Precursory Research for Embryonic Science and Technology (to A. I.), and AstraZeneca (to H. B.-O.). The Novo Nordisk Foundation Center for Basic Metabolic Research is an independent research center at the University of Copenhagen and is partially funded by an unrestricted donation from the Novo Nordisk Foundation. The authors declare that they have no conflicts of interest with the contents of this article.
- GPCR
- G protein-coupled receptor
- GPRC6A
- GPCR class C, group 6, member A
- 7TM
- 7-transmembrane
- ATD
- amino-terminal domain
- b6A
- bonobo (P. paniscus) GPRC6A
- BMI
- body mass index
- EVS
- Exome Variant Server
- ICL3
- third intracellular loop
- h6A
- human GPRC6A
- HBSS
- Hanks' balanced salt solution
- m6A
- mouse GPRC6A
- SNP
- single nucleotide polymorphism
- TMVII
- transmembrane helix VII
- IP1
- d-myo-inositol monophosphate
- qPCR
- quantitative PCR.
References
- 1. Wellendorph P., and Bräuner-Osborne H. (2004) Molecular cloning, expression, and sequence analysis of GPRC6A, a novel family C G-protein-coupled receptor. Gene 335, 37–46 [DOI] [PubMed] [Google Scholar]
- 2. Kuang D., Yao Y., Lam J., Tsushima R. G., and Hampson D. R. (2005) Cloning and characterization of a family C orphan G-protein coupled receptor. J. Neurochem. 93, 383–391 [DOI] [PubMed] [Google Scholar]
- 3. Wellendorph P., Hansen K. B., Balsgaard A., Greenwood J. R., Egebjerg J., and Bräuner-Osborne H. (2005) Deorphanization of GPRC6A: a promiscuous l-α-amino acid receptor with preference for basic amino acids. Mol. Pharmacol. 67, 589–597 [DOI] [PubMed] [Google Scholar]
- 4. Wellendorph P., Burhenne N., Christiansen B., Walter B., Schmale H., and Bräuner-Osborne H. (2007) The rat GPRC6A: cloning and characterization. Gene 396, 257–267 [DOI] [PubMed] [Google Scholar]
- 5. Nørskov-Lauritsen L., Jørgensen S., and Bräuner-Osborne H. (2015) N-Glycosylation and disulfide bonding affects GPRC6A receptor expression, function, and dimerization. FEBS Lett. 589, 588–597 [DOI] [PubMed] [Google Scholar]
- 6. Rueda P., Harley E., Lu Y., Stewart G. D., Fabb S., Diepenhorst N., Cremers B., Rouillon M. H., Wehrle I., Geant A., Lamarche G., Leach K., Charman W. N., Christopoulos A., Summers R. J., et al. (2016) Murine GPRC6A mediates cellular responses to l-amino acids, but not osteocalcin variants. PLoS One 11, e0146846. [DOI] [PMC free article] [PubMed] [Google Scholar]
- 7. Faure H., Gorojankina T., Rice N., Dauban P., Dodd R. H., Bräuner-Osborne H., Rognan D., and Ruat M. (2009) Molecular determinants of non-competitive antagonist binding to the mouse GPRC6A receptor. Cell Calcium 46, 323–332 [DOI] [PubMed] [Google Scholar]
- 8. Pi M., and Quarles L. D. (2012) GPRC6A regulates prostate cancer progression. Prostate 72, 399–409 [DOI] [PMC free article] [PubMed] [Google Scholar]
- 9. Christiansen B., Hansen K. B., Wellendorph P., and Bräuner-Osborne H. (2007) Pharmacological characterization of mouse GPRC6A, an l-α-amino acid receptor with ability to sense divalent cations. Br. J. Pharmacol. 150, 798–807 [DOI] [PMC free article] [PubMed] [Google Scholar]
- 10. Pi M., Faber P., Ekema G., Jackson P. D., Ting A., Wang N., Fontilla-Poole M., Mays R. W., Brunden K. R., Harrington J. J., and Quarles L. D. (2005) Identification of a novel extracellular cation-sensing G-protein-coupled receptor. J. Biol. Chem. 280, 40201–40209 [DOI] [PMC free article] [PubMed] [Google Scholar]
- 11. Jacobsen S. E., Nørskov-Lauritsen L., Thomsen A. R., Smajilovic S., Wellendorph P., Larsson N. H., Lehmann A., Bhatia V. K., and Bräuner-Osborne H. (2013) Delineation of the GPRC6A receptor signaling pathways using a mammalian cell line stably expressing the receptor. J. Pharmacol. Exp. Ther. 347, 298–309 [DOI] [PMC free article] [PubMed] [Google Scholar]
- 12. Pi M., Parrill A. L., and Quarles L. D. (2010) GPRC6A mediates the non-genomic effects of steroids. J. Biol. Chem. 285, 39953–39964 [DOI] [PMC free article] [PubMed] [Google Scholar]
- 13. Pi M., Wu Y., and Quarles L. D. (2011) GPRC6A mediates responses to osteocalcin in β-cells in vitro and pancreas in vivo. J. Bone Miner. Res. 26, 1680–1683 [DOI] [PMC free article] [PubMed] [Google Scholar]
- 14. Oury F., Sumara G., Sumara O., Ferron M., Chang H., Smith C. E., Hermo L., Suarez S., Roth B. L., Ducy P., and Karsenty G. (2011) Endocrine regulation of male fertility by the skeleton. Cell 144, 796–809 [DOI] [PMC free article] [PubMed] [Google Scholar]
- 15. Clemmensen C., Smajilovic S., Wellendorph P., and Bräuner-Osborne H. (2014) The GPCR, class C, group 6, subtype A (GPRC6A) receptor: from cloning to physiological function. Br. J. Pharmacol. 171, 1129–1141 [DOI] [PMC free article] [PubMed] [Google Scholar]
- 16. Pi M., and Quarles L. D. (2012) Multiligand specificity and wide tissue expression of GPRC6A reveals new endocrine networks. Endocrinology 153, 2062–2069 [DOI] [PMC free article] [PubMed] [Google Scholar]
- 17. Wellendorph P., Johansen L. D., Jensen A. A., Casanova E., Gassmann M., Deprez P., Clément-Lacroix P., Bettler B., and Bräuner-Osborne H. (2009) No evidence for a bone phenotype in GPRC6A knockout mice under normal physiological conditions. J. Mol. Endocrinol. 42, 215–223 [DOI] [PubMed] [Google Scholar]
- 18. Pi M., Chen L., Huang M. Z., Zhu W., Ringhofer B., Luo J., Christenson L., Li B., Zhang J., Jackson P. D., Faber P., Brunden K. R., Harrington J. J., and Quarles L. D. (2008) GPRC6A null mice exhibit osteopenia, feminization and metabolic syndrome. PLoS One 3, e3858. [DOI] [PMC free article] [PubMed] [Google Scholar]
- 19. Kinsey-Jones J. S., Alamshah A., McGavigan A. K., Spreckley E., Banks K., Cereceda Monteoliva N., Norton M., Bewick G. A., and Murphy K. G. (2015) GPRC6A is not required for the effects of a high-protein diet on body weight in mice. Obesity 23, 1194–1200 [DOI] [PMC free article] [PubMed] [Google Scholar]
- 20. Clemmensen C., Jørgensen C. V., Smajilovic S., and Bräuner-Osborne H. (2016) Robust GLP-1 secretion by basic l-amino acids does not require the GPRC6A receptor. Diabetes Obes. Metab., in press [DOI] [PubMed] [Google Scholar]
- 21. Smajilovic S., Clemmensen C., Johansen L. D., Wellendorph P., Holst J. J., Thams P. G., Ogo E., and Bräuner-Osborne H. (2013) The l-α-amino acid receptor GPRC6A is expressed in the islets of Langerhans but is not involved in l-arginine-induced insulin release. Amino Acids 44, 383–390 [DOI] [PubMed] [Google Scholar]
- 22. Clemmensen C., Smajilovic S., Madsen A. N., Klein A. B., Holst B., and Bräuner-Osborne H. (2013) Increased susceptibility to diet-induced obesity in male GPRC6A receptor knockout mice. J. Endocrinol. 217, 151–160 [DOI] [PubMed] [Google Scholar]
- 23. Alamshah A., McGavigan A. K., Spreckley E., Kinsey-Jones J. S., Amin A., Tough I. R., O'Hara H. C., Moolla A., Banks K., France R., Hyberg G., Norton M., Cheong W., Lehmann A., Bloom S. R., et al. (2016) l-Arginine promotes gut hormone release and reduces food intake in rodents. Diabetes Obes. Metab. 18, 508–518 [DOI] [PMC free article] [PubMed] [Google Scholar]
- 24. Pi M., Zhang L., Lei S. F., Huang M. Z., Zhu W., Zhang J., Shen H., Deng H. W., and Quarles L. D. (2010) Impaired osteoblast function in GPRC6A null mice. J. Bone Miner. Res. 25, 1092–1102 [DOI] [PMC free article] [PubMed] [Google Scholar]
- 25. Pi M., Wu Y., Lenchik N. I., Gerling I., and Quarles L. D. (2012) GPRC6A mediates the effects of l-arginine on insulin secretion in mouse pancreatic islets. Endocrinology 153, 4608–4615 [DOI] [PMC free article] [PubMed] [Google Scholar]
- 26. Oury F., Ferron M., Huizhen W., Confavreux C., Xu L., Lacombe J., Srinivas P., Chamouni A., Lugani F., Lejeune H., Kumar T. R., Plotton I., and Karsenty G. (2013) Osteocalcin regulates murine and human fertility through a pancreas-bone-testis axis. J. Clin. Invest. 123, 2421–2433 [DOI] [PMC free article] [PubMed] [Google Scholar]
- 27. Lefkowitz R. J. (2007) Seven transmembrane receptors: something old, something new. Acta Physiol. (Oxf.) 190, 9–19 [DOI] [PubMed] [Google Scholar]
- 28. Pagano A., Rovelli G., Mosbacher J., Lohmann T., Duthey B., Stauffer D., Ristig D., Schuler V., Meigel I., Lampert C., Stein T., Prezeau L., Blahos J., Pin J., Froestl W., et al. (2001) C-terminal interaction is essential for surface trafficking but not for heteromeric assembly of GABAB receptors. J. Neurosci. 21, 1189–1202 [DOI] [PMC free article] [PubMed] [Google Scholar]
- 29. Schrage R., Schmitz A. L., Gaffal E., Annala S., Kehraus S., Wenzel D., Büllesbach K. M., Bald T., Inoue A., Shinjo Y., Galandrin S., Shridhar N., Hesse M., Grundmann M., Merten N., et al. (2015) The experimental power of FR900359 to study Gq-regulated biological processes. Nat. Commun. 6, 10156. [DOI] [PMC free article] [PubMed] [Google Scholar]
- 30. 1000 Genomes Project Consortium, Abecasis G. R., Auton A., Brooks L. D., DePristo M. A., Durbin R. M., Handsaker R. E., Kang H. M., Marth G. T., and McVean G. A. (2012) An integrated map of genetic variation from 1,092 human genomes. Nature 491, 56–65 [DOI] [PMC free article] [PubMed] [Google Scholar]
- 31. Exome Variant Server, NHLBI GO Exome Sequencing Project (ESP), Seattle, WA [Google Scholar]
- 32. Jørgensen T., Borch-Johnsen K., Thomsen T. F., Ibsen H., Glümer C., and Pisinger C. (2003) A randomized non-pharmacological intervention study for prevention of ischaemic heart disease: baseline results Inter99. Eur. J. Cardiovasc. Prev. Rehabil. 10, 377–386 [DOI] [PubMed] [Google Scholar]
- 33. Magalhaes A. C., Du nn H., and Ferguson S. S. (2012) Regulation of GPCR activity, trafficking and localization by GPCR-interacting proteins. Br. J. Pharmacol. 165, 1717–1736 [DOI] [PMC free article] [PubMed] [Google Scholar]
- 34. Isberg V., de Graaf C., Bortolato A., Cherezov V., Katritch V., Marshall F. H., Mordalski S., Pin J. P., Stevens R. C., Vriend G., and Gloriam D. E. (2015) Generic GPCR residue numbers: aligning topology maps while minding the gaps. Trends Pharmacol. Sci. 36, 22–31 [DOI] [PMC free article] [PubMed] [Google Scholar]
- 35. Hewavitharana T., and Wedegaertner P. B. (2012) Non-canonical signaling and localizations of heterotrimeric G proteins. Cell Signal. 24, 25–34 [DOI] [PMC free article] [PubMed] [Google Scholar]
- 36. Jong Y.-J., Sergin I., Purgert C. A., and O'Malley K. L. (2014) Location-dependent signaling of the group 1 metabotropic glutamate receptor mGlu5. Mol. Pharmacol. 86, 774–785 [DOI] [PMC free article] [PubMed] [Google Scholar]
- 37. Rossol M., Pierer M., Raulien N., Quandt D., Meusch U., Rothe K., Schubert K., Schöneberg T., Schaefer M., Krügel U., Smajilovic S., Bräuner-Osborne H., Baerwald C., and Wagner U. (2012) Extracellular Ca2+ is a danger signal activating the NLRP3 inflammasome through G protein-coupled calcium sensing receptors. Nat. Commun. 3, 1329. [DOI] [PMC free article] [PubMed] [Google Scholar]
- 38. Clemmensen C., Pehmøller C., Klein A. B., Ratner C., Wojtaszewski J. F., and Bräuner-Osborne H. (2013) Enhanced voluntary wheel running in GPRC6A receptor knockout mice. Physiol. Behav. 118, 144–151 [DOI] [PubMed] [Google Scholar]
- 39. Horton R. M., Hunt H. D., Ho S. N., Pullen J. K., and Pease L. R. (1989) Engineering hybrid genes without the use of restriction enzymes: gene splicing by overlap extension. Gene 77, 61–68 [DOI] [PubMed] [Google Scholar]
- 40. Gao R., Liu Y., Gjesing A. P., Hollensted M., Wan X., He S., Pedersen O., Yi X., Wang J., and Hansen T. (2014) Evaluation of a target region capture sequencing platform using monogenic diabetes as a study-model. BMC Genet. 15, 13. [DOI] [PMC free article] [PubMed] [Google Scholar]
- 41. McKenna A., Hanna M., Banks E., Sivachenko A., Cibulskis K., Kernytsky A., Garimella K., Altshuler D., Gabriel S., Daly M., and DePristo M. A. (2010) The Genome Analysis Toolkit: a MapReduce framework for analyzing next-generation DNA sequencing data. Genome Res. 20, 1297–1303 [DOI] [PMC free article] [PubMed] [Google Scholar]