Abstract
Ca2+ dynamics in the growing pollen tube have been well documented in vitro using germination assays and Ca2+ imaging techniques. However, very few in vivo studies of Ca2+ in the pollen grain and papilla cell during pollination have been performed. We expressed yellow cameleon, a Ca2+ indicator based on green fluorescent protein, in the pollen grains and papilla cells of Arabidopsis (Arabidopsis thaliana) and monitored Ca2+ dynamics during pollination. In the pollen grain, [Ca2+]cyt increased at the potential germination site soon after hydration and remained augmented until germination. As in previous in vitro germination studies, [Ca2+]cyt oscillations were observed in the tip region of the growing pollen tube, but the oscillation frequency was faster and [Ca2+]cyt was higher than had been observed in vitro. In the pollinated papilla cell, remarkable increases in [Ca2+]cyt occurred three times in succession, just under the site of pollen-grain attachment. [Ca2+]cyt increased first soon after pollen hydration, with a second increase occurring after pollen protrusion. The third and most remarkable [Ca2+]cyt increase took place when the pollen tube penetrated into the papilla cell wall.
Flowering plant reproduction comprises several sequential steps from pollination to fertilization. In Brassicaceae, a compatible pollen grain adheres to and hydrates on a papilla cell of the stigma. The hydrated pollen germinates and produces a pollen tube that penetrates into the papilla cell wall and then enters the transmitting tissue of the style. Finally, sperm cells inside the pollen tube encounter egg cells, and fertilization occurs.
In vitro pollen germination requires the presence of Ca2+, boron, and an osmoticant such as Suc (Brewbaker and Kwack, 1963). Lack of Ca2+ in the growth medium results in morphological abnormalities such as coiling and tip swelling (Shivanna and Rangaswamy, 1992; Taylor and Hepler, 1997). In vitro germination assays using microinjection of a Ca2+-sensitive fluorescent probe revealed a [Ca2+]cyt gradient in the tip of the growing pollen tube (Rathore et al., 1991; Franklin-Tong et al., 1993; Malho et al., 1994; Pierson et al., 1994, 1996). Furthermore, it has been shown that such a tip-localized intracellular [Ca2+]cyt gradient, which arises from the influx of Ca2+ at the tube tip, is essential for pollen tube elongation (Franklin-Tong et al., 1993; Malho et al., 1994; Pierson et al., 1994, 1996; Holdaway-Clarke et al., 1997; Messerli and Robinson, 1997; Messerli et al., 2000; Feijo et al., 2001; Plieth, 2001; Robinson and Messerli, 2002; Holdaway-Clarke and Hepler, 2003). These in vitro observations suggest that Ca2+ dynamics are involved in the pollination process in vivo. However, because of the difficulty in microinjecting a Ca2+-sensitive probe into an exine-covered pollen grain, such investigations have not been performed. In addition, there have been few reports concerning Ca2+ dynamics in papilla cells, because the physical damage caused by microinjection has been shown to perturb the normal pollination process (Dearnaley et al., 1997). Another approach for real-time imaging of Ca2+ involves the expression in plant cells of aequorin, a Ca2+-sensitive luminescent protein (Knight et al., 1991). This method, however, requires the incorporation of the cofactor coelenterazine for light emission, and the luminescence is relatively weak. To examine Ca2+ dynamics in the pollen grain and papilla cell during pollination, it is important to develop a new, highly sensitive system to monitor real-time Ca2+ dynamics in these cells without damaging them.
Yellow cameleons, which are new Ca2+ indicators, have been developed to combine the advantages of molecular targeting with a fluorescent readout (Miyawaki et al., 1997, 1999). These indicators are chimeric proteins consisting of an enhanced cyan fluorescent protein (ECFP), calmodulin (CaM), a glycyl-Gly linker, the CaM-binding domain of myosin light chain kinase (M13), and an enhanced yellow fluorescent protein (EYFP). When Ca2+ binds to the CaM domain, this domain associates with the M13 peptide, causing the protein to adopt a more compact conformation, which increases the efficiency of fluorescence resonance energy transfer between ECFP and EYFP. Several types of cameleons have been developed with differing affinities for Ca2+ due to tunable binding of the CaM domain. Yellow cameleon 2.1 (YC2.1) is a high-affinity indicator and has been shown to be effective in monitoring [Ca2+]cyt in Arabidopsis (Arabidopsis thaliana) guard cells (Allen et al., 1999, 2000, 2001). Yellow cameleon 3.1 (YC3.1) is a low-affinity indicator suitable for monitoring rapid changes in [Ca2+]cyt such as those that occur in the pollen tube.
To investigate Ca2+ dynamics during pollination, we genetically transformed Arabidopsis to express the YC3.1 gene in pollen grains and papilla cells. We compared Ca2+ dynamics in pollen grains and pollen tubes germinated using in vitro, in vivo, and semi in vivo systems. We also monitored Ca2+ dynamics in papilla cells during pollination. These results will be discussed in relation to the physiological relevance of Ca2+ dynamics in the pollination process.
RESULTS
Expression of YC3.1 in the Pollen Grains and Ca2+ Dynamics in Pollen Germination and Pollen Tube Growth in Vitro
We independently transformed 13 plants with pAct1YC3.1. After selection on kanamycin-containing Murashige and Skoog plates, we confirmed by reverse transcription-PCR that all of the plants were transcribing the transgene. To select the plant with the brightest fluorescence, pollen tubes growing on the germination medium were observed using fluorescence microscopy (Blue excitation, No. 10 filter, Axiophoto; Carl Zeiss, Jena, Germany).
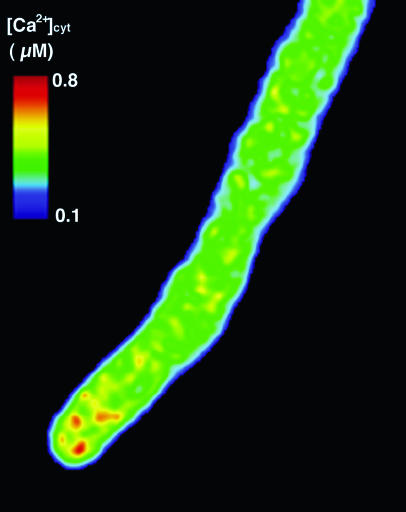
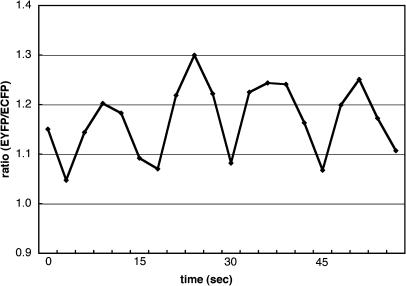
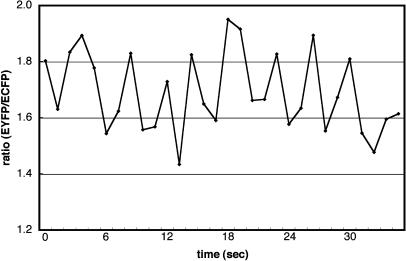
To confirm that green fluorescence was due to the ECFP and EYFP of the genetically expressed YC3.1, we obtained the fluorescence spectra of the growing pollen tubes using a spectral-imaging microscope system with excitation at 458 nm. The YC3.1 spectrum comprised both spectra typically observed from recombinant ECFP and EYFP proteins. Photobleaching with 514-nm light in a 5 μm × 10-μm area of the pollen tube tip induced an increase in ECFP fluorescence of about 15% and a decrease in EYFP fluorescence (data not shown). This demonstrated that full-length YC3.1 was expressed in the transgenic pollen tubes and that fluorescence resonance energy transfer (FRET) occurred between ECFP and EYFP. To investigate [Ca2+]cyt distribution in the pollen tube, the ECFP and EYFP components of the YC3.1 fluorescence spectra were separated and the EYFP:ECFP ratio was calculated. After digital low-pass filter treatment, the gray-level value of each pixel was expressed with a pseudo-color as shown in Figure 1. Corroborating a previous report, [Ca2+]cyt was found to be higher at the tip region. To investigate Ca2+ dynamics at the pollen tube tip, fluorescence images were acquired at 1.2- to 6-s intervals in the 463- to 543-nm range. These images were separated into ECFP and EYFP images. We measured the ECFP and EYFP fluorescence intensities in a 5 × 5-μm2 region at the tip and calculated the EYFP:ECFP ratio. At the tip, the value of this ratio oscillated periodically around a mean value of 1.32 ± 0.24 (n = 16; Fig. 2). Furthermore, we converted the YC3.1 ratios into approximate [Ca2+]cyt according to the previous report (Allen et al., 1999), and then we estimated that [Ca2+]cyt at the tip region ranged from 0.15 to 0.68 μm and changed periodically with a period between 12 and 21 s (Table I).
Figure 1.
An EYFP:ECFP ratiometric image of the growing pollen tube. ECFP and EYFP images were separated from the total YC3.1 fluorescence image using their individual spectra, and an image depicting their ratio was obtained.
Figure 2.
Periodic change of the EYGP:ECFP ratio in a 5 × 5 μm2 region of the growing pollen-tube tip observed during in vitro pollination.
Table I.
[Ca2+]cyt oscillation and the growth rate of the growing pollen tube
| Experiment
|
Oscillation Period
|
[Ca2+]cyt
|
Mean Growth Rate
|
No. of Experiment
|
||
|---|---|---|---|---|---|---|
| Max. | Min. | Mean | ||||
| sec | μma | μm/minb | ||||
| In vitroc | 12 ∼ 21 | 0.68 | 0.15 | 0.39 | 0.7 ± 0.2 | 16 |
| In vivo | ∼ 6 | 1.14 | 0.64 | 0.86 | 13.2 ± 0.3 | 20 |
| Semi in vivo | 9 ∼15 | 2.18 | 0.91 | 1.42 | 2.3 ± 0.2 | 20 |
[Ca2+]cyt at the tip region (5 × 5 μm2) was calculated. Mean values indicate average over time in the individual pollen tubes in all experiments. Max and min values indicate peak and tough values.
All values reported as mean ± sd.
The growing pollen tube just after germination was monitored.
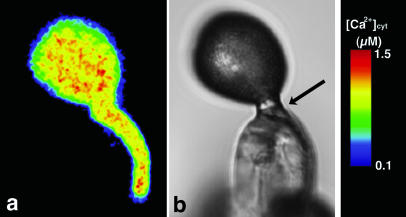
To examine Ca2+ dynamics during in vitro germination, pollen grains from freshly dehisced anthers were cultured in agar-containing germination medium. Every pollen grain immediately hydrated. The ratiometric images showed that [Ca2+]cyt was distributed almost uniformly throughout the recently hydrated pollen grains (Fig. 3a). One hour after culture, 20% of the pollen grains had protrusions at the potential germination site, and after 2 h about one-half of these pollen grains germinated. In these grains, [Ca2+]cyt was increased at the potential germination site (arrow, Fig. 3b). In many instances, this increase was not exclusive to the germination site but was observed elsewhere in the pollen grain (arrowhead, Fig. 3b). When no [Ca2+]cyt gradient was established in the pollen grain, no protrusion was formed following hydration, and germination did not occur. Furthermore, to examine the relationship between the [Ca2+]cyt gradient and pollen germination, we examined the effect of nifedipine, which blocks L-type Ca2+ channels (Dierkes et al., 2004) and inhibits pollen germination. Addition of nifedipine to the germination medium resulted in an almost complete loss of pollen-grain germination. Overall [Ca2+]cyt in treated pollen grains was lower than in untreated ones, and the gradient was never observed (Fig. 3c). These results suggest that a [Ca2+]cyt gradient is required for pollen grain germination.
Figure 3.
Distribution of Ca2+ in the pollen grain during in vitro germination. a, A ratiometric image of the pollen grain after hydration. b, A ratiometric image of a protrusion on a pollen grain. [Ca2+]cyt increase was observed not only at the potential germination site (arrow) but also at another site (arrowhead). c, A ratiometric image of a nifedipine-treated pollen grain after hydration.
Ca2+ Dynamics in the Pollen Grain and Pollen Tube during in Vivo Pollination
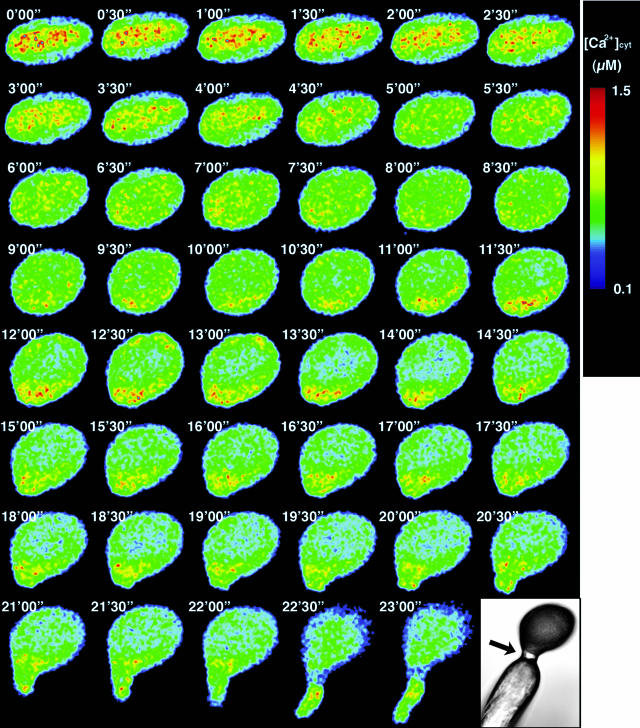
To examine Ca2+ dynamics in a pollen grain during pollination, YC3.1 fluorescence was monitored at 1.2- to 30-s intervals after a pollen grain from a pAct1YC3.1-expressing plant was pollinated onto a papilla cell under micromanipulation. During pollination, the YC3.1 fluorescence in the pollen grain and pollen tube were captured and split into ECFP, EYFP, and autofluorescence images. Figure 4 shows a time course of ratiometric images.
Figure 4.
Ca2+ dynamics in the pollen grain during in vivo pollination. Monitoring was performed under dry conditions. [Ca2+]cyt was high at the center of the pollen grain before hydration. [Ca2+]cyt was increased at the potential germination site during hydration (9′30″–15′30″). The accumulation continued until germination (approximately 22′30″).
Light microscopy revealed the hydration and protrusion of the pollen grain at the site of attachment with the papilla cell 5 min after pollination. Within 20 min, a pollen tube germinated at the site of attachment with the papilla cell, and within 30 min, the pollen tube penetrated the papilla cell wall. Just after pollination, [Ca2+]cyt was high in the central area of the pollen grain (0′00″–2′30″ in Fig. 4). Immediately after hydration, [Ca2+]cyt was evenly distributed (3′00″–9′00″ in Fig. 4). However, before pollen-tube germination, [Ca2+]cyt increased at the potential germination site, where a protrusion signifying imminent germination then appeared (9′30″–15′30″ in Fig. 4). Conversely, when a pollen grain failed to form, such a localized increase in [Ca2+]cyt, pollen tube germination did not occur (data not shown). These results demonstrate that an increase in [Ca2+]cyt at the potential germination site precedes pollen germination in vivo as well as in vitro.
During the period from germination to penetration of the papilla cell wall, [Ca2+]cyt changed frequently at the tip of the pollen tube. Furthermore, when the pollen tube elongated within the papilla cell after penetration, changes in [Ca2+]cyt were observed not only at the tip, but also throughout the elongated pollen tube (Fig. 5). The mean value of the ratio at the tube tip was 1.69 ± 0.16 (n = 20), representing a mean [Ca2+]cyt of 0.86 μm (range, 0.64–1.14 μm; Table I). The period of the [Ca2+]cyt oscillation was shorter (3.6–6 s; Fig. 6) than that observed in vitro, although a faster monitoring system with higher resolution, such as a cooled charged coupled device (CCD) camera, would be required to determine the oscillation period more precisely. The [Ca2+]cyt near the penetration site, however, was frequently elevated (Fig. 7). At this site, the pollen tube changed its direction of elongation.
Figure 5.
Ca2+ dynamics during the elongation of a pollen tube in the papilla cell wall. In the growing pollen tube, frequent changes of [Ca2+]cyt throughout the tube were observed.
Figure 6.
Periodic changes in the EYGP:ECFP ratio in a 5 × 5 μm2 region at the tip of the growing pollen tube within the papilla cell wall observed during in vivo pollination.
Figure 7.
Ca2+ distribution in the elongated pollen tube within the papilla cell wall. This image was constructed from a series of optical sections taken at 1.0-μm intervals. An increase in [Ca2+]cyt was observed near the penetration site (an arrow) into the papilla cell.
Ca2+ Dynamics in a Semi in Vivo Growing Pollen Tube
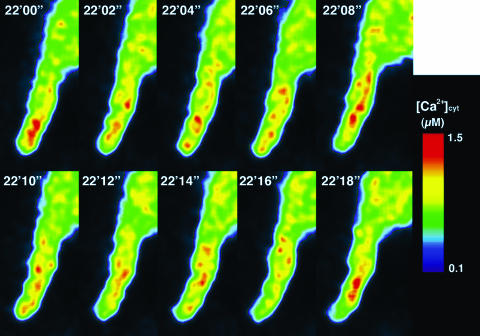
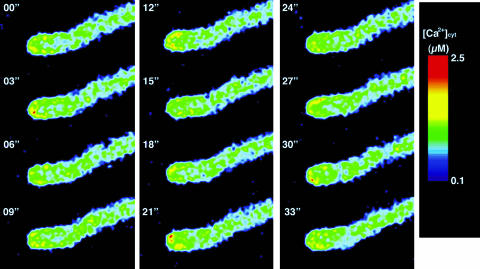
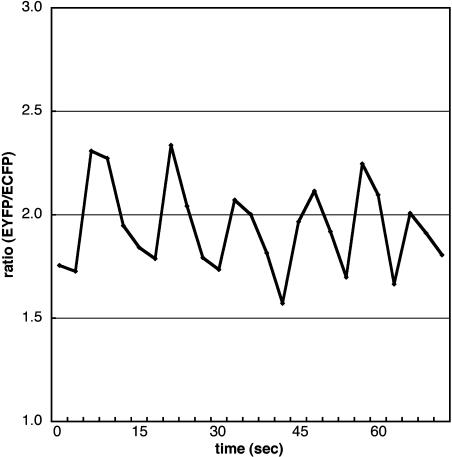
As demonstrated by the observed changes in [Ca2+]cyt, the [Ca2+]cyt oscillation period in the pollen grain was shorter in vivo than in vitro. Therefore, we speculated that molecules from the papilla cell affect [Ca2+]cyt distribution in the pollen tube. To study whether Ca2+ dynamics in a pollen tube passing through the pistil are different from those in vitro, we monitored [Ca2+]cyt in the growing pollen tube under semi in vivo conditions. Figure 8 shows the tip of the growing pollen tube at 3-s intervals. The mean value of the EYFP:ECFP fluorescence ratio at the tip was 1.98 ± 0.26 (n = 20), representing a mean [Ca2+]cyt of 1.42 μm (range, 0.91–2.18 μm; Table I), which was higher than that observed in vitro. The oscillation period varied between 9 and 15 s (Fig. 9).
Figure 8.
Ca2+ distribution in the growing pollen tube under semi in vivo conditions. Periodic changes in [Ca2+]cyt were observed at the tube's tip.
Figure 9.
Periodic changes in the EYGP:ECFP ratio in a 5 × 5-μm2 region at the tip of the growing pollen tube under semi in vivo conditions.
Ca2+ Dynamics in the Papilla Cell during in Vivo Pollination
The in vitro, nifedipine-induced inhibition of [Ca2+]cyt increase and pollen germination suggested that the Ca2+ required for pollen germination is internalized from the external medium. We hypothesized, then, that Ca2+ in the papilla cell would affect germination in vivo. To examine Ca2+ dynamics in the papilla cell during pollination, a construct encoding the YC3.1 gene driven by the SLG promoter, which is highly expressed in the stigma of Brassica, was transformed into Arabidopsis. We obtained five transgenic plants and selected the plant with the brightest YC3.1 fluorescence.
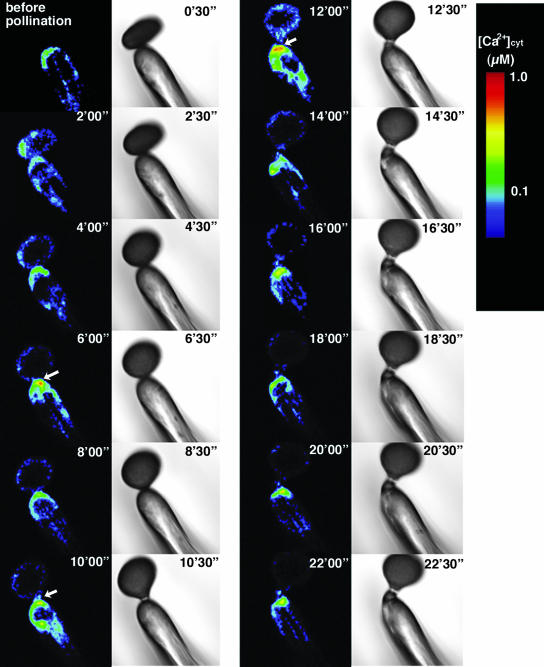
Before pollination, no local increase of [Ca2+]cyt was observed (before, Fig. 10). [Ca2+]cyt near the surface was estimated to be below 0.1 μm. During pollination, however, remarkable [Ca2+]cyt increases in the papilla cell directly apposing the pollen grain occurred several times (Fig. 10). Later in the hydration period (6′00″ in Fig. 10), increases in [Ca2+]cyt near the pollen attachment site were prominent. During this hydration period, [Ca2+]cyt in the pollen grain increased at the potential germination site (Fig. 4). Before pollen germination (9′00″ and 10′00″ in Fig. 10), [Ca2+]cyt was increased locally near the pollen attachment site, and in the pollen grain itself, [Ca2+]cyt was highest at the tip and decreased from there (Fig. 4). Furthermore, before penetration of the pollen tube into the papilla cell (12′00″ in Fig. 10), [Ca2+]cyt increased at the site of pollen tube attachment. The increase in [Ca2+]cyt continued during the elongation of the pollen tube. The maximum [Ca2+]cyt after pollination was estimated to be 0.8 μm. We observed a similar increase in [Ca2+]cyt during in vivo pollination in 20 independent experiments. These observations indicate that the increase in [Ca2+]cyt in the papilla cell is induced by pollination and that interaction between a pollen grain and a papilla cell during pollination is mediated through Ca2+.
Figure 10.
Ca2+ distribution in the papilla cell during pollination. Arrows represent notable increases in [Ca2+]cyt, which were typically observed 6, 10, and 12 min after pollination.
Growth Rate
We examined the mean growth rates of the growing pollen tubes using in vitro, in vivo, and semi in vivo techniques (Table I). The mean growth rate was fastest in vivo and slowest in vitro. Thus, the growth rate was inversely proportional to the period of [Ca2+]cyt oscillation at the tip of the pollen tube.
DISCUSSION
Using transgenic Arabidopsis expressing YC3.1, we have analyzed here for the first time, to our knowledge, the Ca2+ dynamics of a single pollen grain and a papilla cell during pollination. In the pollen grain, [Ca2+]cyt was increased at the potential germination site after hydration, and a tip-focused gradient of [Ca2+]cyt was formed before germination. After penetration into the papilla cell wall, rapid oscillation of [Ca2+]cyt was observed at the tip of the growing pollen tube. In the papilla cell, on the other hand, [Ca2+]cyt increased periodically during pollen hydration, after pollen protrusion, and during pollen tube penetration. These increases in [Ca2+]cyt in the papilla cell were correlated with the behavior of the attached pollen grain.
In the rehydrated pollen grain, a [Ca2+]cyt gradient was observed before germination both in vivo and in vitro. Treatment with the Ca2+ channel blocker nifedipine was shown to inhibit both [Ca2+]cyt gradient formation and pollen germination in vitro. Such inhibition has also been reported in Narcissus pseudonarcissus (Heslop-Harrison and Heslop-Harrison, 1992a, 1992b). These results suggest that a pregermination [Ca2+]cyt gradient, presumably formed by Ca2+ influx through L-type Ca2+ channels, is essential for pollen tube germination. However, the pulsatile growth of the pollen tube in Nicotiana and Petunia has been shown to be sensitive to gadolinium and lanthanum but not to nifedipine (Malho et al., 1995; Geitmann and Cresti, 1998; Feijo et al., 2001; Holdaway-Clarke and Hepler, 2003). Furthermore, in the growing hyphae of fungi, which display similar Ca2+ dynamics to the growing pollen tube, stretch-activated channels have been discovered on the plasma membrane, and the apical [Ca2+]cyt gradient can be blocked with gadolinium (Garrill et al., 1992, 1993). Finally, it has been suggested that stretch-activated channels are involved directly in pollen tube growth (Holdaway-Clarke and Hepler, 2003). However, it is not clear whether stretch-activated channels exist in the potential germination site of the pollen grain or whether the same Ca2+ channels are used both in establishing the pregermination [Ca2+]cyt gradient and in maintaining the tip of the growing pollen tube. To elucidate this issue, these in vitro effects of selective Ca2+ channel blockers on [Ca2+]cyt-gradient formation during pollen germination should be examined in vivo using transgenic Arabidopsis expressing YC3.1.
The in vivo-pollinated pollen tube exhibited a higher growth rate than those pollinated under in vitro or semi in vivo conditions. The oscillation frequency of [Ca2+]cyt at the tip was also fastest in the in vivo-pollinated pollen tubes. However, the [Ca2+]cyt level at the tip was intermediate in the in vivo pollination. The elongation rate of a growing neuron has been shown to be correlated with the intracellular calcium level at the growth cone, with maximal outgrowth occurring at an optimal [Ca2+]cyt in the growth cone (Kater and Mills, 1991). By analogy with these results in neurons, [Ca2+]cyt in in vivo-pollinated pollen tubes might be optimal for pollen tube growth. However, these results must be interpreted cautiously due to the wide variety of factors other than Ca2+ that presumably affect pollen tube growth.
Under semi in vivo germination conditions, the oscillation frequency of [Ca2+]cyt at the growing pollen tip and the pollen tube's growth rate were both faster than those observed under in vitro conditions. Furthermore, [Ca2+]cyt was higher semi in vivo compared to in vitro. Under semi in vivo conditions, the germination medium contains various substances from the pistil, which modify the growth rate of the pollen tube. In fact, transmitting tissue-specific protein, a substance secreted by the pistil, has been shown in tobacco to attract pollen tubes and stimulate their growth (Cheung et al., 1995). Thus, YC3.1-expressing pollen grains will be useful to search for molecules that mediate [Ca2+]cyt dynamics in the pollen tube.
[Ca2+]cyt in the apical region of the papilla cell was shown to increase from its low level before pollination at the site of pollen grain attachment during pollen hydration. This result suggests that a pollen grain induces a local increase of [Ca2+]cyt in an adjacent papilla cell. In addition, after this local [Ca2+]cyt increase in the papilla cell, a pregermination [Ca2+]cyt gradient formed in the pollinated pollen grain. These results suggest that the [Ca2+]cyt gradient is formed by the influx of Ca2+ from the papilla cell, although it is not clear whether the Ca2+ comes from the cytoplasm or cell wall of the papilla.
Reproduction in flowering plants comprises several sequential steps, from pollination to fertilization. In this study, we have monitored Ca2+ dynamics in the pollen grain, pollen tube, and papilla cell during the early steps of the reproductive process using YC3.1-expresseing Arabidopsis. This novel monitoring system makes possible the detailed study of Ca2+ dynamics throughout the reproductive process. Furthermore, this system should be useful for investigating mechanisms by which a pollen tube and style communicate.
MATERIALS AND METHODS
Transgenic Constructs
A cassette containing the YC3.1-coding region followed by the nopaline synthase polyadenylation signal from pBIYC3.1 was constructed by replacing the β-glucuronidase-coding sequence of pBI221 (CLONTECH Laboratories, Palo Alto, CA) with a YC3.1-coding region. The 1.5-kb fragment upstream of the Act1 gene, which is highly expressed in the reproductive tissues (An et al., 1996), was isolated from genomic DNA of a Brassica rapa S9 homozygote, and the 2.2-kb fragment upstream of the SLG9 gene, which is highly expressed in the papilla cell (Suzuki et al., 1997a), was obtained from a P1-derived artificial chromosome clone, E89 (Suzuki et al., 1997b). These fragments were reamplified by PCR using specific primers designed to add HindIII and XbaI, and SphI and SmaI restriction sites to the 5′ and 3′ ends, respectively, as follows. For amplification of the 5′-flanking region of the Act1 gene: sense primer, 5′-GAAGCTTTCTCTTTAAAAGTTAAGTTTTCTTTGTACATGTCTCTAAGC-3′; and antisense primer, 5′-GTCTAGATTTCTTCTACCTTTATGCAAATCCAAACATTGTTTAAAGATC-3′; for amplification of 5′-flanking region of the SLG9 gene: sense primer, 5′-GGATGCAAAGCATGCATTGAATTATTAGA-3′; and antisense primer, 5′-CCCGGGCTCTCTCCCCACCTTTTTCTTTC-3′. The amplified fragments were subcloned into pBIYC3.1 to yield Act1 promoter-YC3.1 and SLG9 promoter-YC3.1 constructs, respectively. These chimeric genes, comprising the 1.5-kb promoter region of the Act1 gene, the YC3.1 coding sequence, and the nopaline synthase transcription terminator, or the 2.2-kb promoter region of the SLG9 gene, the YC3.1 coding sequence, and the nopaline synthase transcription terminator, were inserted into the binary vector pSLJ1006 (Jones et al., 1992) to create pAct1YC3.1 and pSLG9YC3.1, respectively.
Transformation
pSLJAct1YC3.1 and pSLJSLG9YC3.1 plasmids were electroporated into the Agrobacterium tumefaciens strain EHA105 (Hood et al., 1993). The Agrobacterium infiltration procedure was performed on unopened flower buds of Arabidopsis, ecotype Columbia, as previously described (Bechtold et al., 1993). The transformed seeds were selected on 1/2 Murashige and Skoog plates containing kanamycin (50 μg/mL) and were analyzed by PCR amplification for the presence of YC3.1 genes.
Plant Growth Conditions
Arabidopsis (Arabidopsis thaliana) plants, ecotype Columbia, were grown in mixed soil in a growth chamber. The light intensity was 120 to 150 μmol m−2 s−1 during a 12-h daily light period. The temperature was 22°C ± 2°C.
Fluorescence Imaging
For in vitro imaging, pollen grains from freshly dehisced anthers of YC3.1-expressing plants were mounted on germination medium containing 2 mm CaCl2, 1.65 mm boric acid, 1% (w/v) agar (Ultra-low gelling temperature type IX-A; Sigma, St. Louis), and 17% (w/v) Suc (pH was adjusted with KOH to 7.0; Preuss et al., 1993) in moistened glass-bottomed dishes. After 2 to 6 h at 20°C, [Ca2+]cyt was monitored in pollen tubes growing out of the style using a spectral imaging fluorescence microscope system (LSM510 META, Carl Zeiss). This system is capable of resolving the spectra of fluorescence images; therefore, we could obtain images with no interference between overlapping fluorescence emissions (Haraguchi et al., 2002). Samples were scanned by an argon laser (excitation 458 nm). A Zeiss 63× W.Korr, 1.2 nicotianamine fluorescence objective was used for imaging of pollen tubes and an LD40× Korr, 0.6 nicotianamine fluorescence objective for imaging of papilla cells.
To examine the effect of a Ca2+ channel blocker, nifedipine (Sigma, Poole, UK) was dissolved in dimethyl sulfoxide and added to the above germination medium to give a final concentration of 10−5 to 10−4 m (Heslop-Harrison and Heslop-Harrison, 1992b). Dimethyl sulfoxide alone had no discernible effect on germination and tube growth.
For in vivo imaging, a pistil was mounted on a coverslip prior to pollination and fixed with double-sided tape. After a pollen grain was mounted on a papilla cell using a micromanipulator, [Ca2+]cyt was monitored under dry conditions using the microscope system described above.
For semi in vivo imaging, flowers of wild-type Arabidopsis were excised before dehiscion and attached to an agar plate after the anthers were removed from the flowers. Pollen grains from freshly dehisced anthers of YC3.1-expressing plants were attached to the wild-type stigma. Thirty minutes after pollination, the upper half of the pollinated pistil was excised and mounted on the above germination medium in a moistened glass-bottomed dish. After 2 h incubation at 20°C, [Ca2+]cyt in the pollen tubes growing through the style was monitored using the microscope system described above.
Ratiometric Imaging
Basic ECFP and EYFP spectra were obtained and registered using recombinant CFP-CaM protein and M13-YFP protein expressed in Escherichia coli or onion cells that transiently express the 35S promotor-CFP-CaM gene or the 35S promotor-M13-YFP gene. The autofluorescence spectrum for pollen grains was captured and registered using wild plants. After YC3.1 fluorescence was captured in each experiment, the images could be split into ECFP, EYFP, and autofluorescence channels based on the registered spectra. Ratiometric images (EYFP/ECFP) were obtained using image processing software (Laser Lixel, Bio-Rad Laboratories, Hercules, CA).
Calibration of YC3.1 Ratiometric Changes
Calibration of [Ca2+]cyt was carried out as described previously (Allen et al., 1999). Serial dilutions of purified YC3.1 protein were made in Ca2+ calibration buffer (Molecular Probes, Eugene, OR), in which free Ca2+ concentration ranged from 0 μm to 39 μm. YC3.1 dilutions that gave similar intensities to those seen in YC3.1-expressing pollen tubes were used to determine Rmin and Rmax. And values for Rmin of 0.92 and Rmax of 3.11 were obtained. These values of Rmin and Rmax were used to convert YC3.1 fluorescence ratios into [Ca2+]cyt by fitting them to the YC3.1 in vitro calibration curve (see Miyawaki et al., 1999; Fig. 2B).
Growth Rate
We printed images of EYFP fluorescence in the growing pollen tube and measured the length of the tube using a ruler. The growth rate was calculated from the length of elongation between time points and the interval.
Acknowledgments
We thank Miss Yamaguchi, Mrs. Onishi, Mrs. Yoneyama, Miss Sugita, and Mrs. Ichikawa for their technical assistance.
This work was supported in part by a Grant-in-Aid Creative Scientific Research (grant no. 16GS0316, to A. I.) from Japan Society for the Promotion of Science (JSPS), by a Grant-in-Aid for Special Research (C, grant no. 13640649, to M. I.) from the Ministry of Education, Culture, Sports, Science and Technology of Japan (MEXT), and by the 21st Century Centers of Excellence (COE) Program to Nara Institute of Science and Technology from MEXT.
Article, publication date, and citation information can be found at www.plantphysiol.org/cgi/doi/10.1104/pp.104.046961.
References
- Allen GJ, Chu SP, Harrington CL, Schumacher K, Hoffman T, Tang YY, Grill E, Schroeder JI (2001) A defined range of guard cell calcium oscillation parameters encodes stomatal movements. Nature 411: 1053–1057 [DOI] [PubMed] [Google Scholar]
- Allen GJ, Chu SP, Schumacher K, Shimazaki CT, Vafeados D, Kemper A, Hawke SD, Tallman G, Tsien RY, Harper JF, et al (2000) Alteration of stimulus-specific guard cell calcium oscillations and stomatal closing in Arabidopsis det3 mutant. Science 289: 2338–2342 [DOI] [PubMed] [Google Scholar]
- Allen GJ, Kwak JM, Chu SP, Llopis J, Tsien RY, Harper JF, Schroeder JI (1999) Cameleon calcium indicator reports cytoplasmic calcium dynamics in Arabidopsis guard cells. Plant J 19: 735–747 [DOI] [PubMed] [Google Scholar]
- An YQ, Huang S, McDowell JM, McKinney EC, Meagher RB (1996) Conserved expression of the Arabidopsis ACT1 and ACT3 actin subclass in organ primordia and mature pollen. Plant Cell 8: 15–30 [DOI] [PMC free article] [PubMed] [Google Scholar]
- Bechtold N, Ellis J, Pelletier G (1993) In planta Agrobacterium mediated gene transfer by infiltration of adult Arabidopsis thaliana plants. C R Acad Sci Paris Life Sci 316: 1194–1199 [Google Scholar]
- Brewbaker JL, Kwack BH (1963) The essential role of calcium ion in pollen germination and pollen tube growth. Am J Bot 50: 859–865 [Google Scholar]
- Cheung AY, Wang H, Wu H-m (1995) A floral transmitting tissue-specific glycoprotein attracts pollen tubes and stimulates their growth. Cell 82: 383–393 [DOI] [PubMed] [Google Scholar]
- Dearnaley JDW, Levina NN, Lew RR, Heath IB, Goring DR (1997) Interrelationships between cytoplasmic Ca peaks, pollen hydration and plasma membrane conductances during compatible and incompatible pollinations of Brassica napus papillae. Plant Cell Physiol 38: 985–999 [DOI] [PubMed] [Google Scholar]
- Dierkes PW, Wende V, Hochstrate P, Schlue WR (2004) L-type Ca2+ channel antagonists block voltage-dependent Ca2+ channel in identified leech neurons. Brain Res 1013: 159–167 [DOI] [PubMed] [Google Scholar]
- Feijo JA, Sainhas J, Holdaway-Clarke T, Cordeiro MS, Kunkel JG, Hepler PK (2001) Cellular oscillations and the regulation of growth: the pollen tube paradigm. Bioessays 23: 86–94 [DOI] [PubMed] [Google Scholar]
- Franklin-Tong VE, Ride JP, Read ND, Trewavas AJ, Franklin FCH (1993) The self-incompatibility response in Papaver rhoeas is mediated by cytosolic free calcium. Plant J 4: 163–177 [Google Scholar]
- Garrill A, Lew RR, Heath IB (1992) Stretch-activated Ca2+ and Ca2+-activated K+ channels in the hyphal tip plasma membrane of oomycete Saprolegnia ferax. J Cell Science 101: 721–730 [Google Scholar]
- Garrill A, Jackson SL, Lew RR, Heath IB (1993) Ion channel activity and tip growth: tip-localized stretch-activated channels generate an essential Ca2+ gradient in the oomycete Saprolegnia ferax. Eur J Cell Biol 60: 358–365 [PubMed] [Google Scholar]
- Geitmann A, Cresti M (1998) Ca2+ channels control the rapid expansions in pulsating growth of Petunia hybrida pollen tubes. J Plant Physiol 152: 439–447 [Google Scholar]
- Haraguchi T, Shimi T, Koujin T, Hashiguchi N, Hiraoka Y (2002) Spectral imaging fluorescence microscopy. Genes Cell 7: 881–887 [DOI] [PubMed] [Google Scholar]
- Heslop-Harrison J, Heslop-Harrison Y (1992. a) Germination of monocolpate angiosperm pollen: evolution of the cytoskelton and wall during hydration, activation and tube emergence. Ann Bot (Lond) 69: 385–394 [Google Scholar]
- Heslop-Harrison J, Heslop-Harrison Y (1992. b) Germination of monocolpate angiosperm pollen: effects of inhibitory factors and the Ca2+-channel blocker nifedipine. Ann Bot (Lond) 69: 395–403 [Google Scholar]
- Holdaway-Clarke TL, Feijo JA, Hackett GR, Kunkel JG, Hepler PK (1997) Pollen tube growth and the intracellular cytosolic calcium gradient oscillate in phase while extracellular calcium influx is delayed. Plant Cell 9: 1999–2010 [DOI] [PMC free article] [PubMed] [Google Scholar]
- Holdaway-Clarke TL, Hepler PK (2003) Control of pollen tube growth: role of ion gradients and fluxes. New Phytol 159: 539–563 [DOI] [PubMed] [Google Scholar]
- Hood EE, Gelvin SB, Melchers LS, Hoekema A (1993) New Agrobacterium helper plasmids for gene transfer to plants. Transgenic Res 2: 208–218 [Google Scholar]
- Jones JDG, Shlumukov L, Carland F, English J, Scofield SR, Bishop GJ, Harrison K (1992) Effective vectors for transformation, expression of heterologous genes, and assaying transposon excision in transgenic plants. Transgenic Res 1: 285–297 [DOI] [PubMed] [Google Scholar]
- Kater SB, Mills LR (1991) Regulation of growth cone behavior by calcium. J Neurosci 11: 891–899 [DOI] [PMC free article] [PubMed] [Google Scholar]
- Knight MR, Campbell AK, Smith SM, Trewavas AJ (1991) Transgenic plant aequorin reports the effects of touch and cold-shock and elicitors on cytoplasmic calcium. Nature 8: 524–526 [DOI] [PubMed] [Google Scholar]
- Malho R, Read ND, Pais M, Trewavas AJ (1994) Role of cytosolic calcium in the reorientation of pollen tube growth. Plant J 5: 331–341 [Google Scholar]
- Malho R, Read ND, Trewavas AJ, Pais MS (1995) Calcium channel activity during pollen tube growth and reorientation. Plant Cell 7: 1173–1184 [DOI] [PMC free article] [PubMed] [Google Scholar]
- Messerli M, Robinson KR (1997) Tip localized Ca2+ pulses are coincident with peak pulsatile growth rates in pollen tubes of Lilium logiflorum. J Cell Sci 110: 1269–1278 [DOI] [PubMed] [Google Scholar]
- Messerli MA, Creton R, Jaffe LF, Robinson KR (2000) Periodic increases in elongation rate precede increases in cytosolic Ca2+ during pollen tube growth. Dev Biol 222: 84–98 [DOI] [PubMed] [Google Scholar]
- Miyawaki A, Griesbeck O, Tsien RY (1999) Dynamic and quantitative Ca2+ measurements using improved cameleons. Proc Natl Acad Sci USA 96: 2135–2140 [DOI] [PMC free article] [PubMed] [Google Scholar]
- Miyawaki A, Llopis J, Heim R, McCaffery JM, Adams JA, Ikura M, Tsien RY (1997) Fluorescent indicators for Ca2+ based on green fluorescent proteins and calmodulin. Nature 388: 834–835 [DOI] [PubMed] [Google Scholar]
- Pierson ES, Miller DD, Callaham DA, Shipley AM, Rivers BA, Cresti M, Hepler PK (1994) Pollen tube growth is coupled to the extracellular calcium ion flux and the intracellular calcium gradient: effect of BAPTA-type buffers and hypertonic media. Plant Cell 6: 1815–1828 [DOI] [PMC free article] [PubMed] [Google Scholar]
- Pierson ES, Miller DD, Callaham DA, van Aken J, Hackett G, Hepler PK (1996) Tip-localized entry fluctuates during pollen tube growth. Dev Biol 174: 160–173 [DOI] [PubMed] [Google Scholar]
- Plieth C (2001) Plant calcium signaling and monitoring: pros and cons and recent experimental approaches. Protoplasma 218: 1–23 [DOI] [PubMed] [Google Scholar]
- Preuss D, Lemieux B, Yen G, Davis RW (1993) A conditional sterile mutation eliminates surface components from Arabidopsis pollen and disrupts cell signaling during fertilization. Genes Dev 7: 974–985 [DOI] [PubMed] [Google Scholar]
- Rathore KS, Cork RJ, Robinson KR (1991) A cytoplasmic gradient of Ca is correlated with the growth of Lily pollen tubes. Dev Biol 148: 612–619 [DOI] [PubMed] [Google Scholar]
- Robinson KR, Messerli M (2002) Pulsating ion fluxes and growth at the pollen tube tip. Science 162: 51–53 [DOI] [PubMed] [Google Scholar]
- Shivanna KR, Rangaswamy NS (1992) Pollen Biology. Springer-Verlag, Berlin
- Suzuki G, Watanabe M, Isogai A, Hinata K (1997. a) Highly conserved 5′-flanking regions of two self-incompatibility genes, SLG9 and SRK9. Gene 191: 123–126 [DOI] [PubMed] [Google Scholar]
- Suzuki G, Watanabe M, Toriyama K, Isogai A, Hinata K (1997. b) Direct cloning of the Brassica S locus by using a P1-derived artificial chromosome (PAC) vector. Gene 199: 133–137 [DOI] [PubMed] [Google Scholar]
- Taylor LP, Hepler PK (1997) Pollen germination and tube growth. Annu Rev Plant Physiol Plant Mol Biol 48: 461–491 [DOI] [PubMed] [Google Scholar]


