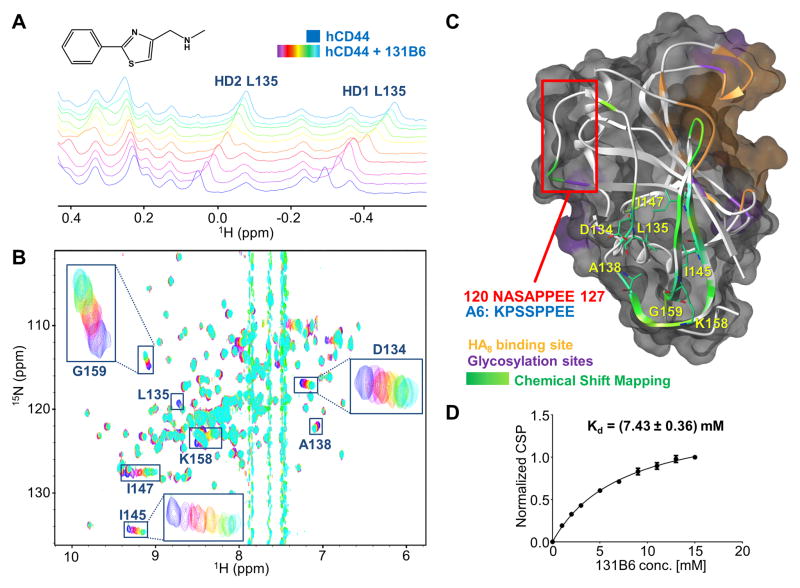
Figure 3. Binding validation of compound 2.
(A) NMR titration of 131B6 (structure on the upper panel) against 20 μM of 15N-hCD44(21–178) using 1D 1H-aliphatic and 2D 15N-sofastHMQC spectra (B). In both experiments, the spectra of the apo protein are depicted in blue, while the spectra in purple to light-blue were collected in presence of the fragment in increasing concentration starting from 1 mM to 15 mM respectively. The resonances corresponding to the most perturbed residues are labeled.
(C) Semitransparent molecular surface representation of the homology model of hCD44 built with SWISS-MODEL [22a] [22b] [22c] [22d] using the structure of mCD44 in complex with HA8 (PDB 2JCR) as template. The HA8 binding pocket is depicted in orange while in purple are highlighted the putative glycosylation sites. The Chemical Shift Perturbations induced by 131B6 are mapped on the secondary structure (ribbon): Δδ > 0.14 ppm in green; Δδ < 0.14 ppm in light green. The most perturbed residues are labeled and localized in a putative back pocket opposite from the HA8 binding pocket. The red square indicates the portion of hCD44 with sequence homology with A6 peptide.
(D) Determination of Kd of 131B6 using the chemical shift perturbation titrations from the 2D [1H,15N]-sofasHMQC experiments; Kd = 7.43 mM)

