

Recently UNAIDS, PEPFAR and the WHO have expressed interest in using geographic targeting strategies when implementing interventions for reducing HIV transmission in Sub-Saharan Africa (SSA).1 If geographic targeting is used a disproportionate amount of the resources that are available for prevention will be allocated to geographic locations where HIV prevalence is substantially higher than average. Mathematical models have shown that using geographic targeting to allocate limited resources would, under certain assumptions, be a cost-effective strategy for controlling HIV epidemics in SSA.2 UNAIDS has begun to construct a quantitative framework that can be used to design geographic targeting strategies for SSA. Specifically, they have constructed HIV Epidemic Surface Prevalence (ESP) maps for many countries in the region.3 These maps show the proportion of the adult population that is living with HIV infection. However, the ESP maps they have constructed are not gender-specific. Here we show the importance of constructing gender-specific ESP maps. We focus on Lesotho, a country with an HIV epidemic that UNAIDS has identified as a priority for elimination.4 HIV prevalence in Lesotho is 23%.5
We used geo-referenced HIV-testing data from the 2010 Lesotho Demographic and Health Survey (LDHS), a nationally representative survey implemented using a two-stage cluster design that sampled 395 cluster locations.6 Response rates were high: 98% in women, 95% in men. HIV-testing rates were also high: 94% in women, 88% in men. Approximately 7,000 individuals, who were between 15 and 49 years old, participated in the 2010 LDHS: ~4,000 women, and ~3,000 men. Using these data we calculated that at the national-level HIV prevalence is substantially higher in women (27%) than in men (18%).5 Notably, Heckman-type selection models have been used to rule out selection bias in prevalence estimates based on data from the 2010 LDHS.7
UNAIDS has previously constructed, using data from the 2010 LDHS, an HIV ESP map for Lesotho.8 To generate the map they used an adaptive bandwidth kernel density (ABKD) estimation method9 to spatially smooth and interpolate the geo-referenced HIV-testing data. The ABKD method estimates prevalence, at each geographic location, by constructing “smoothing circles”. Each circle contains the same number of individuals that were tested for HIV. As a consequence, the circles are small when the population density is high and large when the population density is low. We employed the same methodology as UNAIDS, and analyzed the same data; however, we constructed two HIV ESP maps. One ESP map shows the geographic variation in HIV prevalence in women (figure 1A), the other shows the geographic variation in HIV prevalence in men (figure 1B). The isoclines on the maps (green curves, figure 1) indicate the size of the radii (in km) of the circles that were used to smooth the HIV-testing data; each circle encompasses 200 individuals.
Figure 1.
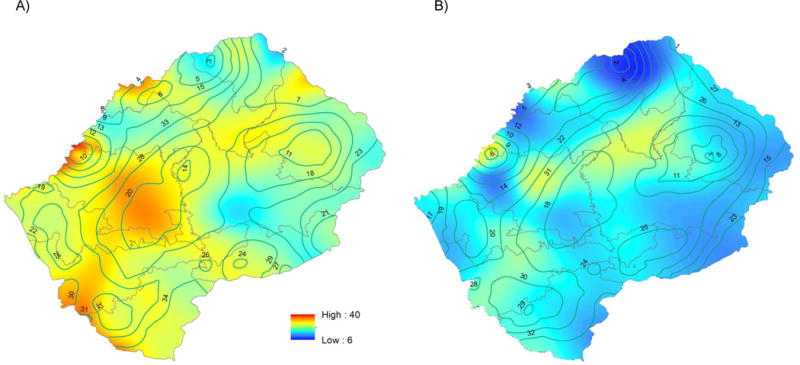
HIV epidemic surface prevalence maps for A) women and B) men in Lesotho.
The gender-specific HIV ESP maps show that there are considerable differences between women and men. These differences are both quantitative (in terms of the severity of the epidemic) and qualitative (in terms of the observable geospatial patterns in the epidemic). For both genders, there is substantial geographic variability in HIV prevalence. However, throughout the country, HIV prevalence is always substantially higher in women (15% to 45%, figure 1A) than in men (5% to 30%, figure 1B). There are four geographic areas where HIV prevalence is extremely high in both genders: ≥ 35% in women and ≥ 25% in men. One of these areas is in the interior of the country and encompasses two cities: Roma and Semonkong. The other three areas are very close to the South African border; each area encompasses a city: Maseru (the capital of Lesotho), Maputsoe and Mohale’s Hoek. Notably, there is an additional area in the interior of the country where HIV prevalence is high in men but not in women: this area is where the Katse dam, one of the largest dams in SSA, is located.
UNAIDS, PEPFAR, and the WHO propose to use ESP maps as health policy tools, but they have chosen to ignore gender. Notably, throughout SSA, women are at greater risk of acquiring HIV than men.10,11 Furthermore, the burden of disease in every country in SSA is greater in women than in men. These gender differences in risk, and disease burden, are made apparent by constructing gender-specific ESP maps. A comparison of these maps (as we have shown) can lead to the identification of substantial gender differences in terms of the severity of the epidemic, and in the location of high prevalence areas. We propose that global health organizations use gender-specific ESP maps as the foundation for designing geographic targeting strategies. Employing such an approach would increase the efficiency, and hence the cost-effectiveness, of eliminating HIV in SSA.
Acknowledgments
JTO and SB acknowledge the financial support of the National Institute of Allergy and Infectious Diseases, National Institutes of Health (grant R01 AI116493).
Footnotes
Contributors
JTO and SB developed the concept, and drafted the manuscript together. JTO made the figure.
Declaration of interests
JTO and SB declare that they have no conflicts of interest.
References
- 1.UNAIDS. Location, location: connecting people faster to HIV services. Geneva: UNAIDS; 2013. [Google Scholar]
- 2.Gerberry DJ, Wagner BG, Garcia-Lerma JG, Heneine W, Blower S. Using geospatial modelling to optimize the rollout of antiretroviral-based pre-exposure HIV interventions in Sub-Saharan Africa. Nat Commun. 2014;5:5454. doi: 10.1038/ncomms6454. [DOI] [PMC free article] [PubMed] [Google Scholar]
- 3.Larmarange J, Bendaud V. HIV estimates at second subnational level from national population-based surveys. AIDS. 2014;28(Suppl 4):S469–76. doi: 10.1097/QAD.0000000000000480. [DOI] [PMC free article] [PubMed] [Google Scholar]
- 4.UNAIDS. 90-90-90: An ambitious treatment target to help end the AIDS epidemic. 2014 [Google Scholar]
- 5.Coburn BJ, Okano JT, Blower S. Current drivers and geographic patterns of HIV in Lesotho: implications for treatment and prevention in Sub-Saharan Africa. BMC Med. 2013;11(1):224. doi: 10.1186/1741-7015-11-224. [DOI] [PMC free article] [PubMed] [Google Scholar]
- 6.Ministry of Health and Social Welfare (Lesotho) Lesotho Demographic and Health Survey 2009. Calverton: ICF International; 2010. [Google Scholar]
- 7.Clark SJ, Houle B. Validation, replication, and sensitivity testing of Heckman-type selection models to adjust estimates of HIV prevalence. PLoS ONE. 2014;9(11):e112563. doi: 10.1371/journal.pone.0112563. [DOI] [PMC free article] [PubMed] [Google Scholar]
- 8.UNAIDS. Lesotho: Developing subnational estimates of HIV prevalence and the number of people living with HIV. Geneva: UNAIDS; 2014. [Google Scholar]
- 9.Larmarange J, Vallo R, Yaro S, Msellati P, Meda N. Methods for mapping regional trends of HIV prevalence from Demographic and Health Surveys (DHS) Cybergeo Europ J Geo. 2011;558 [Google Scholar]
- 10.Global regional, and national age-sex specific all-cause and cause-specific mortality for 240 causes of death, 1990–2013: a systematic analysis for the Global Burden of Disease Study 2013. Lancet. 2015;385(9963):117–71. doi: 10.1016/S0140-6736(14)61682-2. [DOI] [PMC free article] [PubMed] [Google Scholar]
- 11.Hegdahl HK, Fylkesnes KM, Sandoy IF. Sex Differences in HIV Prevalence Persist over Time: Evidence from 18 Countries in Sub-Saharan Africa. PLoS ONE. 2016;11(2):e0148502. doi: 10.1371/journal.pone.0148502. [DOI] [PMC free article] [PubMed] [Google Scholar]