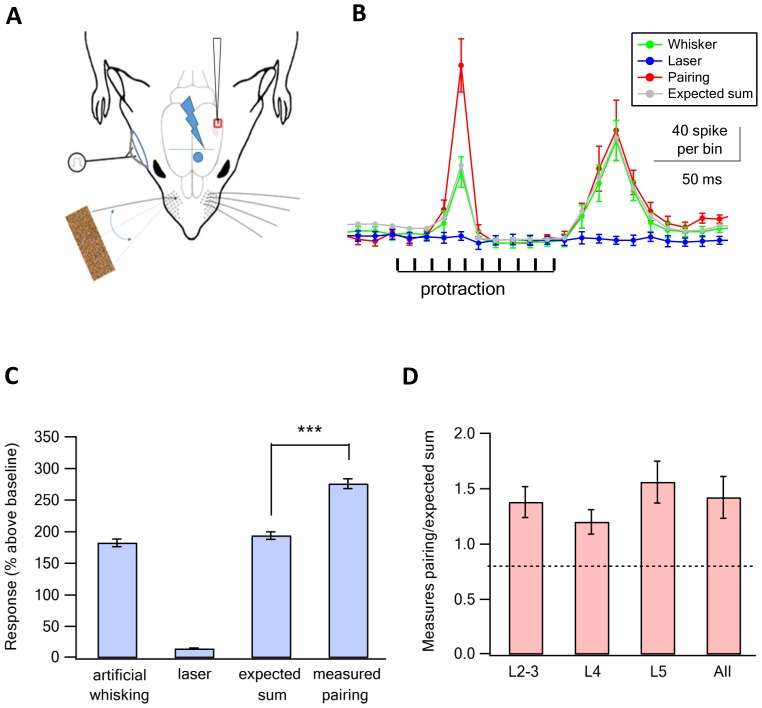
Figure 3. Supra-linear summation of paired optogenetic vM1 activation and artificial whisking against sandpaper.
(A) Scheme of the experimental design with the recording electrode in vS1, optogenetic stimulation of vM1 and artificial whisking against sandpaper by electrically stimulating the buccolabialis nerve. The timing of individual nerve stimulation and protraction phase is marked in black. (B) Peri-stimulus histograms (PSTH, mean ± SEM) recorded from a vS1 neuron during solitary vM1 optogenetic stimulation (blue), solitary artificial whisking against sandpaper (green), and paired vM1-vibrissa stimulation (red). In addition, the expected linear sum of the solitary vM1 stimulation and artificial whisking is shown (gray). (C) Average (mean ± SEM) responses (presented as percent above the pre-stimulus control activity) of vS1 neurons to the different stimulation conditions (294 neurons from six rats). Note that the recorded activity during paired vM1-vibrissa stimulation was significantly larger than the linear sum of the response to solitary vM1 activation and artificial whisking. ***p<0.001 with the paired student's t-test. (D) Average (mean ± SEM) supra-linearity of the paired vM1-vibrissa stimulation response (measured/expected linear sum) presented for all neurons and for neurons in the different putative neocortical layers, 76 neurons from putative layers 2–3, 80 neurons from putative layer 4 and 138 neurons in putative layer 5.

