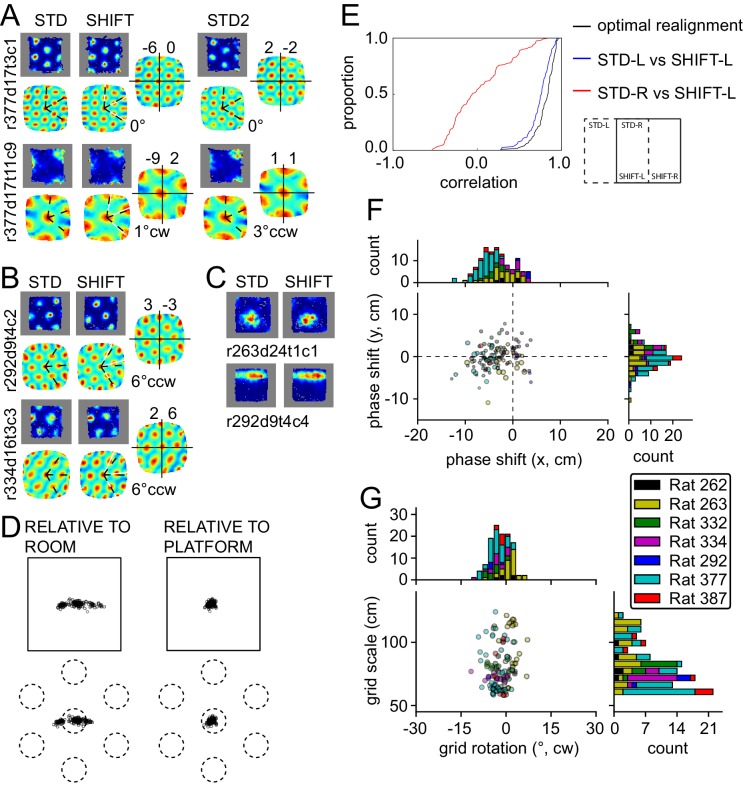
Figure 4. Response to platform translations (SHIFT).
(A–C) Examples of rate maps illustrated as in Figure 2A. Grey areas outline identical subregions of the view frames of a camera positioned over the standard position of the platform and a separate camera positioned over the shifted position and aligned precisely with the first camera. (A) Examples of grids that shifted with the platform, with a small under-translation. (B) Examples of grids that shifted with the platform but that rotated slightly CCW. (C) Examples of additional spatial cells that shifted their firing fields with the platform. (D) Grid phase shifts relative to the platform or room, illustrated as in Figures 2C and 3F. The 119 units include 77 that were recorded in the ROT20 (Figure 2B) and/or ROT70 (Figure 3A) manipulations on the same day. Although overall the phase shifts relative to the platform were much smaller than shifts relative to the room, note that a proportion of the grids showed a very small phase shift relative to the room as well. These are grids with spatial periods that were similar to the magnitude of the shift itself. (E) Cumulative distributions of correlations of STD vs SHIFT rate maps from different sections of the platform. In the SHIFT condition, the left half of the platform (SHIFT-L) offers a strong, direct test of the competing hypotheses. If the grids were controlled strongly by the platform, then the SHIFT-L rate maps should be highly correlated with the STD-L rate maps. In contrast, if the grids were controlled strongly by the room, then the SHIFT-L rate maps should be highly correlated with the STD-R rate maps. The STD-L vs. SHIFT-L correlations (blue) are much higher than the STD-R vs. SHIFT-L correlations (red), demonstrating conclusively that the grids are primarily controlled by the platform frame of reference. Nonetheless, after the grids are realigned to correct for any rotational or phase adjustments, the correlations are even higher (black), demonstrating that the room still exerts a measurable influence on the grids. (F) Individual grid phase shifts in the platform frame of reference, showing a small but consistent translational offset in SHIFT, in the direction opposite to the direction of platform shift in most animals (same data as in Figure 4D). Dot size is proportional to the grid scale measured in the STD session. (G) Individual grid rotations showing a minor CCW rotation in SHIFT in most animals.

