. 2017 Jan 13;6:e21354. doi: 10.7554/eLife.21354

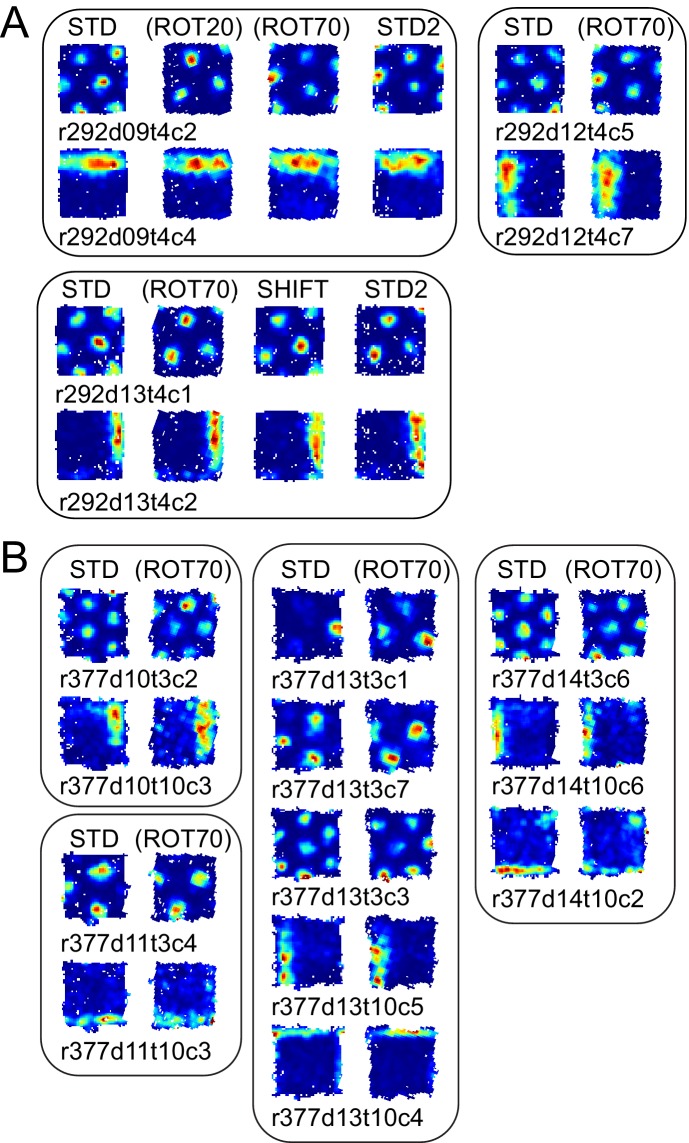
Figure 7. More examples of grid and boundary cells recorded simultaneously from rats 292 (A) and 377 (B).

Each simultaneously recorded set is in a separate bounding box. The rate maps for sessions labeled in parentheses were rotated to aid visual comparison of the changing firing patterns of grid cells vs. the repeating patterns of boundary cells. Rate maps for all sessions in which these cells were recorded are given in Figure 6, Figure 6—figure supplement 2 (rat 292) and Figure 7—figure supplement 1 (rat 377).

DOI: http://dx.doi.org/10.7554/eLife.21354.021

Figure 7.

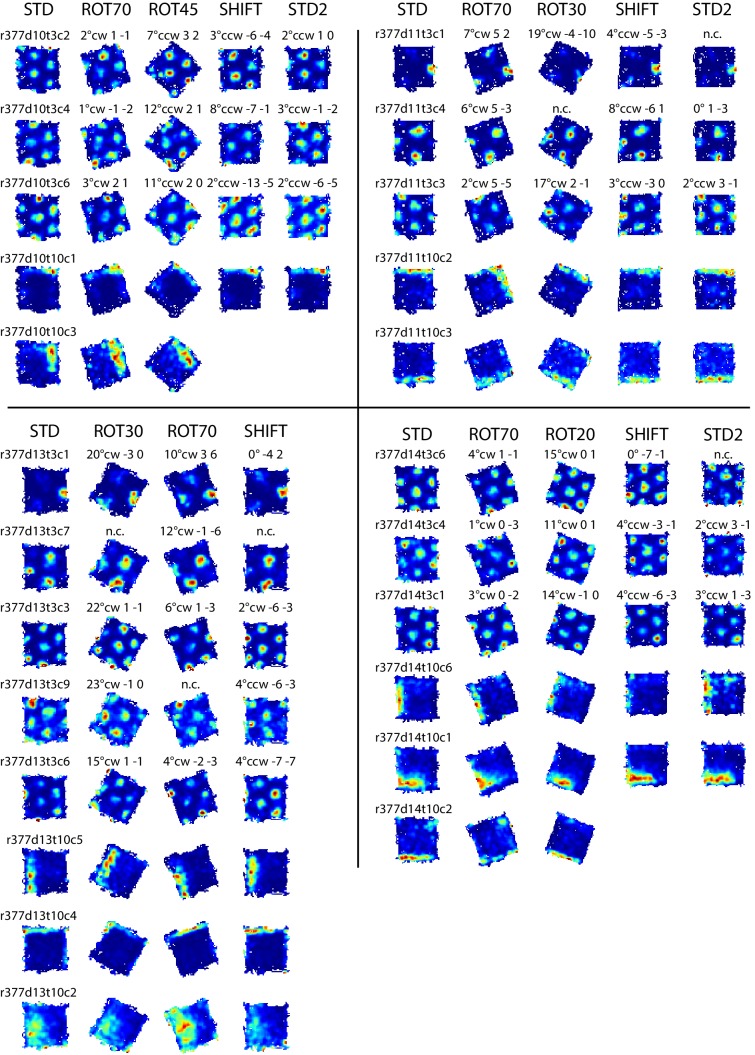
Figure 7—figure supplement 1. Examples of grid and boundary cells recorded simultaneously from rat 377.

Figure 7—figure supplement 1.

Rate maps for all sessions in which the cells shown in Figure 7B were recorded, and other simultaneously recorded grid and boundary cells. Rate maps are grouped by day of recording as in Figure 7B (day 10, 11, 13, 14). Rate maps from manipulated conditions are annotated with the grid rotation and x, y components of the phase shifts measured in cm as elsewhere (see Figure 2). In ROT70 and ROT45 the firing patterns of several boundary cells tracked the same geometric boundary, whereas grids remained more strongly anchored to the room (see Figure 3A,D and Figure 3—figure supplements 1 and 2), generating the grid-boundary dissociations highlighted in Figure 7B. However, a number of exceptions were observed (e.g., r377d10t10c1, r377d11t10c2, r377d14t10c1) in which the firing pattern of the boundary cell seems to have spread across two walls in ROT70, perhaps consistently with the orientation concurrently expressed by the grids in accordance with the Boundary Vector Cell model (Hartley et al., 2000; Barry et al., 2006).