Abstract
Objective
To evaluate tumor vasculature with optical coherence tomography (OCT) angiography (OCTA) in malignant iris melanomas and benign iris lesions.
Design
Cross-sectional observational clinical study.
Participants
Patients with iris lesions and healthy volunteers.
Methods
Eyes were imaged using OCTA systems operating at 1050 and 840 nm wavelengths. Three-dimensional OCTA scans were acquired. Iris melanomas patients treated with radiation therapy were imaged again after I-125 plaque brachytherapy at 6 and 18 months.
Main Outcome Measures
OCT and OCTA images, qualitative evaluation of iris and tumor vasculature and quantitative vessel density.
Results
One eye each of eight normal volunteers and nine patients with iris melanomas or benign iris lesions including freckles, nevi, and an iris pigment epithelial (IPE) cyst were imaged. The normal iris has radially-oriented vessels within the stroma on OCTA. Penetration of flow signal in normal iris depended on iris color, with best penetration seen in light to moderately pigmented irides. Iris melanomas demonstrated tortuous and disorganized intratumoral vasculature. In two eyes with nevi there was no increased vascularity; in another, fine vascular loops were noted near an area of ectropion uveae. Iris freckles and the IPE cyst did not have intrinsic vascularity. The vessel density was significantly higher within iris melanomas (34.5%±9.8%, p<0.05) than in benign iris nevi (8.0%±1.4%) or normal irides (8.0%±1.2%). Tumor regression after radiation therapy for melanomas was associated with decreased vessel density. OCTA at 1050 nm provided better visualization of tumor vasculature and penetration through thicker tumors than at 840 nm. But in very thick tumors and highly pigmented lesions even 1050 nm OCTA could not visualize their full thickness. Interpretable OCTA images were obtained in 82% participants in whom imaging was attempted.
Conclusions
This is the first demonstration of OCTA in iris tumors. OCTA may provide a dye-free, no-injection, cost-effective method for monitoring a variety of tumors including iris melanocytic lesions for growth and vascularity. This could be helpful in evaluating tumors for malignant transformation and response to treatment. Penetration of the OCT beam remains a limitation for highly pigmented tumors, as does the inability to image the entire iris in a single field.
Introduction
Optical coherence tomography angiography (OCTA) is a new, noninvasive microvascular imaging method that provides angiography by detecting changes in the OCT signal as blood cells travel through the vessel lumen. This technique does not require injected contrast, which makes it safer and less expensive than traditional ophthalmic angiography techniques. OCTA was initially applied to evaluate posterior segment eye conditions such as retinopathies or choroidal neovascularization.1,2 Evaluation of intratumoral vessels in humans with OCTA is an emerging technique,3 as is OCT of the anterior eye.4 Most clinical ophthalmic OCT systems operate at 840 nm wavelength that penetrates poorly through tumor tissue. We have developed an OCTA system operating at a longer wavelength of 1050 nm to improve penetration into turbid (highly scattering)5 tissues such as the iris and tumors. The approach was chosen as scattering loss decreases with a longer wavelength6 and we use this system to investigate OCTA in iris tumors for the first time.
Iris melanomas represent approximately 4 percent of uveal melanomas, and while they tend to be less aggressive than posterior uveal melanomas arising in the ciliary body and choroid, these tumors are associated with risk of metastatic disease as well as vision loss.7,8 Decreased vision can occur due to direct tumor effects, such as development of cataract or progressive glaucoma, or be associated with treatment of iris tumors with excisional surgery or radiation. Metastatic disease associated with iris melanomas occurs in 3–11% of patients and remains very difficult to treat, causing death in the majority of those patients in whom metastatic disease develops.8–10 Due to the significant morbidity of treatment, many iris tumors, even some felt clinically to be melanomas, are observed until they show signs associated with high risk of metastasis. One of the clinical features likely to be indicative of a more aggressive tumor with metastatic potential is increased vascularity.
The purpose of this pilot study was to characterize iris lesions using OCTA, comparing vascular patterns and vessel density between iris melanomas and other melanocytic lesions or lesions which may simulate melanomas. We also present OCTA imaging of iris melanomas treated with radiation to evaluate changes in vascularity associated with tumor regression after treatment.
Participants and Methods
Subjects
Participants of this cross-sectional observational pilot study were recruited at Casey Eye Institute, Oregon Health and Science University (OHSU, Portland, OR) from October 2014 to December 2015. This study followed the tenets of the Declaration of Helsinki and was in accord with the Health Insurance Portability and Accountability Act of 1996. The study protocol was approved by OHSU institutional review board. Clinical trial registration was not required due to the observational nature of the study. All subjects were at least 18 year old. Written informed consent was obtained from all subjects. Participants with iris lesions were enrolled from the patients seen at the Ocular Oncology Service. Normal participants were recruited from volunteers.
Clinical Examination
All patients with iris lesions underwent standard clinical evaluation with slit lamp examination and imaging including slit lamp photos, ultrasound biomicroscopy (UBM), and fluorescein angiography (FA), if indicated for clinical care. The clinical examination and review of imaging was performed by an expert in ocular oncology (A.S.) with experience in the clinical diagnosis of iris melanocytic tumors. Two subjects with iris melanomas were treated with I-125 radioactive plaque for a total dose of 85 Gy. Fine needle aspirate biopsy was offered to each patient treated for iris melanoma, but was performed only on one subject, as the others declined biopsy. All normal volunteers had slit lamp photos that were reviewed by an ophthalmologist (A.S.).
OCT angiography
One eye from each participant was evaluated using a swept-source, anterior segment OCT system operating at 1050 nm wavelength and 100 KHz axial scan repetition rate. For some participants, additional scans using the AngioVue OCTA software on Avanti RTVue-XR spectral-domain OCT system (RTVue-XR; Optvue, Inc.; Fremont, CA, USA) operating at 840 nm were also obtained. Participants’ pupils were not pharmacologically dilated, with the exception of one patient with an iris pigment epithelial cyst, whose pupil was dilated to allow visualization of the cyst. The ambient room lights were on during image acquisition. Three-dimensional (3D) horizontal and vertical OCTA raster data was acquired over 6 mm × 6 mm regions with scan depth of 5 mm in tissue. Each OCTA raster scan took about 2.7 seconds to acquire 3 repeated B-scans at 300 raster positions with each B-scan consisting of 300 axial scans. Subpixel precision pre-registration11 between repeated B-scans was performed before OCTA calculations to reduce line artifacts caused by in-plane motion. The split-spectrum amplitude-decorrelation angiography (SSADA) algorithm was used to calculate decorrelation between repeated B-scans for blood flow detection.12 Out-of-plane bulk motion artifact was estimated using median decorrelation in tissue of the B-frame as well as the reflectance of the voxel and then subtracted from OCTA. The orthogonal registration was performed to merge one horizontal and one vertical raster scans into one 3D volume.13 The anterior iris surface and the anterior boundary of the iris pigmented epithelial layer were segmented in cross-sectional OCT images. The en face iris OCT structure image was calculated by averaging reflectance between the two iris boundaries. The en face iris angiogram was constructed by projecting the maximal flow signal between the boundaries. The vessel density was defined as the percentage of area occupied by vessels in en face OCTA.14 Custom algorithm developed with MATLAB R2010a software (The MathWorks, Inc.; Natick, MA, USA) was used to measure vessel density in iris lesions and normal iris tissue areas. Wilcoxon rank-sum tests were used to compare vessel density measurements between normal light colored irides, nevi, and iris melanomas. For iris melanomas treated with radiation therapy, OCTA scans were acquired both before and after the radiation treatment.
Results
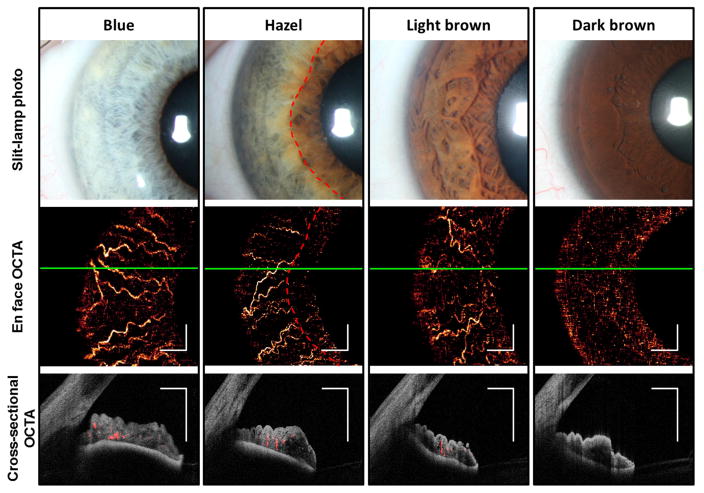
Eight eyes (two blue, two green, two hazel, one light brown, and one dark brown) of eight healthy participants (two male, six female; average age 40.1 ± 10.9 [mean ± standard deviation], range 26 to 62 years) and nine eyes of nine patients (six male, three female; average age 66.4 ±18.0, range 44 to 92 years) with iris lesions were prospectively included in this observational case series. Information regarding the iris color and clinical diagnoses for patients with iris lesions is listed in Table 1. En face OCTA in normal eyes showed blood vessels in the iris stroma with predominantly radial orientation consistent with the previously described fluorescein angiographic (FA) appearance of the iris vasculature (Figure 1). These vessels are slightly accordioned with pupil in mid-dilated state. There was good penetration of flow signal in the iris stroma in OCTA of light to moderately pigmented irides. However, visualization of iris vessels in the dark brown iris and in the most pigmented portion of the hazel iris was impeded by low OCT signal below the anterior iris stroma (Figure 1).
Table 1.
Summary of cases with iris lesions.
| Case | Gender | Age | Eye | Eye color | Iris lesion |
|---|---|---|---|---|---|
| 1 | M | 61 | OS | Green | Freckle |
| 2 | F | 73 | OS | Blue | Nevus |
| 3 | F | 44 | OS | Blue | Freckle, nevus |
| 4 | M | 86 | OS | Blue | Freckle, nevus |
| 5 | M | 80 | OD | Brown | Iris pigment epithelial cyst |
| 6 | M | 45 | OD | Blue | Melanoma |
| 7 | M | 69 | OS | Blue | Melanoma |
| 8 | M | 48 | OD | Blue | Melanoma |
| 9 | F | 92 | OD | Blue | Freckle, Melanoma |
M = male; F = female; OS = left eye; OD = right eye.
Figure 1.
1050 nm optical coherence tomography (OCT) and OCT angiography (OCTA) of normal irides with light to dark pigmentations. En face OCTA of iris shows iris vessels in all except the dark brown iris and in the thicker and more pigmented areas of the hazel iris near the pupillary margin (inside red dashed lines). White scale bars are 1 mm in length. Green solid lines indicate the levels at which the cross-sectional OCTAs were obtained. Cross-sectional OCTAs show vessels (flow signal in red) within the iris stroma (reflectance signal in gray scale). The posterior iris epithelium was visible in all irides. However, both reflectance and flow signals in the stroma was faint in the dark brown iris, presumably due to blocking by the dense pigmentation in the anterior stroma.
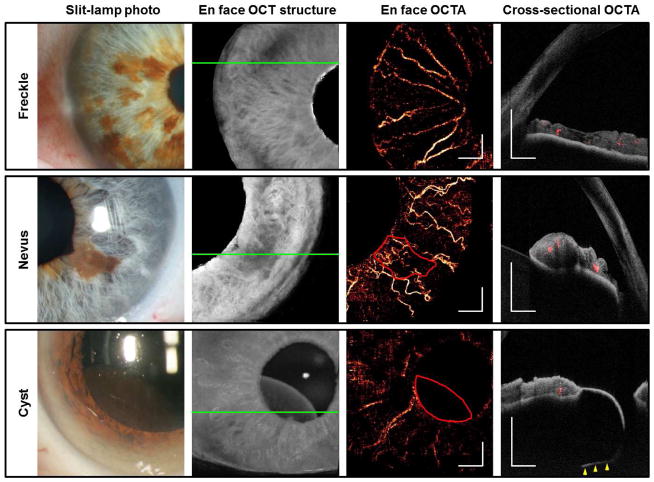
OCTA of a variety of benign iris lesions was performed (Figure 2). OCTA of iris freckles showed no increased vascularity associated with these lesions. Three eyes with iris nevi were evaluated with OCTA. In two eyes with nevi there was no increased vascularity; in another (Figure 2), fine vascular loops were noted near an area of ectropion uveae close to the pupil margin. Iris pigment epithelial (IPE) cysts are thin-walled, avascular cysts located immediately posterior to the iris that can mimic ciliary body melanomas. We imaged a mid-zonal IPE cyst with OCTA and, as expected, demonstrated absence of flow (Figure 2).
Figure 2.
Benign iris lesions imaged by the by the 1050 nm OCT. Green solid lines indicate the locations of the cross-sectional OCTAs. The areas of the nevus and cyst were outlined in red. White scale bars are 1 mm in length. Cross-sectional OCTAs show blood flow signal in red and reflectance of static pixels in gray scale. The posterior boundary of the iris pigment epithelial cyst (yellow arrowheads) was within the OCTA scan volume. The iris thickness was up to 0.50 mm at the freckles and 0.76 mm at the nevus. The cyst thickness was up to 1.43 mm.
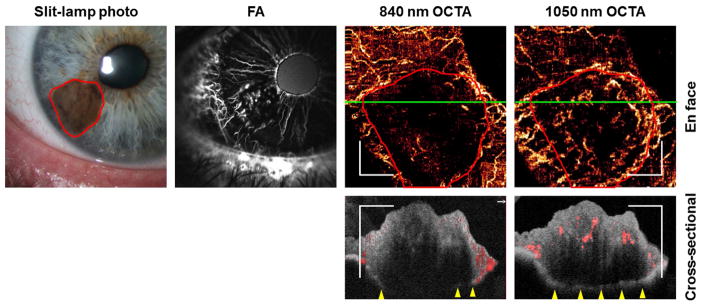
Traditional iris FA from an eye with cytologically-confirmed spindle-cell iris melanoma demonstrated increased vascularity consisting of tight loops within the tumor (Figure 3). The 1050 nm en face OCTA images demonstrated a similar vascular pattern (Figure 3). Vessels in the superficial and mid-stroma were visualized with 1050 nm OCTA. In contrast, the tumor vasculature was masked by the pigmentation in the anterior stroma in the 840 nm OCTA. The 1050 nm OCT was able to visualize the full thickness (1.26 mm) of the pigmented tumor while the 840 nm OCT could not. Due to the better penetration provided by the 1050 nm OCTA, it was used preferentially for imaging iris tumors in this study.
Figure 3.
840 nm and 1050 nm OCTA of an iris melanoma (Case 6) compared with fluorescein angiography (FA). Early phase FA at 33 seconds showed normal radial iris vessels and tightly looped vessels within the tumor. Both 840 nm and 1050 nm OCTA showed the normal iris vessels, but only the 1050 nm was able to show the vascular pattern within the tumor (outlined in red). White scale bars are 1 mm in length. Green lines in the en face OCTAs indicate the locations of the cross-sectional OCTAs. The tumor was 1.26 mm between the anterior stromal border and the posterior iris epithelium at the thickest point. The posterior iris epithelium could be visualized by the 1050 nm OCT, but not the 840 nm OCT, at the thicker portions of the tumor. Flow signal (red) could be seen down to the mid-stroma level in the 1050 nm cross-sectional OCTA, but only minimally at the anterior stromal border in the 840 nm OCTA.
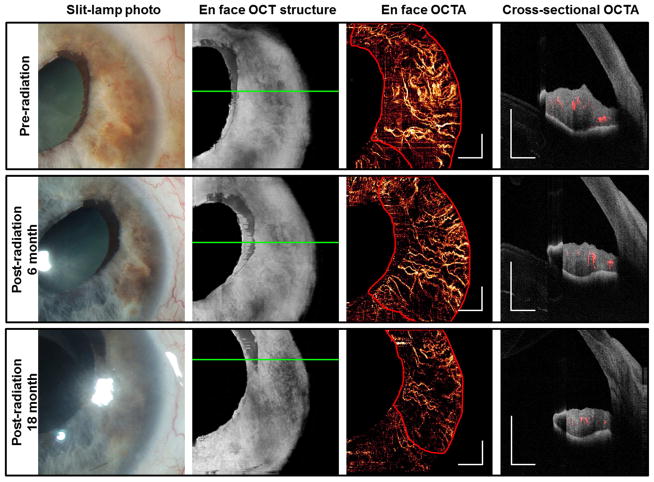
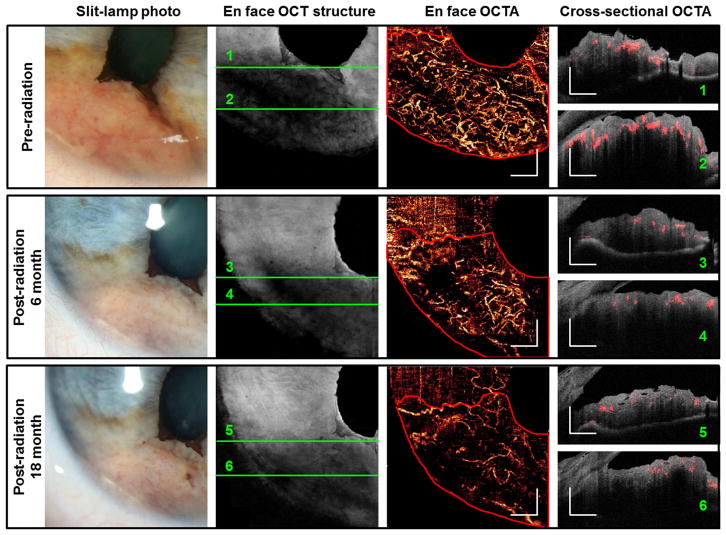
Two additional cases of iris melanoma treated with I-125 plaque brachytherapy were imaged. These tumors were not histologically confirmed to be melanoma, as the patients declined fine needle biopsy. However, the tumors were large, elevated, highly vascular, and had documented growth, consistent with a clinical diagnosis of iris melanoma. Before treatment, OCTAs (Figures 4, 5) showed very dense and disorganized intratumoral vessels. In the case of a moderately pigmented melanoma, cross-sectional OCTA showed that most vessels were located in the mid-stroma (Figure 4). In the case of variably pigmented, but mainly amelanotic melanoma (Figure 5), there was extremely dense anterior stromal vascularization with obvious shadowing below the vessels. Six months after plaque brachytherapy, the iris tumors were re-imaged with OCTA. Repeat scans after treatment demonstrated reduced vascularity of the lesions, although each tumor continued to demonstrate abnormal disorganized vascular patterns as compared with normal regions of the iris. There was further regression 18 month post-radiotherapy, as evidenced by reduced vascularity and thickness on OCTA (Figures 4 and 5). The vessel density within iris lesions and in normal iris tissue was measured from en face OCTA images.
Figure 4.
Changes in 1050 nm OCTA feature of an iris melanoma (case 7) after radiation therapy. The tumor region is outlined in red in the en face OCTAs. White scale bars are 1 mm in length. In the cross-sectional OCTAs, flown signal is shown in red and the reflectance of static pixels is in gray scale. The tumor thickness decreased from 1.01 mm before radiation to 0.77 mm 18 months after treatment, as measured by OCT at the thickest location.
Figure 5.
Changes in 1050 nm OCTA feature of an iris melanoma (case 8) after radiation therapy. The tumor region is outline in red in the en face OCTAs. White scale bars are 1 mm in length. In the cross-sectional OCTAs, flow signal is shown in red and the reflectance of static pixels is in gray scale. 1050 nm OCT did not penetrate the full thickness of the tumor at some locations. Ultrasound biomicroscopy (UBM) measured the tumor thickness to be 2.37 mm.
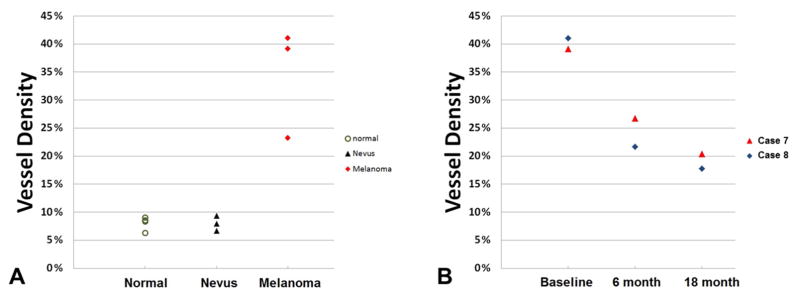
The vessel density was significantly higher within three malignant iris melanomas (34.5% ± 9.8%, range 23.3% to 41.1%) than in three benign iris nevi (8.0% ± 1.4%, range 6.7% to 9.4%; p = 0.034), whose vessel density more closely matched four normal irides (green or blue in color, 8.0% ± 1.2%, range 6.3% to 9.0%). A progressive reduction in tumor vessel density over time was observed in iris melanomas treated with radioactive plaques (Figure 6).
Figure 6.
Iris and lesion vessel density plots. (A) Vessel density measured in normal iris tissue and within iris lesions (nevi and melanomas). (B) Vessel density of two iris melanoma cases (Cases 7 and 8) decreased after I-125 plaque brachytherapy.
Although 1050 nm OCTA provided sufficient penetration to show high vessel density on en face angiograms of most tumors, this was not so in one case of highly pigmented iris melanoma (Figure 7). It was evident that dense pigmentation at the anterior stromal border blocked the visualization of tumor vessels, as the tumor vessels could be seen in the less pigmented portion of the turmor. In this study, 1050 nm OCT visualized the full thickness of moderately pigmented iris lesions with thickness between a range of 0.50 ~ 1.43 mm; but could not fully penetrate a thick iris melanoma and a highly pigmented melanoma (2.37 mm and 1.49 mm thick, respectively, as measured by UBM).
Figure 7.
Poor penetration of highly pigmented iris melanoma with 1050 nm OCTA. On the en face structural OCT, the location of the cross-sectional OCTA is marked by a green line. On the en face OCTA, the tumor is outlined in red. White scale bars are 1 mm in length. In the cross-sectional OCTA, flow is shown in red while the reflectance is shown in gray scale. Most of the tumor vasculature was not visible due to shadowing under the intensely pigmented anterior stromal border, except for a small portion of the tumor that was amelanotic (red arrows). UBM measured the tumor thickness to be 1.49 mm.
Discussion
OCT angiography provides a unique, non-invasive method for evaluating blood flow and vessel density, and is now beginning to be applied to anatomy beyond the retinal vasculature. The imaging of intraocular tumors with OCTA is a developing area, with data from animal models showing promise and one published description of OCTA for choroidal tumors in humans.3,15 Here we demonstrate that OCTA operating at 1050 nm can be used to image melanocytic iris tumors.
Solid tumors undergo initial avascular and subsequent vascular phases of growth. Increased vascularity is a hallmark of malignant transformation.16,17 This occurs through a process of angiogenesis in which neovascularization creates a network of disorganized, highly permeable intratumoral vessels.17,18 Increased intratumoral microvessel density is associated with various measures of increased tumor aggressiveness, and is a morphologic measure of angiogenesis.19 OCTA has the potential to provide a non-invasive method for examining intratumoral microvessel density and has potential applications in imaging a variety of ocular tumors as well as cutaneous, gastrointestinal, and gynecologic tumors.15
Benign iris lesions including freckles, cysts, and nevi do not demonstrate increased intrinsic intratumoral vascularity by OCTA as compared with normal iris tissue. In contrast, iris melanomas are characterized by hypervascularity, with disorganized and tortuous intratumoral vascular patterns and increased vessel density. This is consistent with previous reports of disorganized intratumoral vasculature in iris melanomas imaged with traditional fluorescein angiography.20–23 Moreover, we demonstrated that regression of the lesions after radiation treatment is associated with a demonstrable and quantifiable change in the density of the abnormal intratumoral vessels. Other groups have evaluated changes in retinal vasculature associated with radiation treatment of intraocular tumors,24,25 but changes within the tumor vasculature associated with radiation have not previously been described. Quantitative changes in vessel density as measured by OCTA may provide useful information regarding tumor regression after radiotherapy.
Eyes with iris melanocytic tumors are often asymptomatic with good vision. As there can be considerable morbidity associated with excisional biopsy or radiation therapy for the treatment of iris melanoma, and observation of lesions is associated with a risk for metastatic disease, developing a non-invasive method to assist in predicting tumor behavior is desirable. Previously, fluorescein angiography has been proposed as a method for differentiation of malignant lesions from benign tumors; however, this testing is costly, time-intensive and carries risk associated with dye injections. Due to these considerations many clinicians do not perform iris fluorescein angiography routinely for clinical care. OCTA may provide a simple, cost-effective, and safe alternative that could be used to monitor iris tumors and help identify those lesions at highest risk for malignancy and metastatic spread. Adding OCTA to a “watchful waiting” protocol employed for tumors which are not yet demonstrating other high-risk features for metastasis, may allow clinicians to more easily detect concerning changes in intratumoral vascularity, so that treatment discussions could be initiated. This technique could also allow clinicians to avoid un-necessary excisional biopsy or radiation treatment. Further study is necessary to determine the clinical utility of this approach.
There are several limitations of current OCTA technology for imaging the iris. First of all, good patient cooperation is required, as the scan acquisition takes approximately 3 seconds. Secondly, OCTA image size was limited and not large enough to capture the entire iris in one scan. We investigated both 6×6 mm and 9×9 mm scan sizes containing the same axial scan numbers. The 6×6 mm scan size was preferable as it provides better vasculature detail. One important limitation of OCTA in imaging iris tumors is inadequate penetration through highly pigmented lesions and thicker tumors. Although it could not fully image all iris lesions, the 1050 nm OCT system was superior to an 840 nm system in the penetration of iris tumors. The en face vascular pattern and the posterior iris pigment epithelium could both be visualized in most iris tumors evaluated with the 1050 nm system, enabling vessel density and volume measurements. Full OCT and OCTA penetration of the tumors appears to depend upon tumor thickness as well as the degree of pigmentation and vessel density within the tumor, due to shadowing. It is possible that longer wavelength systems working at 1310 nm wavelength may be able to overcome these deficiencies, allowing for successful OCTA imaging of intratumoral vasculature in tumors not well imaged with the 1050 nm system.
In conclusion, this is the first demonstration of OCTA in iris tumors. OCTA working at 1050 nm wavelength can successfully image vasculature within moderately pigmented and non-pigmented iris melanocytic tumors. This technique may serve as a less invasive alternative to conventional FA for assessing tumor vascularity and monitoring response to treatment and has the advantage of providing quantitative measurement of vessel density within tumors.
Acknowledgments
Supported by National Institute of Health grants R01 EY023285, R01 EY024544, R01 EY018184, DP3 DK104397, UL1TR000128, and P30 EY010572; a Lloyd Research Endowment Faculty Grant; and by an unrestricted departmental grant from Research to Prevent Blindness (New York, NY).
Footnotes
Financial Disclosures: Oregon Health & Science University (OHSU), Y.L., Y.J., and D.H. have a significant financial interest in Optovue, Inc, a company that may have a commercial interest in the results of this research and technology. These potential conflicts of interest have been reviewed and managed by OHSU. J.G.F. receives royalties from intellectual property owned by MIT and licensed to Optovue, Inc. and Carl Zeiss Meditec, Inc. The other authors have no proprietary or commercial interest in the materials discussed in this article.
Publisher's Disclaimer: This is a PDF file of an unedited manuscript that has been accepted for publication. As a service to our customers we are providing this early version of the manuscript. The manuscript will undergo copyediting, typesetting, and review of the resulting proof before it is published in its final citable form. Please note that during the production process errors may be discovered which could affect the content, and all legal disclaimers that apply to the journal pertain.
References
- 1.Jia Y, Bailey ST, Wilson DJ, et al. Quantitative optical coherence tomography angiography of choroidal neovascularization in age-related macular degeneration. Ophthalmology. 2014;121:1435–1444. doi: 10.1016/j.ophtha.2014.01.034. [DOI] [PMC free article] [PubMed] [Google Scholar]
- 2.Jia Y, Bailey ST, Hwang TS, et al. Quantitative optical coherence tomography angiography of vascular abnormalities in the living human eye. Proc Natl Acad Sci U S A. 2015;112:E2395–2402. doi: 10.1073/pnas.1500185112. [DOI] [PMC free article] [PubMed] [Google Scholar]
- 3.Cennamo G. OCT angiography examination of choroidal nevi and melanomas. In: Lumbroso B, Huang D, Jia Y, et al., editors. Clinical OCT Angiography Atlas. New Delhi, India: Jaypee Brothers Medical Publishers, Ltd; 2015. pp. 150–155. [Google Scholar]
- 4.Ang M, Cai Y, Shahipasand S, et al. En face optical coherence tomography angiography for corneal neovascularisation. Br J Ophthalmol. 2016;100:616–621. doi: 10.1136/bjophthalmol-2015-307338. [DOI] [PubMed] [Google Scholar]
- 5.Jacques SL. Time-resolved reflectance spectroscopy in turbid tissues. IEEE Trans Biomed Eng. 1989;36:1155–1161. doi: 10.1109/10.42109. [DOI] [PubMed] [Google Scholar]
- 6.Hulst HCvd. Light scattering by small particles. New York, NY: Dover Publications; 1981. [Google Scholar]
- 7.Shields CL, Shields JA, Materin M, Gershenbaum E, Singh AD, Smith A. Iris melanoma: risk factors for metastasis in 169 consecutive patients. Ophthalmology. 2001;108:172–178. doi: 10.1016/s0161-6420(00)00449-8. [DOI] [PubMed] [Google Scholar]
- 8.Shields CL, Kaliki S, Shah SU, Luo W, Furuta M, Shields JA. Iris melanoma: features and prognosis in 317 children and adults. J AAPOS. 2012;16:10–16. doi: 10.1016/j.jaapos.2011.10.012. [DOI] [PubMed] [Google Scholar]
- 9.Geisse LJ, Robertson DM. Iris melanomas. Am J Ophthalmol. 1985;99:638–648. doi: 10.1016/s0002-9394(14)76028-3. [DOI] [PubMed] [Google Scholar]
- 10.Singh AD, Shields JA, Eagle RC, Shields CL, Marmor M, De Potter P. Iris melanoma in a ten-year-old boy with familial atypical mole-melanoma (FAM-M) syndrome. Ophthalmic Genet. 1994;15:145–149. doi: 10.3109/13816819409057842. [DOI] [PubMed] [Google Scholar]
- 11.Guizar-Sicairos M, Thurman ST, Fienup JR. Efficient subpixel image registration algorithms. Opt Lett. 2008;33:156–158. doi: 10.1364/ol.33.000156. [DOI] [PubMed] [Google Scholar]
- 12.Jia Y, Tan O, Tokayer J, et al. Split-spectrum amplitude-decorrelation angiography with optical coherence tomography. Opt Express. 2012;20:4710–4725. doi: 10.1364/OE.20.004710. [DOI] [PMC free article] [PubMed] [Google Scholar]
- 13.Kraus MF, Potsaid B, Mayer MA, et al. Motion correction in optical coherence tomography volumes on a per A-scan basis using orthogonal scan patterns. Biomed Opt Express. 2012;3:1182–1199. doi: 10.1364/BOE.3.001182. [DOI] [PMC free article] [PubMed] [Google Scholar]
- 14.Jia Y, Wei E, Wang X, et al. Optical coherence tomography angiography of optic disc perfusion in glaucoma. Ophthalmology. 2014;121:1322–1332. doi: 10.1016/j.ophtha.2014.01.021. [DOI] [PMC free article] [PubMed] [Google Scholar]
- 15.Vakoc BJ, Fukumura D, Jain RK, Bouma BE. Cancer imaging by optical coherence tomography: preclinical progress and clinical potential. Nat Rev Cancer. 2012;12:363–368. doi: 10.1038/nrc3235. [DOI] [PMC free article] [PubMed] [Google Scholar]
- 16.Folkman J. Tumor angiogenesis: therapeutic implications. N Engl J Med. 1971;285:1182–1186. doi: 10.1056/NEJM197111182852108. [DOI] [PubMed] [Google Scholar]
- 17.Ribatti D. Judah Folkman, a pioneer in the study of angiogenesis. Angiogenesis. 2008;11:3–10. doi: 10.1007/s10456-008-9092-6. [DOI] [PMC free article] [PubMed] [Google Scholar]
- 18.Nishida N, Yano H, Nishida T, Kamura T, Kojiro M. Angiogenesis in cancer. Vasc Health Risk Manag. 2006;2:213–219. doi: 10.2147/vhrm.2006.2.3.213. [DOI] [PMC free article] [PubMed] [Google Scholar]
- 19.Weidner N. Intratumor microvessel density as a prognostic factor in cancer. Am J Pathol Jul. 1995;147:9–19. [PMC free article] [PubMed] [Google Scholar]
- 20.Dart JK, Marsh RJ, Garner A, Cooling RJ. Fluorescein angiography of anterior uveal melanocytic tumours. Br J Ophthalmol. 1988;72:326–337. doi: 10.1136/bjo.72.5.326. [DOI] [PMC free article] [PubMed] [Google Scholar]
- 21.Jakobiec FA, Depot MJ, Henkind P, Spencer WH. Fluorescein angiographic patterns of iris melanocytic tumors. Arch Ophthalmol. 1982;100:1288–1299. doi: 10.1001/archopht.1982.01030040266014. [DOI] [PubMed] [Google Scholar]
- 22.Hodes BL, Gildenhar M, Choromokos E. Fluorescein angiography in pigmented iris tumors. Arch Ophthalmol. 1979;97:1086–1088. doi: 10.1001/archopht.1979.01020010540005. [DOI] [PubMed] [Google Scholar]
- 23.Demeler U, Diekstall F, Kroncke W. Iris angiography of the anterior segment. Journal of Ophthalmic Photography. 1986;9:116–122. [Google Scholar]
- 24.Veverka KK, AbouChehade JE, Iezzi R, Jr, Pulido JS. Noninvasive grading of radiation retinopathy: The use of optical coherence tomography angiography. Retina. 2015;35:2400–2410. doi: 10.1097/IAE.0000000000000844. [DOI] [PubMed] [Google Scholar]
- 25.Shields CL, Say EA, Samara WA, Khoo CT, Mashayekhi A, Shields JA. Optical coherence tomography angiography of the macula after plaque radiotherapy of choroidal melanoma: Comparison of irradiated versus nonirradiated eyes in 65 patients. Retina. 2016;36:1493–1505. doi: 10.1097/IAE.0000000000001021. [DOI] [PubMed] [Google Scholar]


