Abstract
BACKGROUND
Offspring with a family history of alcohol dependence (AD) have been shown to have altered structural and functional integrity of corticolimbic brain structures. Similarly, prenatal exposure to alcohol is associated with a variety of structural and functional brain changes. The goal of this study was to differentiate the brain gray matter volumetric differences associated with familial risk and prenatal exposure to alcohol among offspring while controlling for lifetime personal exposures to alcohol and drugs.
METHODS
A total of 52 high-risk (HR) offspring from maternal multiplex families with a high proportion of alcohol dependence were studied along with 55 low-risk (LR) offspring. Voxel based morphometric (VBM) analysis was performed using statistical parametric mapping (SPM8) software using 3T structural images from these offspring to identify gray matter volume differences associated with familial risk and prenatal exposure.
RESULTS
Significant familial risk group differences were seen with HR males showing reduced volume of the left inferior temporal, left fusiform and left and right insula regions relative to LR males, controlling for prenatal exposure to alcohol drugs and cigarettes. High-risk females showed a reduction in the right fusiform but also showed a reduction in volume in portions of the cerebellum (left crus I and left lobe 8). Prenatal alcohol exposure effects, assessed within the familial high-risk group, was associated with reduced right middle cingulum and left middle temporal volume. Even low exposure resulting from mothers drinking in amounts less than the median of those who drank (53 drinks or less over the course of the pregnancy) showed a reduction of volume in the right anterior cingulum and in the left cerebellum (lobes 4 and 5).
CONCLUSIONS
Familial risk for alcohol dependence and prenatal exposure to alcohol and other drugs show independent effects on brain morphology.
Keywords: Familial Alcoholism Risk, Prenatal Alcohol Exposure, Voxel Based Morphometry
Introduction
Alcoholism and alcohol related problems impose a considerable economic and public health burden in the US, primarily in the form of loss of productivity, healthcare costs, motor vehicle accidents, and criminal justice expenses (Sacks et al., 2015). Offspring with a family history of alcohol dependence (AD) have been shown to be more prone to alcohol related problems and to have altered structural and functional integrity of brain structures (Cservenka, 2016). Similarly, prenatal exposure to alcohol is associated with alteration in multiple brain regions (Moore et al., 2014).
Studies looking at the effect of familial risk on brain morphology and functioning in offspring from alcohol dependent parents often have difficulty separating the effects of familial risk from prenatal exposure because mothers who drink during pregnancy often come from families with AD and substance abuse (Wendell, 2013; O'Brien and Hill, 2015). Complicating the inquiry is the fact that those studies that have assessed prenatal exposure on brain morphology often have minimal or no information about familial risk. Additionally, the history of personal use of alcohol, drugs and cigarettes needs to be taken into account to accurately assess the effects of prenatal exposures and familial risk effects. Uncovering the specific brain structures altered by familial risk, prenatal alcohol exposure, and personal exposure to alcohol and other drugs may provide clues for targeted interventions.
Brain Structural Alterations Associated with Familial Risk
Several studies using both whole brain and region of interest approaches have explored the effects of familial risk on various brain structures in offspring from high and low-risk families. Deviation of regional brain volume, whether decreases or increases, can be expected to alter brain functioning. The formation of appropriate synaptic connections in the developing brain occurs through a series of progressive events including cell migration, neuronal growth and synaptogenesis but also through regressive events that may lead to reduced volume; all of which are essential for normal brain function (Riccomagno and Kolodkin, 2015). Removal of excessive neuronal connections through axonal pruning appears to be as important as events associated with neuronal growth because disruption of pruning has been linked to some psychiatric disorders (Tang et al., 2014; Glausier and Lewis, 2013). Reduced pruning has been suggested as an explanation for greater total cerebellar volume as well as regional differences that are seen in adolescent and young adult offspring from high-risk (HR) families with multiple cases of AD when contrasted with low-risk (LR) controls (Hill et al., 2011; 2015).
Reduction in volume possibly due to over pruning or diminished neuroproliferation developmentally is also seen in association with high-risk familial background for other structures. High-risk offspring with externalizing disorders show significantly smaller total caudate volume (Hill et al., 2013a). Also, reduction of volume of the amygdala in the right hemisphere is seen in high-risk offspring with minimal personal exposure to alcohol and drugs (Hill et al., 2001), a finding now confirmed in an expanded sample of high-risk offspring from multiplex families who were compared with low-risk controls (Hill et al., 2013b), and in family history positive (high-risk) offspring in comparison to controls from a population-based family study of AD (Dager et al., 2015).
Familial risk for AD has also been shown to be associated with a reduction in right/left ratios of orbitofrontal volume (Hill et al., 2009), and reduction in volume of the hippocampus and the parahippocampal gyrus (Benegal et al., 2007; Sjoerds et al., 2013). The nucleus accumbens has also been reported to be influenced by the family density of alcoholism with positive associations seen in drug and alcohol naive female adolescent offspring from families with AD (Cservenka et al., 2015).
Functional MRI studies have also reported differences between family history positive youth compared with controls in some of the same regions in which structural differences have been observed (Cservenka et al., 2012, 2014; Schweinsburg et al., 2004; Silveri et al., 2011).
Brain Structural Alterations Associated with Prenatal Alcohol Exposure
Prenatal alcohol exposure has widespread effects on the brain of exposed offspring. Many studies have reported an association between exposure and a reduction in total brain volume along with specific regions including caudate, cerebellum and corpus callosum (Archibald et al., 2001; Nardelli et al., 2011; Rajaprakash et al., 2014; Donald et al., 2015). Reduced frontal lobe volume and reduced total brain gray matter volume are commonly reported among individuals with prenatal exposures to alcohol (Astley et al., 2009; Sowell et al., 2002a,b).
Regional decreases in temporal lobe gray matter (Li et al., 2008; Sowell et al., 2002a) including the fusiform gyrus of the temporal lobe have been reported (Coles et al., 2011). In both adolescents and adults with fetal alcohol syndrome, the hippocampus has been shown to be relatively smaller than normal, even after correcting for total brain volume (Nardelli et al., 2011). Similarly, amygdala volume has also been reported to be altered in association with prenatal alcohol exposure (Nardelli et al., 2011), though no differences were seen in other reports (Archibald et al., 2001; Riikonen et al., 2005).
Rationale for Current Study
Because of the importance of distinguishing the effects of prenatal exposure to alcohol from those transmitted across generations as familial genetic effects, the first goal of this study was to compare the gray matter volumetric differences in whole brain of the HR and LR offspring using voxel based morphometric (VBM) analysis while controlling for various personal and prenatal exposures to alcohol, drugs, and cigarettes. Additionally, an important goal was to determine whether prenatal effects could be found controlling for familial risk effects. To achieve this goal, a comparison of volumetric differences of prenatally exposed (alcohol only) and unexposed offspring was performed using VBM analysis while controlling for personal exposures (alcohol and cigarettes) and prenatal exposures (drugs and cigarettes). To verify and extend our analyses of relevant covariation, SPSS (Statistical Package for the Social Sciences Version 20) analyses were run to control for inclusion of multiple siblings from the same family using a family identifier variable. These analyses were directed at regions of interest (ROIs) found to be significant in the whole brain VBM analyses.
Methods
Participants
The present report is based on structural MRI (sMRI) scans of 107 third generation offspring who are part of an ongoing family study that selected families through their parents’ generation. A total of 52 high-risk (HR) offspring from maternal multiplex families with a high proportion of AD were studied along with 55 low-risk (LR) offspring. All participants in the MRI assessments were part of a larger longitudinal follow-up in which children, adolescents and young adults from high and low-familial risk for AD families were assessed clinically using age appropriate structured instruments. The offspring were followed through childhood at approximately annual intervals and through young adulthood, biennially. These follow-up visits provided extensive assessment of alcohol and drug use information obtained at each follow-up wave. All participants provided consent with each visit. Children provided assent with parental consent. The study has ongoing approval from the University of Pittsburgh Institutional Review Board.
High-Risk Families
High-risk (HR) families were identified through a proband pair of alcohol dependent sisters. One member of the proband pair was in a substance abuse treatment facility in the Pittsburgh area at the time of recruitment. The study design provided an ultra-high density of alcoholism in the pedigrees from which these offspring were selected. In person structured interviews (Diagnostic Interview Schedule [DIS]) (Robins et al., 1981) of the proband sisters, their spouses, and all available first degree relatives were conducted to determine the presence of axis I psychopathology and AD. Families were excluded if there was presence of bipolar disorder, schizophrenia, recurrent major depression, and drug dependence (i.e. drug dependence preceded AD by 1 or more years) among proband sisters and their first degree relatives.
Low-Risk Control Families
Each control family was initially recruited by place of residence and whether children between the ages of 8–18 lived within the home. Each control family was selected for their residence within a census track from which a high-risk family had been selected. This provided a yoked control for neighborhood characteristics. Families qualifying by these characteristics were further screened to determine the psychopathology within the family. Mothers were designated as the "index" case and screened for absence of alcohol and drug dependence using the DIS, though other psychopathology was free to vary with the exception of schizophrenia and bipolar disorder. Diagnostic data were also collected for all first degree relatives using either an in-person DIS interview or by obtaining multiple family history reports to ensure an absence of a family history of AD. Accordingly, all control families had a low density of familial AD.
Assessment of Personal Exposure
All participants were part of a longitudinal study that allowed determination of quantitative estimates of cigarette and alcohol use. Exposure to cigarettes and alcohol up to the time of the scan was calculated based on the longitudinally acquired data. Because alcohol and cigarettes were the most commonly used substances, values for lifetime use of alcohol and cigarettes and whether the individual met criteria for a substance use disorder before the scan were used as covariates in both VBM and SPSS analyses.
Assessment of Prenatal Use of Substances
Mothers of the offspring included in the present report were administered a structured interview concerning their drinking, smoking, and drug usage during pregnancy. The interview was performed on the occasion of the first follow-up visit to the laboratory when children were on average 12.1 ± 3.3 years of age. The interview was designed in our laboratory with the goal of measuring quantity and frequency of drugs, alcohol, and cigarettes during each trimester of pregnancy. Mothers with multiple children were queried concerning each child separately. Three prenatal measures were derived from the interview of the mother: prenatal alcohol exposure (quantified as number of drinks during pregnancy), prenatal cigarettes exposure (number of cigarettes smoked during pregnancy), and number of drug days (representing number of days during pregnancy that the mother reported using drugs).
Imaging Parameters
The MRI scans were performed at the University of Pittsburgh Medical Center (UPMC) Magnetic Resonance Research Center (MRRC) using a 3T Siemens Trio scanner (Siemens Medical Systems, Ehrlangen, Germany) equipped with a fast gradient system for echoplanar imaging. A standard radio frequency head coil was used with foam padding to restrict head motion. A 7-min 3D T1-weighted Magnetization Prepared Rapid Gradient Echo Imaging (MPRAGE) sequence (TR=2300ms, TE=2.98 ms, FA=9°, field of view FOV=240mm, acquisition matrix = 240 × 256, in-plane resolution 1.0×1.0 mm2, yielding 160 transversal slices with a thickness of 1.2mm) was used to acquire a high-resolution anatomical scan for VBM analysis.
Preprocessing
Structural data preprocessing and analysis for this study was performed with the VBM8 toolbox (http://dbm.neuro.uni-jena.de/vbm/) within the Statistical Parametric Mapping software SPM8 (Wellcome Department of Imaging Neuroscience, Institute of Neurology and the National Hospital for Neurology and Neurosurgery; London, England; http://www.fil.ion.ucl.ac.uk/spm/) running on MATLAB R2014a (Mathworks).
The VBM8 toolbox was used for structural data preprocessing and to check the quality of the data. Preprocessing was done using the “estimate and run” module that performs bias correction, tissue segmentation, affine registration, normalization, and modulation. VBM8 uses a maximum posteriori method for segment tissue types. Segmented images were normalized to Montreal Neurological Institute (MNI) space using nonlinear DARTEL normalization. These quality controlled modulated images were then smoothed using a 12mm full-width at half-maximum (FWHM) isotropic Gaussian kernel.
The resulting SPM contrasts maps were thresholded with p<0.005 with a cluster size of 200 voxels. The significance of these thresholded clusters was determined using a family wise error (FWE) correction threshold which was set at p=0.05. Additionally, regional volumes were calculated using the MarsBaR ROI toolbox (http://marsbar.sourceforge.net) to compare the gray matter (GM) volume of the specified regions of interest (ROIs) which were further compared in SPSS (version 20). ROIs were calculated for each participant and entered into SPSS analyses along with multiple covariates to follow up on areas revealed in the whole brain analyses.
VBM Whole Brain Statistical Analysis
Structural MRI data from 19 subjects did not pass our data quality standards and were excluded from further analysis. Reasons for exclusion included not passing the manual quality inspection due to structural abnormalities (N=4), poor quality of skull stripping (N=5), and poor gray matter image quality associated with extreme covariance parameters (N=10). The remaining 88 scans, 43 HR offspring (Mean age 27.4 ± 3.6 years) and 45 LR offspring (Mean age 24.5 ± 4.1 years) were available for the VBM analysis. Cumulative estimates of personal exposure to alcohol, drugs, and cigarettes along with diagnoses concerning alcohol abuse, alcohol dependence, drug abuse and drug dependence up to the time of the MRI scan were available for all 88 subjects who had participated in the longitudinal follow-up. Substance use disorder was defined as presence of either alcohol abuse or dependence, or drug abuse or dependence. The mothers’ use of alcohol, drugs, and cigarettes was not available for some participants (alcohol and drug exposure [N=8], cigarette use [N=5]). A total of 75 subjects (HR=36, LR=39) had complete prenatal use data for VBM analysis. Personal use of substances up to the time of the scan was considered by coding each subject for presence or absence of a substance use disorder (SUD).
For the purpose of stratifying the level of prenatal exposure for the SPM analyses, the median number of drinks for those who reported any drinking during pregnancy was first determined. Those mothers who reported no drinking or drinking less than the median for the sample were classified as no or low exposure mothers and those with drinking above the median as high exposure. Accordingly, offspring who had prenatal exposure equal to or greater than 54 drinks during the pregnancy were categorized as prenatally exposed and those with mothers reporting less than 53 drinks were considered to be prenatally low or unexposed. To provide a more refined estimate of prenatal effects on offspring, comparisons were made between those grouped by whether the mother did not drink during pregnancy (nonexposed) versus those who drank less than the median (low-exposure), and again using the nonexposed versus those with mothers having greater than the median use (high-exposure).
SPSS Region of Interest Statistical Analysis
An SPSS mixed model analysis was performed on the clusters of brain structures showing significant (FWE corrected) differences in our whole brain VBM analysis. The volumes of these brain structures were extracted using MarsBaR and used in SPSS based mixed model analysis to provide statistical control for participants from families with multiple siblings using a family ID variable. Using the same covariates used in the VBM analysis, we investigated the effect of familial risk and the effect of prenatal alcohol exposure on gray matter volume. HR subjects were compared to LR subjects, and within the HR group, those with prenatal alcohol exposure were compared with HR subjects who had no or low prenatal alcohol exposure. The cumulative estimates of personal use of alcohol, drugs and cigarettes available from longitudinal data collection were used as quantitative variables in the SPSS analyses.
Results
Comparison of High and Low-Risk Participants
Demographic Characteristics
A total of 43 HR participants (12 male and 31 female) with an average age of 27.37 ± 3.55 years were compared with 45 LR participants (27 male and 18 female) with an average age of 24.49 ± 4.11 years.
Prenatal Alcohol and Other Exposure Differences by Risk Group
Offspring from high-risk families had an overall higher level of exposure to alcohol than did low-risk controls. Risk group differences were also seen for use of cigarettes and for number of days during pregnancy in which drugs were used (Table 1). Drug assessment included questions concerning specific use of opioids, cocaine, hallucinogens, and cannabis. The predominant drug use reported was for cannabis. Additionally, differences in alcohol use were seen in the risk by time interaction across trimesters due to larger differences in exposure in the first trimester (F= 4.11, df=2,77, p=0.020).
Table 1.
Demographic Characteristics of Male and Female in High and Low-Risk Groups (Mean ± Standard Deviation).
| LR Males (27) |
HR Males (12) |
t | p-value | LR Females (18) |
HR Females (31) |
t | p-value | |
|---|---|---|---|---|---|---|---|---|
| Age | 23.89 (3.99) |
27.92 (3.502) |
3.01 | 0.005* | 25.39 (4.23) |
27.16 (3.61) |
1.56 | 0.126 |
| SES | 48.67 (8.80) |
46.25 (11.76) |
−0.69 | 0.50 | 47.58 (11.09) |
37.64 (15.23) |
−0.69 | 0.50 |
| SUD | 3/27 11.11% |
5/12 41.67% |
4.76a | 0.029* | 3/18 16.66% |
14/31 45.16% |
4.08a | 0.043* |
| ICV | 1494.67 (92.51) |
1465.47 (95.05) |
−0.42 | 0.68 | 1304.80 (101.15) |
1291.55 (109.35) |
−0.42 | 0.68 |
| Prenatal Alcohol Use |
3.63 (8.71) |
202.75 (311.63) |
2.21b | 0.049* | 1.00 (3.14) |
102.83 (226.64) |
2.42 | 0.022* |
| Prenatal Drug Days |
0 | 21.30 (57.17) |
1.49b | 0.17 | 0 | 38.67 (90.43) |
2.34 | 0.027* |
| Prenatal Cigarette Use |
236.25 (991.53) |
729 (1194.32) |
1.15b | 0.27 | 0 | 2959.62 (3974.32) |
−3.80 | 0.001* |
Chi-Square statistics was performed
Variance was not equal in two groups
Significant at level of p=0.05
Whole Brain VBM
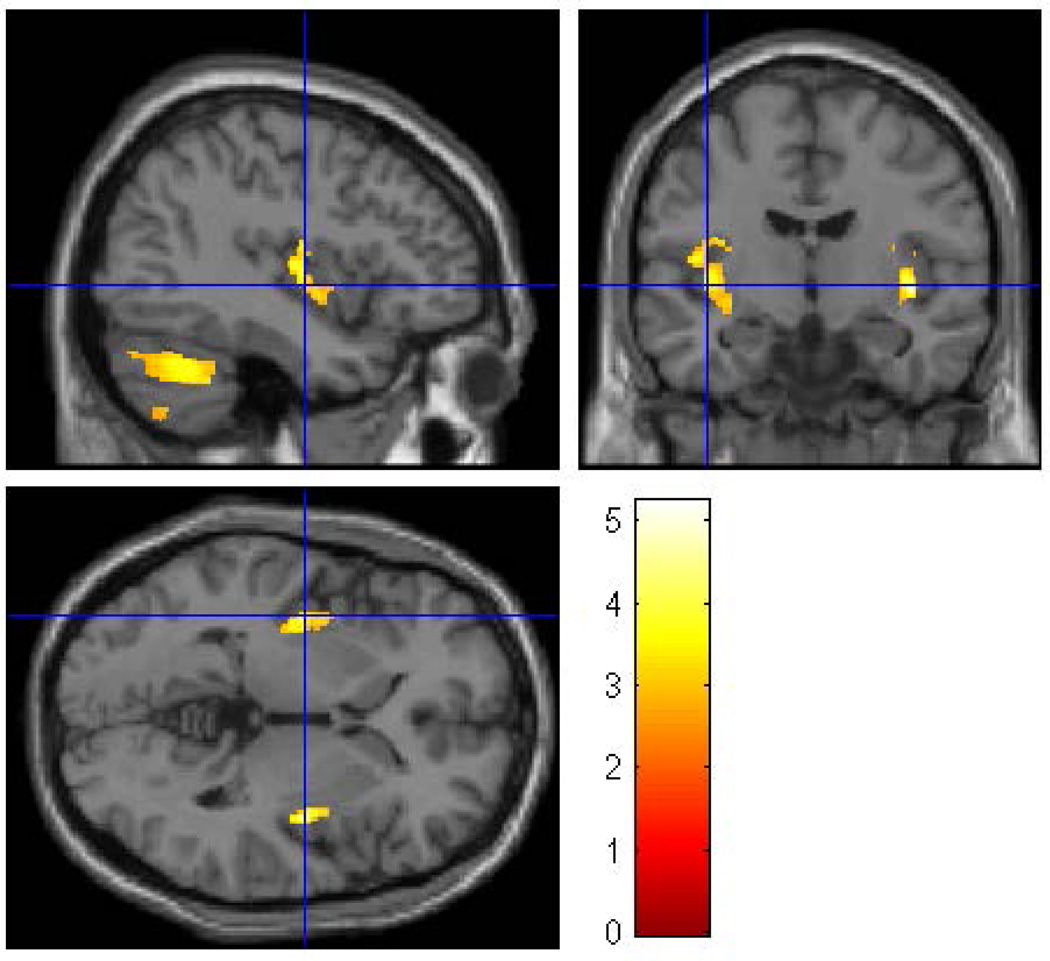
In the first whole brain VBM analysis of the 88 subjects, complete covariate information was available for 75 subjects (36 HR and 39 LR) that included gender, intracranial volume (ICV), and personal history of SUD and prenatal exposure to alcohol, cigarettes, and drugs. Data were thresholded at p<0.005 and 200 voxels. This analysis revealed gray matter volume differences in the left fusiform, left insula, right lingual area and in cerebellum, lobes 8 and 9 (left) that survived FWE correction (Figure 1). These results were supported by analyses using SPSS (Table 2).
Figure 1.
A whole brain SPM8 analysis was performed to evaluate the effects of familial/genetic risk using all participants. Using gender, ICV, SUD, and prenatal exposure to alcohol, cigarettes, and drugs as covariates revealed five clusters of voxels in which Low-Risk offspring had larger gray matter volume than High-Risk offspring. The clusters were thresholded at p<0.005 and 200 voxels with family wise error correction (pFWE<0.05). Five clusters survived the thresholding criterion: left fusiform, left insula, right lingual gyrus, left cerebellum lobe 8 and left cerebellum lobe 9.
Table 2.
Low Risk > High Risk with ICV, personal history of substance use disorder (SUD), and prenatal exposure as covariates.
| Region |
MNI coordinates (mm) |
SPM Analysis | Mixed Model Analysis (SPSS) |
|||||
|---|---|---|---|---|---|---|---|---|
| X | Y | Z | puncorr | Peak T |
Cluster Extent |
pcorr (FWE) |
p Value | |
| Left fusiform | −23 | −52 | −14 | <0.0001 | 5.09 | 3501 | <0.0001 | 0.006 |
| Left insula | −38 | −12 | 3 | <0.0001 | 4.48 | 820 | 0.001 | 0.063 |
| Right lingual | 24 | −43 | −8 | <0.0001 | 4.86 | 497 | 0.021 | ns |
| Left cerebellum lobe 8 |
−24 | −78 | −56 | <0.0001 | 4.39 | 1106 | <0.0001 | 0.019 |
| Left cerebellum lobe 9 |
−8 | −48 | −51 | <0.0001 | 5.24 | 610 | 0.006 | 0.002 |
A total of 88 subjects were available for analysis; 75 subjects had complete information for all covariates.
Gender Specific Whole Brain Analyses
Because of the unequal distribution of males and females by risk group (Table 1), whole brain analyses were performed within each gender to determine if gray matter volumes were different by risk group.
Male Offspring Familial Risk VBM Results
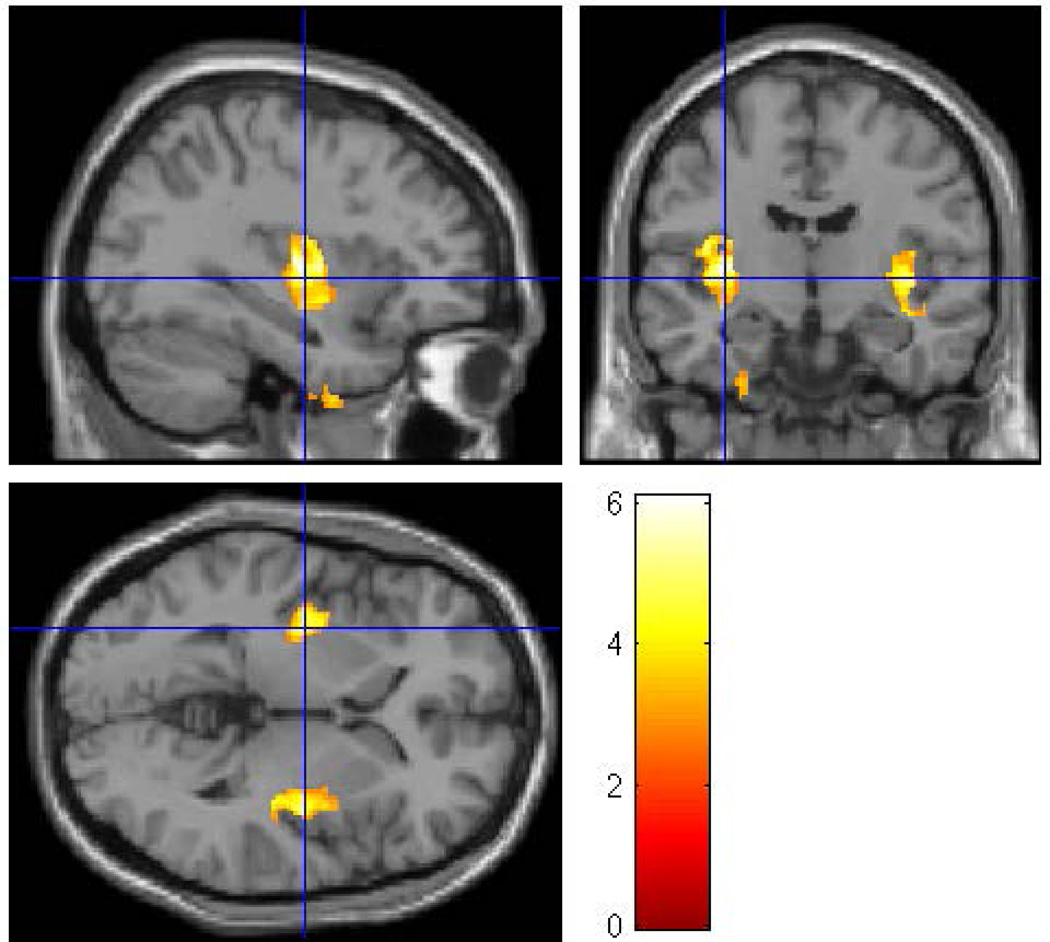
In the first of the gender separated analyses, 39 male participants (12 HR and 27 LR) were compared. The groups did not differ with respect to socioeconomic status (SES), or ICV, or prenatal drug or cigarette exposure (Table 1). Significant differences were found between the HR and LR males (controlling for prenatal exposure, ICV, and personal history of SUD) for the left inferior temporal (p=0.025), and the left fusiform (p=0.026) regions, along with left insula (p< 0.0001) and right insula (p<0.0001 (Figure 2 and Table 3).
Figure 2.
A whole brain SPM8 analysis was conducted for male participants only to assess the effect of familial/genetic risk using ICV, SUD, and prenatal exposure to alcohol, cigarettes, and drugs as covariates. The analysis found four clusters of voxels (left inferior temporal, left fusiform, left insula, and right insula) in which Low-Risk male offspring had larger gray matter volume than did the High-Risk male offspring. The clusters were thresholded at p<0.005 and 200 voxels with family wise error correction applied (pFWE<0.05).
Table 3.
Low Risk Males > High Risk Males with ICV, personal history of substance use disorder (SUD), and prenatal exposure as covariates (39 Subjects; 12 HR and 27 LR).
| Region |
MNI coordinates mm) |
SPM Analysis | Mixed Model Analysis (SPSS) |
|||||
|---|---|---|---|---|---|---|---|---|
| X | Y | Z |
puncorr |
Peak T |
Cluster Extent |
pcorrected (FWE) |
p value | |
| Left inferior temporal |
−65 | −30 | −21 | <0.0001 | 4.28 | 441 | 0.025 | 0.001 |
| Left fusiform | −29 | 2 | −45 | <0.0001 | 4.27 | 440 | 0.026 | 0.004 |
| Left insula | −33 | −12 | 6 | <0.0001 | 6.09 | 1382 | <0.0001 | 0.049 |
| Right insula | 39 | 0 | 7 | <0.0001 | 5.27 | 1626 | <0.0001 | 0.025 |
There were 39 male subjects available for analysis; 34 subjects had complete information for all covariates.
Female Offspring Familial Risk VBM Results
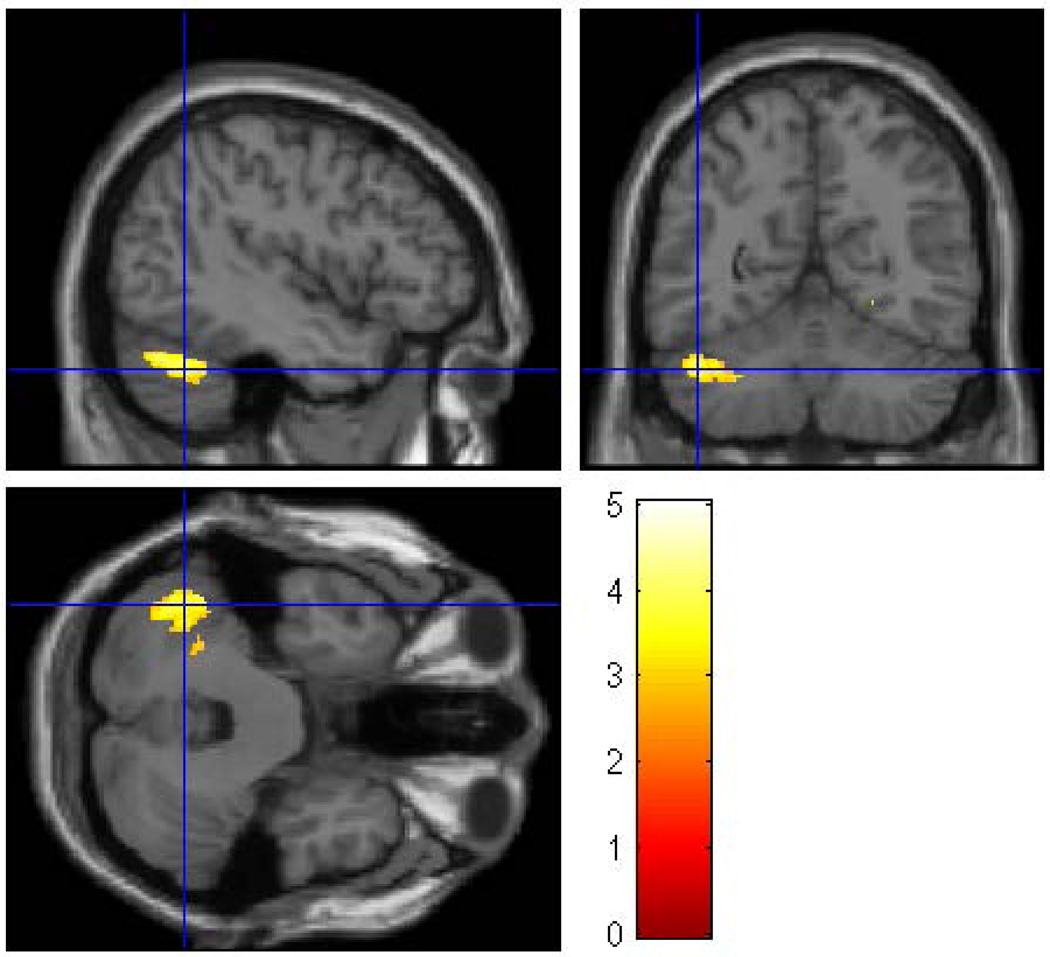
In the second gender separated analysis 49 female participants (31 HR and 18 LR) were compared. The groups did not differ with respect to socioeconomic status (SES), or ICV though the females, similar to all HR offspring, were significantly more likely to have been exposed to prenatal alcohol, drugs and cigarettes (Table 1). For the females, differences by risk group membership were seen for the right fusiform (p = 0.019), and for two cerebellar regions. Lobe 8 (left) showed a significant reduction in volume (p=0.006) as did the cerebellar crus I (p=0.001) (Figure 3, Table 4).
Figure 3.
A whole brain SPM8 analysis was performed for female participants only to assess the effect of familial/genetic risk using ICV, SUD, and prenatal exposure to alcohol, cigarettes, and drugs as covariates. The analysis revealed three clusters of voxels (right fusiform, left cerebellum crus I, and left cerebellum lobe 8) in which Low-Risk female offspring had larger gray matter volume than High-Risk female offspring The clusters were thresholded at p<0.005 and 200 voxels and family wise error correction applied (pFWE<0.05).
Table 4.
Low Risk Females > High Risk Females with ICV, personal history of substance use disorder (SUD), and prenatal exposure as covariates.
| Region |
MNI coordinates (mm) |
SPM Analysis | Mixed Model Analysis (SPSS) |
|||||
|---|---|---|---|---|---|---|---|---|
| X | Y | Z |
puncorr |
Peak T |
Cluster Extent |
pcorr (FWE) |
p Value | |
| Right fusiform | 30 | −45 | −14 | <0.001 | 5.01 | 462 | 0.019 | NS |
| Left cerebellum crus I |
−47 | −64 | −30 | <0.001 | 4.11 | 735 | 0.001 | 0.041 |
| Left cerebellum lobe 8 |
−26 | −64 | −62 | <0.001 | 5.02 | 562 | 0.006 | 0.045 |
There were 49 female subjects available for analysis; 41 subjects had complete information for all covariates.
Familial Risk Effects: Region of Interest Analysis within Gender
To investigate further the validity of the VBM results in males, additional SPSS analyses were performed on the extracted gray matter volumes of the fusiform, insula, and inferior temporal cortex. A mixed model SPSS analyses was performed using a family identifier to control for multiple sibling pairs within the sample. Relevant covariates were included in a mixed model analysis. These included ICV and prenatal exposure to alcohol, drugs and cigarettes. Also, included was whether or not the participant had received a diagnosis of substance use disorder before the scan. Initial models included all covariates with subsequent analyses removing non-significant covariates.
Males
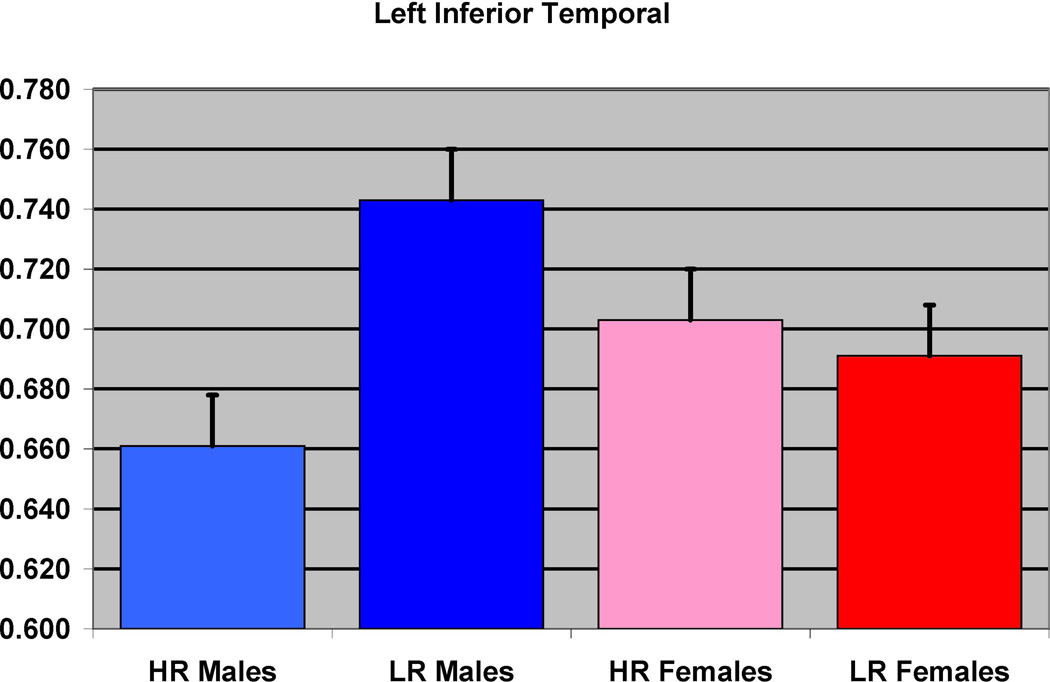
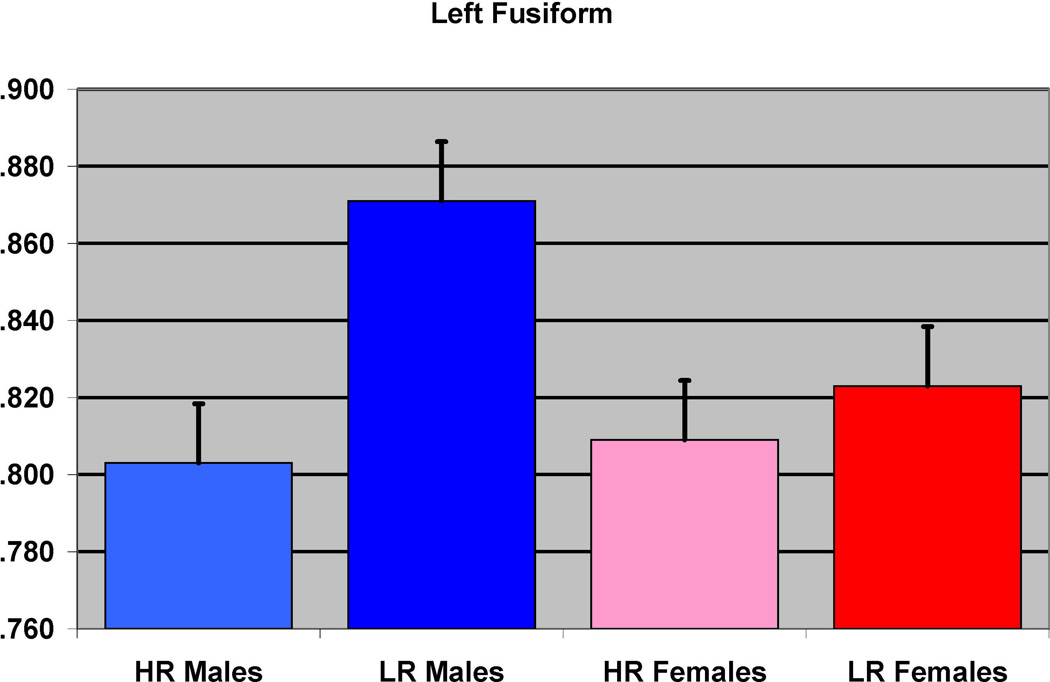
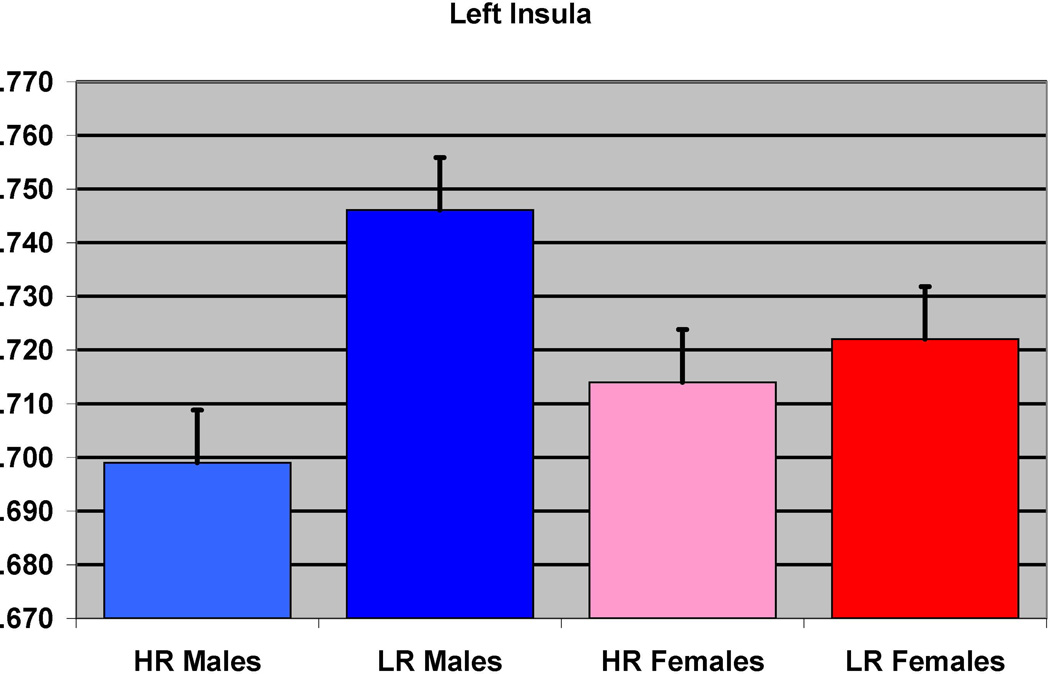
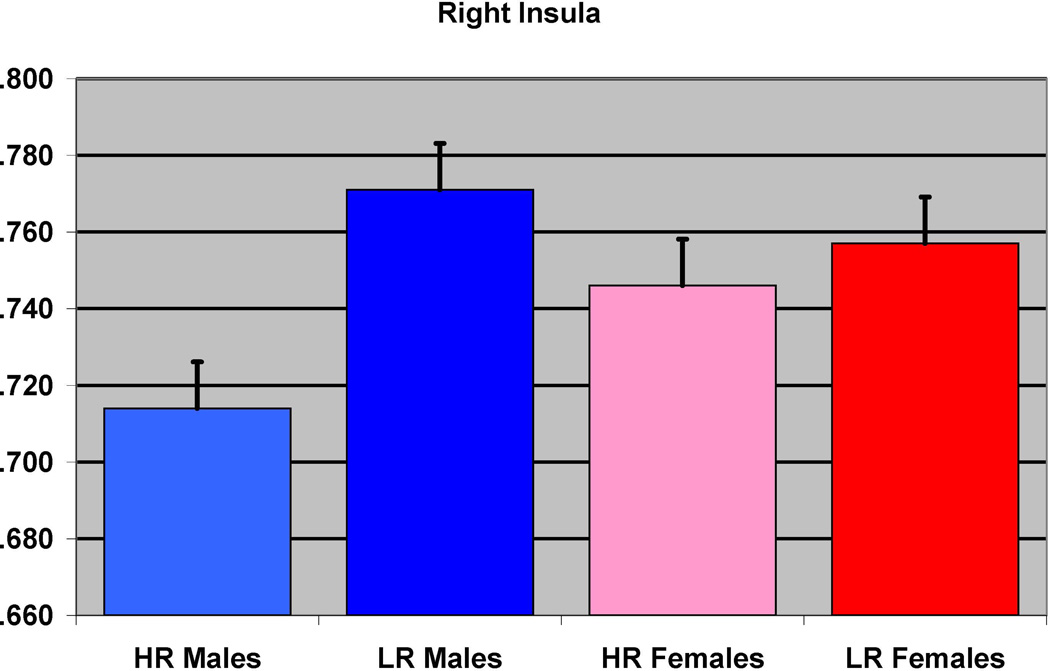
The SPSS results showed that HR males had reduced left inferior temporal cortex (F= 13.12, df =1,27, p = 0.001) (Figure 4) and left fusiform (F=9.91, df = 1, 27, p=0.004) (Figure 5), left insula (F= 4.24, df =1, 27, p = 0.049) (Figure 6) and right insula (F= 5.65, df =1,27, p=0.025) (Figure 7), in comparison to LR males (Table 3).
Figure 4.
The effect of familial risk group membership on the volume of the inferior temporal (left) is shown based on an analysis in which results were obtained within each gender. The risk group differences were significant for the males but not for the females.
Figure 5.
The effect of familial risk group membership on the volume of the fusiform (left) is shown based on an analysis in which results were obtained within each gender. The results were significant for the males but not for the females.
Figure 6.
The effect of familial risk group membership on the volume of the insula (left) is shown based on an analysis in which results were obtained within each gender. The results were significant for the males but not for the females.
Figure 7.
The effect of familial risk group membership on the volume of the insula (right) is shown based on an analysis in which results were obtained within each gender. The results were significant for the males but not for the females.
Females
Analysis within the female subject group revealed three regions with significant values using VBM: right fusiform, left cerebellum crus I, and left cerebellum lobe 8 (Table 4). SPSS analyses for the female group showed significant results for two of these regions: left cerebellum crus I (F= 4.51, df = 1,34, p = 0.041) and left cerebellum lobe 8 (F=4.45, df=.1, 24.44, p=0.045).
Prenatal Exposure Effects Within the High-Risk Group - Whole Brain VBM
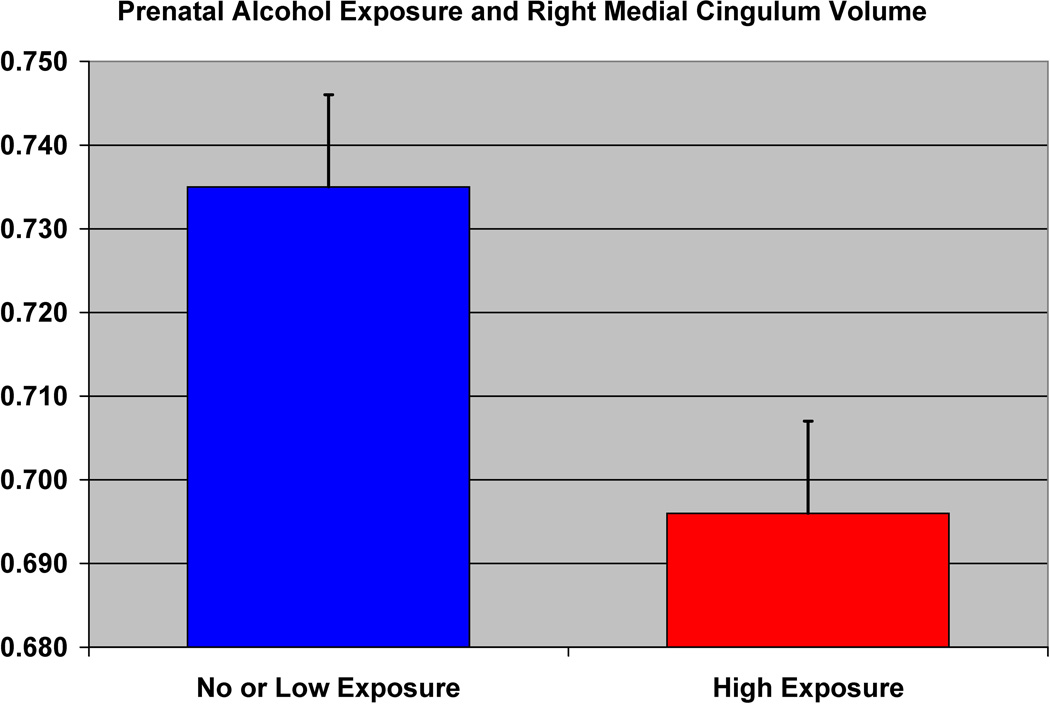
Within the HR group there were 16 (7 male; 9 female) subjects in the exposed group and 25 subjects (20 female; 5 male) in the non-exposed group. The average age of the exposed group was 26.88 ± 2.85 years and the non-exposed group was 27.84 ± 4.04 years. There were no differences by gender (p = 0.108), age (p = 0.411), and SES (p = 0.207) between the two groups. Whole brain VBM analysis (with covariates of gender, ICV, personal use of alcohol and cigarettes, prenatal exposure to drugs and cigarettes) revealed that prenatal alcohol exposure was associated with reduced volumes of the left middle temporal region (p = 0.009) (Figure 8 and Table 5a) and the right middle cingulum (p = 0.002) (Figure 9).
Figure 8.
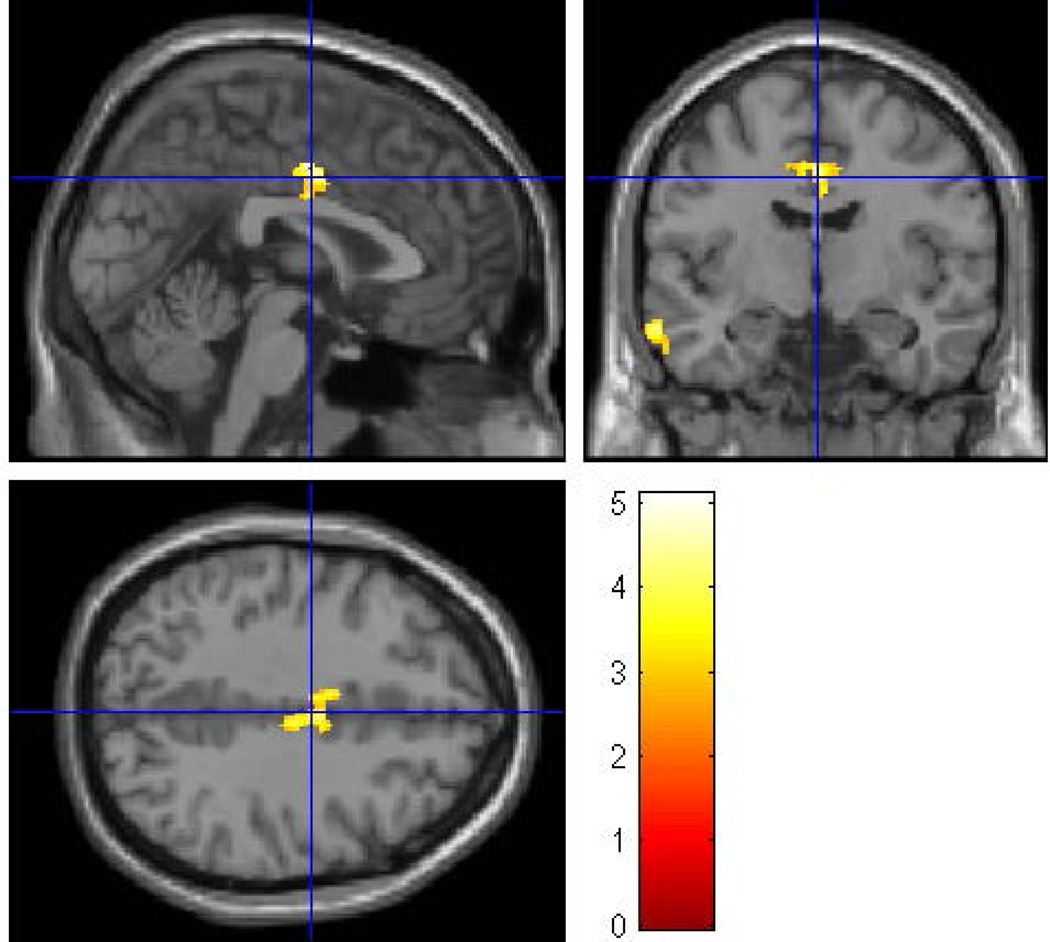
To determine the effects of prenatal alcohol exposure on whole brain volumes while controlling for familial risk effects, an SPM8 analysis was conducted within the high-risk sample controlling for gender, ICV, and personal exposure to alcohol and cigarettes, along with prenatal exposure to cigarettes and drugs. The clusters were thresholded at p<0.005 and 300 voxels with family wise error correction applied. The prenatally exposed subjects had reduced gray matter volume in the right middle cingulum (pFWE= 0.002, 623 voxels) and the left middle temporal regions (pFWE= 0.009, 505 voxels).
Table 5.
| a. Non Exposed and < Median Exposed Subjects in comparison to > Median Exposed Subjects (N= 22 versus N=14) | |||||||
|---|---|---|---|---|---|---|---|
| Region |
MNI coordinates (mm) |
SPM Analysisa | Mixed Model Analysis (SPSS)b |
||||
| X | Y | Z | Peak T |
Cluster Extent |
pcorrected (FWE) |
||
| Right middle cingulum |
2 | −9 | 42 | 6.19 | 623 | 0.002 | 0.042 |
| Left middle temporal | −62 | −10 | −18 | 4.44 | 505 | 0.009 | NS |
| b. Comparison of Non Exposed Subjects (N=15) to those Exposed at > Median Use (N=14) | |||||||
|---|---|---|---|---|---|---|---|
| Region |
MNI coordinates (mm) |
SPM Analysisa | Mixed Model Analysis (SPSS)b |
||||
| X | Y | Z | Peak T |
Cluster Extent |
pcorrected (FWE) |
||
| Right middle cingulum | 2 | −9 | 33 | 3.85 | 413 | 0.024 | NS |
| c. Comparison of Non Exposed Subjects (N=15) to those Exposed at < Median Use (N=7) | |||||||
|---|---|---|---|---|---|---|---|
| Region |
MNI coordinates (mm) |
SPM Analysisa | Mixed Model Analysis (SPSS)b |
||||
| X | Y | Z | Peak T |
Cluster Extent |
pcorrected (FWE) |
||
| Right anterior cingulum | 5 | 41 | 4 | 5.97 | 349 | 0.030* | 0.047 |
| Left cerebellum (4 & 5) |
−5 | −54 | −20 | 5.62 | 579 | 0.001* | NS |
All analyses included gender, ICV, personal use of alcohol and cigarettes and prenatal use of cigarettes and drugs as covariates.
The SPSS analysis used a linear mixed model analysis with family ID as a covariate to control for multiple siblings within families.
Figure 9.
The effect of prenatal alcohol exposure on the volume of the right middle cingulum in the high-risk subjects is shown.
Level of Exposure Effects
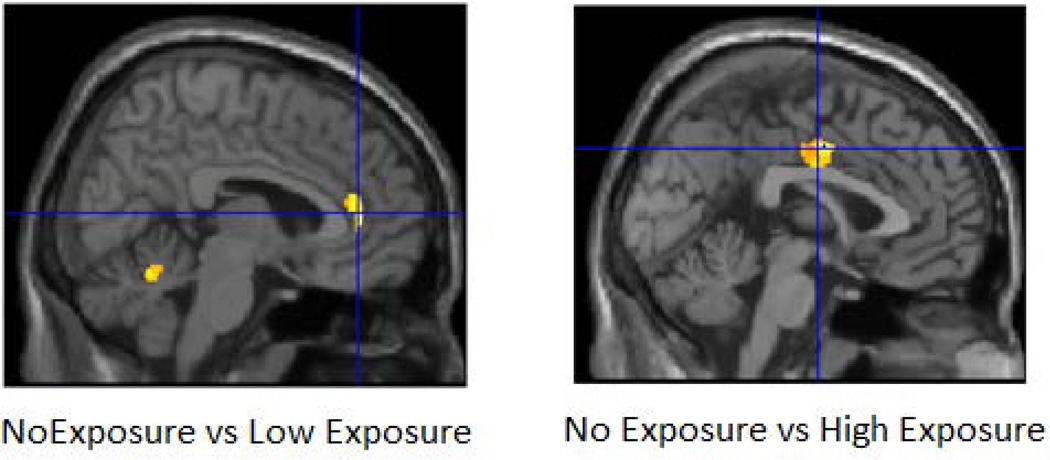
In a VBM comparison between non-exposed and high exposed groups, we found significant differences in the right middle cingulum (p =0.024) (Table 5b)(Figure 10a). In contrast, comparison of non-exposed and low exposed groups showed differences for the right anterior cingulum (p=0.030) and the left cerebellum (lobes 4 and 5) (p= 0.001) (Table 5c) (Figure 10b). SPSS analyses using the same covariates but also controlling for families with multiple siblings showed similar results for the right anterior cingulum.
Figure 10.
Results of the whole brain prenatal alcohol exposure analysis in SPM8 within the high-risk sample are shown. Analyses controlled for gender, ICV, personal exposure to alcohol and cigarettes, and prenatal exposure to cigarettes and drug. The clusters were thresholded at p<0.005 and 300 voxels and family wise error correction applied. Figure 10a (left) shows the results of comparing subjects without prenatal exposure (No Exposure Group) with subjects with those whose mothers reported use that was greater than the median for those mothers who drank during pregnancy (High Exposure Group) all of whom were from the HR group. Only one cluster survived the thresholding criterion. Offspring with high exposure had reduced gray matter volume in the right middle cingulum (pFWE= 0.024, 413 voxels). Figure 10b shows the results of comparing the No Exposure Group to those offspring whose mothers drank at levels less than the median of mothers reporting any drinking during pregnancy (No Exposure vs Low Exposure) within the HR group. Two clusters survived the thresholding criterion (right anterior cingulum (pFWE= 0.030, 349 voxels) and the left cerebellum lobes 4 and 5 (pFWE= 0.001, 579 voxels).
Prenatal Effects: Region of Interest Analysis
To investigate further the validity of these results, we performed mixed model analyses in SPSS on the extracted gray matter volumes for the middle cingulum and middle temporal cortex. This analysis revealed a reduction in the volume of the right middle cingulum (F=4.49, df =1, 32, p = 0.042) for the prenatally exposed group relative to the non-exposed group (Figure 9), though no differences were found in the left middle temporal region (Table 5a). As may be seen (Figure 9), the right middle cingulum showed reduction in volume in association with prenatal alcohol exposure.
Discussion
An extensive literature now exists showing that prenatal exposure to alcohol and other drugs is associated with regional abnormalities of brain volume (Riley and McGee, 2005; Moore et al., 2014). The contribution of familial risk factors to these abnormalities often is unknown because of limitations regarding the familial risk status of the mothers (Riley and McGee, 2005). Children with alcohol dependent mothers are often raised in foster families so that at the time of recruitment reliable information about the mother and other family members’ drinking, smoking, and drug use is not attainable (O'Brien and Hill, 2015). Similarly, studies contrasting family history positive and negative offspring frequently do not have data concerning prenatal exposures. As a result, few studies control for prenatal exposure to alcohol, drugs and cigarettes when looking at familial risk effects on brain structural and functional characteristics (Cservenka, 2016).
The purpose of the present set of analyses was to determine if particular regional brain changes are associated with familial risk factors and to determine if the same or different regions would be associated with prenatal exposures. The present report is the first whole brain analysis that provides a comprehensive approach for separating the brain gray matter differences associated with familial genetic risk and prenatal exposure pathways. Our results suggest that regions associated with a familial diathesis for alcohol dependence may differ from those altered by prenatal exposure. Because of the study design, we were able to separate the effects of familial risk and prenatal alcohol exposure on offspring brain gray matter volume.
Familial Risk
Our principal finding is that familial risk for AD results in reduced volume in regions that are separate from those seen in association with prenatal exposure. High-risk male subjects exhibit lower gray matter volume in the fusiform, insula and inferior temporal regions. Similarly, female HR subjects showed reduced volume for the right fusiform. These regions have been identified as important in social cognition. The fusiform is a key brain area involved in social perception and cognition and provides a building block for social skill development (Schultz, 2005). Our results are consistent with an alcohol cue-related fMRI study that found differences in BOLD response between family history positive and negative college students with greater activation of the fusiform to repeated alcohol related images in family history positive subjects relative to controls (Dager et al., 2013). Similarly, our finding of reduction in insula volume in HR males is congruent with a report showing that the insula plays a key role in the recall of emotional experience during craving and influences drug seeking decision-making (Naqvi et al., 2014). These results suggest that regions associated with social cognition may provide neural underpinnings for a genetic diathesis for familial risk for AD.
Our findings of loss of gray matter volume in the inferior temporal cortex (ITC) in the HR male group is important as the ITC is associated with socio-emotional processing and receives information from the visual cortex’s ventral stream, a region essential for recognizing patterns, faces, and objects (Creem and Proffitt, 2001). Additionally, the involvement of the ITC in the modulation of craving for alcohol in patients with alcohol use disorder (AUD) has been reported (Karch et al., 2015).
Although we found ITC reduction in association with familial risk effects, others have reported ITC alteration in association with prenatal exposure to alcohol. Chen et al., (2012) reported lesser gray matter volume of right ITC among young adults who were prenatally exposed in comparison to healthy controls. Similarly, Zhou et al., (2011) showed lesser cortical thickness and higher age related cortical thinning in left ITC in participants with fetal alcohol spectrum disorder. However, neither of these studies investigated the role of familial risk for AD.
In addition to alteration in regions associated with social cognition, the female HR subjects showed reduced volume of the left crus I and left lobe 8 of the cerebellum. This finding of reduced volume of these cerebellar regions would appear to be at odds with our previous reports of larger cerebellar volume that appears to be associated with inefficient pruning among high-risk offspring (Hill et al., 2007; 2011, 2015). The difference in findings can be explained on the basis of differences in sample selection. These previous reports concerned multiplex families ascertained through pairs of male alcohol dependent probands. Mothers of offspring from that study typically were not large consumers of alcohol during pregnancy (Hill et al., 2009) in contrast to offspring from this study of multiplex families ascertained through pairs of female alcohol dependent probands who show much higher levels of alcohol consumption during pregnancy. Due to the high collinearity between risk for AD and use of alcohol during pregnancy, we may not have been able to completely separate the effects of familial risk and higher levels of alcohol consumption in the present sample resulting in the observed reduction of cerebellar volume in this study.
Prenatal Effects
In contrast to our findings for familial risk effects, prenatal exposure to alcohol was associated with lower gray matter volume in right middle cingulum, right anterior cingulum, left middle temporal regions, and lobes 4 and 5 of the cerebellum. Our finding of reduction of gray matter volume in middle cingulum region is consistent with a previous report showing an effect of prenatal alcohol exposure on the cingulum (Moore et al., 2014). The present study also found a significant prenatal exposure effect for the left middle temporal gyrus (MTG) region based on the VBM analysis. These results are consistent with Eckstrand et al., (2012) who showed dose dependent effects of prenatal alcohol exposure and reduction of gray matter volume of right MTG among children who had heavy prenatal exposure to alcohol.
Although our MTG findings were found in association with prenatal exposure effects, others have noted MTG results in association with familial risk effects. In an fMRI study assessing BOLD response to Go/NoGo trials, Acheson et al., (2014 a,b) observed higher activations in the in the middle temporal gyrus (BA 39 and 19) in their family history positive group. However, family history positive alcohol naïve youth have been reported to show blunted BOLD response in MTG for happy faces in an fMRI study (Cservenka et al., 2014). Similarly, HR youth show diminished BOLD response in the middle temporal gyrus during performance of the theory of mind task (Eyes Task of Baron-Cohen), a task which requires identification of emotions based on pictures of eyes on a screen (Hill et al., 2007).
Limitations
Although this study presents novel findings concerning the brain regions that are most influenced by familial risk factors versus those associated with prenatal exposure to alcohol, the study limitations warrant discussion. The distribution of subjects by gender varied between the high and low-risk groups. Considering the underlying differences in the brain morphology of male and female subjects, testing for differences in male and female only samples was warranted but resulted in loss of subjects and associated power. Additionally, prenatal use of particular substances was not available for all subjects. Accordingly, VBM analyses involving use of covariates to control for specific prenatal exposures required the elimination of those subjects without this information (a total of 13 subjects) reducing the power of the analysis. This limitation was offset by the mixed model analysis performed using SPSS in which subjects missing a particular covariate are not dropped from the analysis. Accordingly, the analyses performed in SPSS did allow for inclusion of all subjects even those with missing covariates.
Use of ultra-high-risk alcohol dependence families, as was done in the present study, has both strengths and weaknesses. Use of these families to assess the impact of prenatal substance use provides a unique opportunity to hold constant the familial/genetic susceptibility for substance use disorders while examining the impact of specific prenatal exposures on offspring. On the other hand, these families are not representative of AD families in the general population. Follow-up of offspring from these multiplex families has revealed an exceptionally high rate of AD and substance use by young adulthood (Hill et al 2008; 2011). In our view, use of extreme sampling methodology that results in inclusion of multiplex families provides an efficient means for identifying risk factors that can then be taken to population samples for replication.
A notable strength of our analysis was our ability to simultaneously assess familial risk, prenatal exposures, and personal alcohol and cigarettes exposure. This demonstration of a differential effect of familial risk and prenatal exposure on brain volumes provides a unique understanding of the separate and potentially interactive effects of these conditions. Another strength of the study was its use of data from third generation offspring from a long-term follow-up family study. The offspring participated in a longitudinal follow-up in which multiple assessments of alcohol and drug use were obtained. These prospectively gathered measures provided a cumulative estimate of personal exposure to substances (alcohol, cigarettes, and drugs) known to have a direct effect on brain morphology.
Acknowledgments
We wish to acknowledge the contribution of the family members who have contributed their time and effort in participating in multiple interview sessions over several years, and who continue to be involved in clinical follow up. Also, we want to acknowledge the contributions of many clinical staff in assessing research participants to determine phenotypic data. A special thanks to Brian Holmes for assistance in manuscript preparation and Jeannette Locke-Wellman for database support. The financial support for the study reported in this manuscript was provided by NIAAA Grants AA018289, AA05909, AA015168, AA08082, and AA021746 to SYH.
Footnotes
Conflict of Interest
The authors declare that they have no conflict of interest.
References
- Acheson A, Franklin C, Cohoon AJ, Glahn DC, Fox PT, Lovallo WR. Anomalous temporoparietal activity in individuals with a family history of alcoholism: studies from the Oklahoma Family Health Patterns Project. Alcohol Clin Exp Res. 2014b;38:1639–1645. doi: 10.1111/acer.12420. [DOI] [PMC free article] [PubMed] [Google Scholar]
- Acheson A, Tagamets, Rowland LM, Mathias CW, Wright SN, Hong LE, Kochunov P, Dougherty DM. Increased forebrain activations in youths with family histories of alcohol and other substance use disorders performing a Go/NoGo task. Alcohol Clin Exp Res. 2014a;38:2944–2951. doi: 10.1111/acer.12571. [DOI] [PMC free article] [PubMed] [Google Scholar]
- Archibald SL, Fennema-Notestine C, Gamst A, Riley EP, Mattson SN, Jernigan TL. Brain dysmorphology in individuals with severe prenatal alcohol exposure. Dev Med Child Neurol. 2001;43:148–154. [PubMed] [Google Scholar]
- Astley SJ, Aylward EH, Olson HC, Kerns K, Brooks A, Coggins TE, Davies J, Dorn S, Gendler B, Jirikowic T, Kraegel P, Maravilla K, Richards T. Magnetic resonance imaging outcomes from a comprehensive magnetic resonance study of children with fetal alcohol spectrum disorders. Alcohol Clin Exp Res. 2009;33:1671–1689. doi: 10.1111/j.1530-0277.2009.01004.x. [DOI] [PMC free article] [PubMed] [Google Scholar]
- Benegal V, Antony G, Venkatasubramanian G, Jayakumar PN. Gray matter volume abnormalities and externalizing symptoms in subjects at high risk for alcohol dependence. Addict Biol. 2007;12:122–132. doi: 10.1111/j.1369-1600.2006.00043.x. [DOI] [PubMed] [Google Scholar]
- Chen X, Coles CD, Lynch ME, Hu X. Understanding specific effects of prenatal alcohol exposure on brain structure in young adults. Human Brain Mapp. 2012;33:1663–1676. doi: 10.1002/hbm.21313. [DOI] [PMC free article] [PubMed] [Google Scholar]
- Coles CD, Goldstein FC, Lynch ME, Chen X, Kable JA, Johnson KC, Hu X. Memory and brain volume in adults prenatally exposed to alcohol. Brain Cogn. 2011;75:67–77. doi: 10.1016/j.bandc.2010.08.013. [DOI] [PMC free article] [PubMed] [Google Scholar]
- Creem SH, Proffitt DR. Defining the cortical visual systems: "what", "where", and "how". Acta Psychol (Amst) 2001;107:43–68. doi: 10.1016/s0001-6918(01)00021-x. [DOI] [PubMed] [Google Scholar]
- Cservenka A. Neurobiological phenotypes associated with a family history of alcoholism. Drug Alcohol Depend. 2016;158:8–21. doi: 10.1016/j.drugalcdep.2015.10.021. [DOI] [PMC free article] [PubMed] [Google Scholar]
- Cservenka A, Fair DA, Nagel BJ. Emotional processing and brain activity in youth at high risk for alcoholism. Alcohol Clin Exp Res. 2014;38:1912–1923. doi: 10.1111/acer.12435. [DOI] [PMC free article] [PubMed] [Google Scholar]
- Cservenka A, Gillespie AJ, Michael PG, Nagel BJ. Family history density of alcoholism relates to left nucleus accumbens volume in adolescent girls. J Stud Alcohol Drugs. 2015;76:47–56. [PMC free article] [PubMed] [Google Scholar]
- Cservenka A, Herting MM, Nagel BJ. Atypical frontal lobe activity during verbal working memory in youth with a family history of alcoholism. Drug Alcohol Depend. 2012;123:98–104. doi: 10.1016/j.drugalcdep.2011.10.021. [DOI] [PMC free article] [PubMed] [Google Scholar]
- Dager AD, Anderson BM, Stevens MC, Pulido C, Rosen R, Jiantonio-Kelly RE, Sisante JF, Raskin SA, Tennen H, Austad CS, Wood RM, Fallahi CR, Pearlson GD. Influence of alcohol use and family history of alcoholism on neural response to alcohol cues in college drinkers. Alcohol Clin Exp Res. 2013;37(Suppl 1):E161–E171. doi: 10.1111/j.1530-0277.2012.01879.x. [DOI] [PMC free article] [PubMed] [Google Scholar]
- Dager AD, McKay DR, Kent JW, Jr, Curran JE, Knowles E, Sprooten E, Göring HH, Dyer TD, Pearlson GD, Olvera RL, Fox PT, Lovallo WR, Duggirala R, Almasy L, Blangero J, Glahn DC. Shared genetic factors influence amygdala volumes and risk for alcoholism. Neuropsychopharmacology. 2015;40:412–420. doi: 10.1038/npp.2014.187. [DOI] [PMC free article] [PubMed] [Google Scholar]
- Donald KA, Eastman E, Howells FM, Adnams C, Riley EP, Wood RP, Narr KL, Stein DJ. Neuroimaging effects of prenatal alcohol exposure on the developing human brain: a magnetic resonance imaging review. Acta Neuropsychiatrica. 2015;27:251–269. doi: 10.1017/neu.2015.12. [DOI] [PubMed] [Google Scholar]
- Eckstrand KL, Ding Z, Dodge NC, Cowan RL, Jacobson JL, Jacobson SW, Avison MJ. Persistent dose-dependent changes in brain structure in young adults with low-to-moderate alcohol exposure in utero. Alcohol Clin Exp Res. 2012;36:1892–1902. doi: 10.1111/j.1530-0277.2012.01819.x. [DOI] [PMC free article] [PubMed] [Google Scholar]
- Glausier JR, Lewis DA. Dendritic spine pathology in schizophrenia. Neuroscience. 2013;251:90–107. doi: 10.1016/j.neuroscience.2012.04.044. [DOI] [PMC free article] [PubMed] [Google Scholar]
- Hill SY, De Bellis MD, Keshavan MS, Lowers L, Shen S, Hall J, Pitts T. Right amygdala volume in adolescent and young adult offspring from families at high risk for developing alcoholism. Biol Psychiatry. 2001;49:894–905. doi: 10.1016/s0006-3223(01)01088-5. [DOI] [PubMed] [Google Scholar]
- Hill SY, Kostelnik B, Holmes B, Goradia D, McDermott M, Diwadkar V, Keshavan M. fMRI BOLD response to the eyes task in offspring from multiplex alcohol dependence families. Alcohol Clin Exp Res. 2007;31:2028–2035. doi: 10.1111/j.1530-0277.2007.00535.x. [DOI] [PMC free article] [PubMed] [Google Scholar]
- Hill SY, Lichenstein S, Wang S, Carter H, McDermott M. Caudate volume in offspring at ultra high risk for alcohol dependence: COMT Val158Met, DRD2, externalizing disorders, and working memory. Advance J Mol Imaging. 2013a;3:43–54. doi: 10.4236/ami.2013.34007. [DOI] [PMC free article] [PubMed] [Google Scholar]
- Hill SY, Lichenstein SD, Wang S, O'Brien J. Volumetric differences in cerebellar lobes in individuals from multiplex alcohol dependence families and controls: Their relationship to externalizing and internalizing disorders and working memory. Cerebellum. 2015 doi: 10.1007/s12311-015-0747-8. [DOI] [PMC free article] [PubMed] [Google Scholar]
- Hill SY, Shen S, Locke-Wellman J, Matthews AG, McDermott M. Psychopathology in offspring from multiplex alcohol dependence families: A prospective study during childhood and adolescence. Psychiatry Res. 2008;160:155–166. doi: 10.1016/j.psychres.2008.04.017. [DOI] [PMC free article] [PubMed] [Google Scholar]
- Hill SY, Wang S, Carter H, McDermott MD, Zezza N, Stiffler S. Amygdala volume in offspring from multiplex for alcohol dependence families: The moderating influence of childhood environment and 5-HTTLPR variation. J Alcohol Drug Depend Suppl. 2013b;1 doi: 10.4172/2329-6488.S1-001. 001. [DOI] [PMC free article] [PubMed] [Google Scholar]
- Hill SY, Wang S, Carter H, Tessner K, Holmes B, McDermott M, Zezza N, Stiffler S. Cerebellum volume in high-risk offspring from multiplex alcohol dependence families: Association with allelic variation in GABRA2 and BDNF. Psychiatry Res. 2011;194:304–313. doi: 10.1016/j.pscychresns.2011.05.006. [DOI] [PMC free article] [PubMed] [Google Scholar]
- Hill SY, Wang S, Kostelnik B, Carter H, Holmes B, McDermott M, Zezza N, Stiffler S, Keshavan MS. Disruption of orbitofrontal cortex laterality in offspring from multiplex alcohol dependence families. Biol Psychiatry. 2009;65:129–136. doi: 10.1016/j.biopsych.2008.09.001. [DOI] [PMC free article] [PubMed] [Google Scholar]
- Karch S, Keeser D, Hümmer S, Paolini M, Kirsch V, Karali T, Kupka M, Rauchmann BS, Chrobok A, Blautzik J, Koller G, Ertl-Wagner B, Pogarell O. Modulation of craving related brain responses using real-time fMRI in patients with alcohol use disorder. PloS One. 2015;10:e0133034. doi: 10.1371/journal.pone.0133034. [DOI] [PMC free article] [PubMed] [Google Scholar]
- Li Z, Ma X, Peltier S, Hu X, Coles CD, Lynch ME. Occipital-temporal reduction and sustained visual attention deficit in prenatal alcohol exposed adults. Brain Imaging Behav. 2008;2:39–48. doi: 10.1007/s11682-007-9013-0. [DOI] [PMC free article] [PubMed] [Google Scholar]
- Moore EM, Migliorini R, Infante MA, Riley EP. Fetal alcohol spectrum disorders: Recent neuroimaging findings. Curr Dev Disord Rep. 2014;1:161–172. doi: 10.1007/s40474-014-0020-8. [DOI] [PMC free article] [PubMed] [Google Scholar]
- Naqvi NH, Gaznick N, Tranel D, Bechara A. The insula: a critical neural substrate for craving and drug seeking under conflict and risk. Ann N Y Acad Sci. 2014;1316:53–70. doi: 10.1111/nyas.12415. [DOI] [PMC free article] [PubMed] [Google Scholar]
- Nardelli A, Lebel C, Rasmussen C, Andrew G, Beaulieu C. Extensive deep gray matter volume reductions in children and adolescents with fetal alcohol spectrum disorders. Alcohol Clin Exp Res. 2011;35:1404–1417. doi: 10.1111/j.1530-0277.2011.01476.x. [DOI] [PubMed] [Google Scholar]
- O'Brien JW, Hill SY. Effects of prenatal alcohol and cigarette exposure on offspring substance use in multiplex, alcohol-dependent families. Alcohol Clin Exp Res. 2015;38:2952–2961. doi: 10.1111/acer.12569. [DOI] [PMC free article] [PubMed] [Google Scholar]
- Rajaprakash M, Chakravarty MM, Lerch JP, Rovet J. Cortical morphology in children with alcohol-related neurodevelopmental disorder. Brain Behav. 2014;4:41–50. doi: 10.1002/brb3.191. [DOI] [PMC free article] [PubMed] [Google Scholar]
- Riccomagno MM, Kolodkin AL. Sculpting neural circuits by axon and dendrite pruning. Annu Rev Cell Dev Biol. 2015;31:779–805. doi: 10.1146/annurev-cellbio-100913-013038. [DOI] [PMC free article] [PubMed] [Google Scholar]
- Riikonen RS, Nokelainen P, Valkonen K, Kolehmainen AI, Kumpulainen KI, Könönen M, Vanninen RL, Kuikka JT. Deep serotonergic and dopaminergic structures in fetal alcoholic syndrome: a study with nor-beta-CIT-single-photon emission computed tomography and magnetic resonance imaging volumetry. Biol Psychiatry. 2005;57:1565–1572. doi: 10.1016/j.biopsych.2005.01.029. [DOI] [PubMed] [Google Scholar]
- Riley EP, McGee CL. Fetal alcohol spectrum disorders: an overview with emphasis on changes in brain and behavior. Exp Biol Med (Maywood) 2005;230:357–365. doi: 10.1177/15353702-0323006-03. [DOI] [PubMed] [Google Scholar]
- Robins LN, Helzer JE, Croughan J, Ratcliff KS. National Institute of Mental Health Diagnostic Interview Schedule. Its history, characteristics, and validity. Arch Gen Psychiatry. 1981;38:381–389. doi: 10.1001/archpsyc.1981.01780290015001. [DOI] [PubMed] [Google Scholar]
- Sacks JJ, Gonzales KR, Bouchery EE, Tomedi LE, Brewer RD. 2010 National and state costs of excessive alcohol consumption. Am J Prev Med. 2015;49:e73–e79. doi: 10.1016/j.amepre.2015.05.031. [DOI] [PubMed] [Google Scholar]
- Schultz RT. Developmental deficits in social perception in autism: the role of the amygdala and fusiform face area. Int J Dev Neurosci. 2005;23:125–141. doi: 10.1016/j.ijdevneu.2004.12.012. [DOI] [PubMed] [Google Scholar]
- Schweinsburg AD, Paulus MP, Barlett VC, Killeen LA, Caldwell LC, Pulido C, Brown SA, Tapert SF. An fMRI study of response inhibition in youths with a family history of alcoholism. Ann N Y Acad Sci. 2004;1021:391–394. doi: 10.1196/annals.1308.050. [DOI] [PubMed] [Google Scholar]
- Silveri MM, Rogowska J, McCaffrey A, Yurgelun-Todd DA. Adolescents at risk for alcohol abuse demonstrate altered frontal lobe activation during Stroop performance. Alcohol Clin Exp Res. 2011;35:218–228. doi: 10.1111/j.1530-0277.2010.01337.x. [DOI] [PMC free article] [PubMed] [Google Scholar]
- Sjoerds Z, Van Tol MJ, Van den Brink W, Van der Wee NJ, Van Buchem MA, Aleman A, Penninx BW, Veltman DJ. Family history of alcohol dependence and gray matter abnormalities in non-alcoholic adults. World J Biol Psychiatry. 2013;14:565–573. doi: 10.3109/15622975.2011.640942. [DOI] [PubMed] [Google Scholar]
- Sowell ER, Thompson PM, Mattson SN, Tessner KD, Jernigan TL, Riley EP, Toga AW. Regional brain shape abnormalities persist into adolescence after heavy prenatal alcohol exposure. Cereb Cortex. 2002a;12:856–865. doi: 10.1093/cercor/12.8.856. [DOI] [PubMed] [Google Scholar]
- Sowell ER, Thompson PM, Peterson BS, Mattson SN, Welcome SE, Henkenius AL, Riley EP, Jernigan TL, Toga AW. Mapping cortical gray matter asymmetry patterns in adolescents with heavy prenatal alcohol exposure. NeuroImage. 2002b;17:1807–1819. doi: 10.1006/nimg.2002.1328. [DOI] [PubMed] [Google Scholar]
- Tang G, Gudsnuk K, Kuo SH, Cotrina ML, Rosoklija G, Sosunov A, Sonders MS, Kanter E, Castagna C, Yamamoto A, Yue Z, Arancio O, Peterson BS, Champagne F, Dwork AJ, Goldman J, Sulzer D. Loss of mTOR-dependent macroautophagy causes autistic-like synaptic pruning deficits. Neuron. 2014;83:1131–1143. doi: 10.1016/j.neuron.2014.07.040. [DOI] [PMC free article] [PubMed] [Google Scholar]
- Wendell AD. Overview and epidemiology of substance abuse in pregnancy. Clin Obstet Gynecol. 2013;56:91–96. doi: 10.1097/GRF.0b013e31827feeb9. [DOI] [PubMed] [Google Scholar]
- Zhou D, Lebel C, Lepage C, Rasmussen C, Evans A, Wyper K, Pei J, Andrew G, Massey A, Massey D, Beaulieu C. Developmental cortical thinning in fetal alcohol spectrum disorders. NeuroImage. 2011;58:16–25. doi: 10.1016/j.neuroimage.2011.06.026. [DOI] [PubMed] [Google Scholar]


