Figure 4.
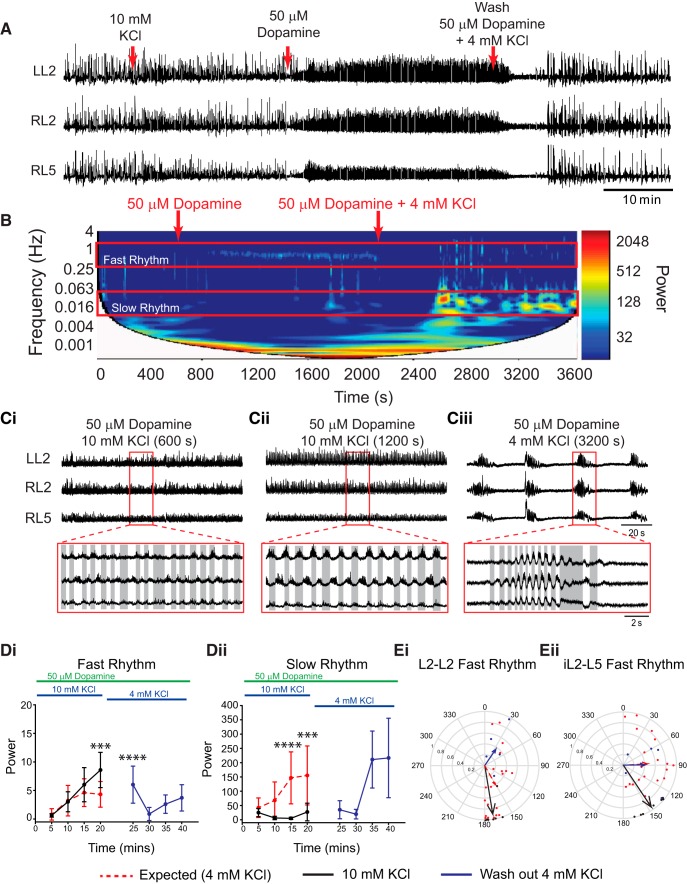
Boosting network excitation with KCl prior to the application of dopamine evokes locomotor-like rhythmicity. A, Neurograms recorded from left and right L2 and right L5 ventral roots illustrate the experimental paradigm and the resultant effect on rhythmicity. KCl concentration was increased to 10 mm to boost network excitation 20 min prior to application of 50 µm dopamine (DA). Subsequent application of DA resulted in the direct expression of a continuous locomotor-like rhythm that returned to a multirhythm when washed out with regular (4 mm KCl) aCSF and 50 µm DA. B, Frequency power spectrogram with frequency on the left y-axis, time on the x-axis, and increasing power represented as warmer colors. Ci, Cii, Raw data showing zoomed regions represented in B of 50 µm dopamine plus 10 mm KCl at a longer time point (Ci) and following wash in of 4 mm KCl (Cii). D, Region-of-interest analysis of fast and slow rhythms within L2 root pairs illustrate significantly higher power of the fast rhythm with 10 mm KCl compared with the expected rhythm power at 4 mm KCl. Di, The slow rhythm showed significantly lower power compared with the expected multirhythm evoked in the 4 mm KCl condition. Dii, The expected power values returned to the same level as the expected condition following a washout with 4 mm KCl (Blue lines). Ei, Eii, Circular plots in Ei and Eii illustrate a locomotor-like pattern with vector length increases accompanied by phase angles moving toward 180° (alternating) in both the left and right L2s and ipsilateral L2–L5 at higher KCl concentrations. The length of arrows represents mean vector length (r) and angle or robustness of the pattern. Red lines represent mean data (n = 20 preparations) when 50 µm DA (aCSF, 4 mm KCl) was applied, and 20 min of baseline data were analyzed. Black lines represent the rhythm evoked by 50 µm DA under enhanced network excitation (aCSF, 10 mm KCl), and blue lines represent the washout condition of DA (aCSF, 4 mm KCl). Each dot in the phase plots represents the average phase for an individual preparation for each respective experimental condition. Data are presented as the mean ± SD. A two-way ANOVA between each excitability condition (DA-evoked rhythm in 4 mm KCl, 10 mm KCl, and washing with 4 mm KCl) and time to examine the effects of manipulating network excitation prior to DA application. When significant main effects of interactions were detected Tukey post hoc analysis between time-matched points following DA application were conducted. Asterisks denote significance, as follows: *p < 0.05, **p < 0.01, ***p < 0.001.

