

Abstract
Objective:
To examine whether long-term measures of cortisol predict Alzheimer disease (AD) risk.
Method:
We used a prospective longitudinal design to examine whether cortisol dysregulation was related to AD risk. Participants were from the Baltimore Longitudinal Study of Aging (BLSA) and submitted multiple 24-hour urine samples over an average interval of 10.56 years. Urinary free cortisol (UFC) and creatinine (Cr) were measured, and a UFC/Cr ratio was calculated to standardize UFC. To measure cortisol regulation, we used within-person UFC/Cr level (i.e., within-person mean), change in UFC/Cr over time (i.e., within-person slope), and UFC/Cr variability (i.e., within-person coefficient of variation). Cox regression was used to assess whether UFC/Cr measures predicted AD risk.
Results:
UFC/Cr level and UFC/Cr variability, but not UFC/Cr slope, were significant predictors of AD risk an average of 2.9 years before AD onset. Elevated UFC/Cr level and elevated UFC/Cr variability were related to a 1.31- and 1.38-times increase in AD risk, respectively. In a sensitivity analysis, increased UFC/Cr level and increased UFC/Cr variability predicted increased AD risk an average of 6 years before AD onset.
Conclusions:
Cortisol dysregulation as manifested by high UFC/Cr level and high UFC/Cr variability may modulate the downstream clinical expression of AD pathology or be a preclinical marker of AD.
Cortisol dysregulation is commonly found in patients with Alzheimer disease (AD)1–5 and has been related to AD pathology in animals and humans.4,6–10 In rodent models, glucocorticoid increases have preceded β-amyloid (Aβ) plaques and tau phosphorylation (for review, see references 7 and 8). Glucocorticoid treatment in nonhuman primates has been associated with increases in more pathogenic (Aβ42) relative to less pathogenic (Aβ40) Aβ species.9 In patients with AD, elevations in baseline cortisol have predicted AD progression,4,6 and in cognitively normal and older adults with AD, higher cortisol has been related to increased Aβ brain burden.10
Despite these findings, few prospective longitudinal studies have investigated whether cortisol dysregulation precedes AD. The Rotterdam Study found no significant association between baseline cortisol and risk of incident dementia or AD 7.1 years (range 0.1–9.6 years) later in 243 adults (mean age 72 years).11 These findings are limited, however, by the assessment of cortisol at only one time on 1 day.
The current study measured 24-hour urinary free cortisol (UFC) from a mean of 4.3 (range 2–12) samples per person spanning a follow-up interval of 10.56 years (range 1–31 years) to examine cortisol regulation as a predictor of AD onset. UFC was collected from 1,025 participants in the Baltimore Longitudinal Study of Aging (BLSA) who were dementia-free throughout UFC collection. Over the course of the study, 94 individuals met diagnostic criteria for AD. This study examines the association between longitudinal measures of UFC and AD risk.
METHOD
Participants.
Participants were volunteers from the BLSA, a study of healthy adults ≥20 years of age performed by the National Institute on Aging. For the present study, the initial sample included 1,865 participants. People who were diagnosed with mild cognitive impairment (n = 110) or non-AD dementia (n = 52) or were cognitively impaired but lacked a diagnosis of mild cognitive impairment (n = 9) were excluded. Cortisol collected after the onset of AD or exclusionary neurologic disorder was not included, resulting in the exclusion of 33 cases (31 participants with AD, 1 with Parkinson disease, and 1 with stroke). These exclusions resulted in a sample of 1,661 participants who were free of cognitive impairment at baseline. The present analysis focused on control participants, defined as those who did not develop cognitive impairment or dementia (n = 1,519), and participants who subsequently developed AD (n = 142), referred to as future AD.
Twenty-four–hour UFC and creatinine (Cr) levels were measured, and a UFC/Cr ratio was calculated to standardize UFC. To increase measurement reliability, we used a minimum of two 24-hour UFC/Cr values to calculate within-person UFC/Cr measures; thus, we excluded participants who had only 1 UFC/Cr measure (n = 563; future AD = 44, controls = 519). The group with 1 UFC/Cr measure was significantly younger (mean age = 51.66 years) at baseline compared to the group with >1 UFC/Cr value (mean age = 60.35 years) [t(1659) = −10.78, p < 0.001] and had a significantly greater proportion of nonwhite participants [32.7% vs 25.3%, χ2(1) = 10.05, p = 0.002]. BLSA recruitment strategies accounted for the differences between groups. Because of continuous recruitment into the BLSA and later efforts to recruit more minorities, younger adults and minorities were recruited later and consequently had fewer UFC/Cr measures. There were no other differences in demographic variables between groups with 1 and >1 UFC/Cr measures (all p > 0.05).
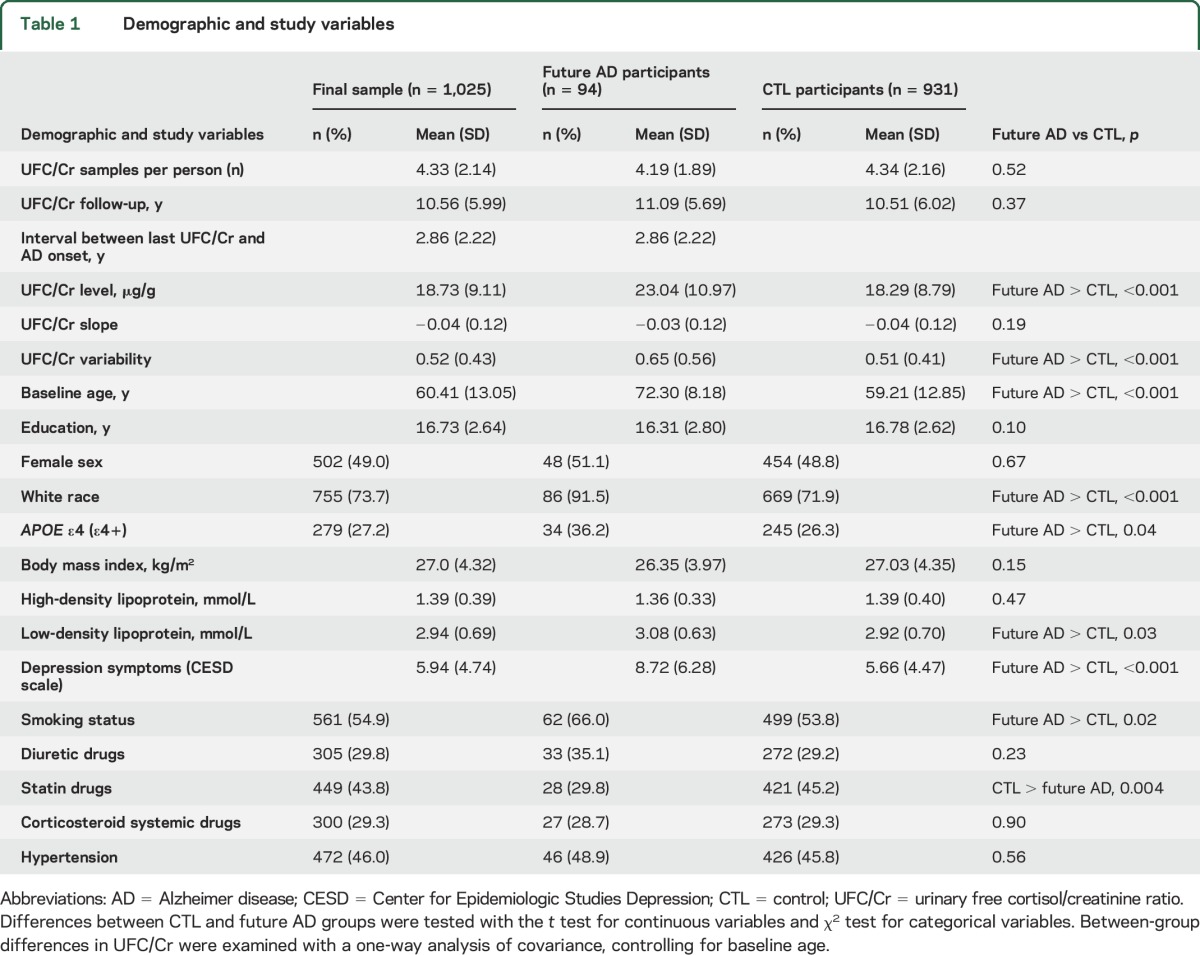
Because APOE ε4 is a known risk factor for AD and because we use APOE ε4 status in statistical models, we excluded participants who did not have APOE ε4 data (n = 73; future AD = 4, controls = 69). There were no significant differences in UFC/Cr level [t(1,096) = 1.00, p = 0.32, slope t(1,096) = 0.52, p = 0.61] and variability [t(1,096) = −0.52, p = 0.61] between the groups with and without APOE ε4 data. Exclusions resulted in a final sample of 1,025 participants, including 94 future AD (total number of cortisol samples = 4,435; see table 1 for descriptive statistics).
Table 1.
Demographic and study variables
Measures.
UFC/Cr ratio.
A UFC/Cr ratio was calculated to account for samples missing collection duration or volume and to control for age-related differences in kidney filtration, a practice consistent with prior studies.12 The correlation between total 24-hour UFC (μg/24 h) and the UFC/Cr ratio was r = 0.81 (p < 0.001). UFC/Cr level, slope, and variability were calculated to assess the relationship between cortisol regulation and AD risk. Level represented the within-person UFC/Cr mean; slope, the within-individual rate of change; and variability, the within-person UFC/Cr coefficient of variation. UFC/Cr level, slope, and variability were calculated for all participants who had ≥2 UFC/Cr values. UFC/Cr slope was estimated with a linear mixed model (SAS version 9.2, SAS Institute Inc, Cary, NC) and represented the change in 24-hour cortisol output over years, not the diurnal rhythm across the day. Within-person UFC/Cr variability was calculated with a previously used method: UFC/Cr variability = antilog (within-person SD on the log scale) − 1.13
Covariates.
Variables previously found to be related to cortisol and AD were included as covariates in Cox regression analyses. These included sex, race (white or nonwhite), education, smoking status (never or ever smoked), body mass index (BMI), low-density lipoprotein (LDL), high-density lipoprotein, hypertension (never or ever diagnosed), statins (never or ever taken), systemic corticosteroids (never or ever taken), diuretics (never or ever taken), and symptoms of depression measured with the Center for Epidemiologic Studies Depression Scale.14 Continuous covariates represented averages from all visits to collect cortisol. Categorical covariates indicated whether the attribute was ever reported during a visit. APOE ε4 was also entered as a covariate in the investigations of UFC/Cr measures as predictors of AD risk. Carrier status was defined as having 1 or 2 ε4 alleles. Noncarrier status was defined as having no ε4 alleles.
Procedure.
Participants traveled biennially to the National Institute on Aging for comprehensive medical, physiologic, and neuropsychological evaluations. Participants submitted 24-hour urine specimens according to a standardized protocol that instructed participants to discard their first morning specimen and to collect all urine for the next 24 hours into containers provided to them. The samples were labeled with subject code, date, time, total urine volume, and duration of collection. Subsequently, multiple 20-mL samples of urine were divided into aliquots and frozen and stored in the BLSA specimen bank. UFC and Cr were then measured from these aliquots. Steroid hormones remain stable in frozen plasma and urine even when specimens have been stored for >10 years.15
UFC was extracted by nonpolar solvents and then measured with liquid chromatography and mass spectrometry. All analyses were performed by Esoterix, Inc. Interassay coefficients of variation for mean UFC values of 0.05, 2.84, 5.53, and 9.41 μg/dL were 13.4%, 6.6%, 4.4%, and 5.3%, respectively. Interassay coefficients of variation for Cr mean values of 66.6 and 145.8 ng/mL were 1.5% and 1.1%, respectively.
Standard protocol approvals, registrations, and patient consents.
The BLSA was approved by the National Institutes of Health Institutional Review Board. Analysis of study data was approved by the Georgia Institute of Technology Institutional Review Board. Individuals were inpatients and provided informed consent at each of their individual BLSA study site visits in Baltimore, MD.
Cognitive status.
Clinical and neuropsychological data from BLSA participants were reviewed at a consensus conference if they screened positive on the Blessed Information Memory Concentration score (score ≥4),16 if their Clinical Dementia Rating score was ≥0.5 from subject or informant report,17 or if concerns were raised about their cognitive status. In addition, all participants were evaluated by case conference on death or withdrawal. Selection bias was reduced because all participants were evaluated similarly. Diagnoses of dementia and AD were based on the DSM-III-R18 and the National Institute of Neurologic and Communication Disorders and Stroke–Alzheimer's Disease and Related Disorders Association criteria,19 respectively. Mild cognitive impairment was based on the Petersen criteria20 and diagnosed when cognitive impairment was evident for a single domain (typically memory)16 or cognitive impairment in multiple domains occurred without significant functional loss in activities of daily living.
Statistical approach.
Differences in demographic and study variables between the future AD and control groups were examined with independent-samples t tests and Pearson χ2 tests. Between-group differences in UFC/Cr were examined with analysis of covariance, controlling for baseline age. Cox regression models were used to assess the relationship between UFC/Cr measures and AD risk. Event time was age at AD onset for AD participants, and censored time was age at death or last visit for controls. UFC/Cr measures were standardized. Continuous covariates were also standardized and represented within-person averages. Categorical covariates were coded as 0 and 1, where 0 indicated the absence of the attribute and served as the reference category in survival analyses. Each UFC/Cr measure was analyzed in unadjusted and adjusted models. Backward elimination using likelihood ratio statistics was used to select the final adjusted model. Participants with missing data (0.3% of total) were dropped from the analyses. Significant UFC/Cr measures were then subjected to a sensitivity analysis to determine whether UFC/Cr collected ≥2 and ≥5 years before AD onset would predict AD risk. Covariates from the final adjusted model were also controlled for in this analysis. Statistical analyses were performed with IBM SPSS version 19.
RESULTS
Between-group differences in UFC/Cr.
With baseline age controlled for, the future AD group had significantly higher UFC/Cr level (F1, 1,022 = 23.29, p < 0.001) and UFC/Cr variability (F1, 1,022 = 12.65, p < 0.001) than the control group (figure). There was no significant difference between groups in UFC/Cr slope (F1, 1,022 = 1.71, p = 0.19).
Figure. Differences in UFC/Cr level (A) and variability (B) between control and future participants with AD controlling for baseline age.
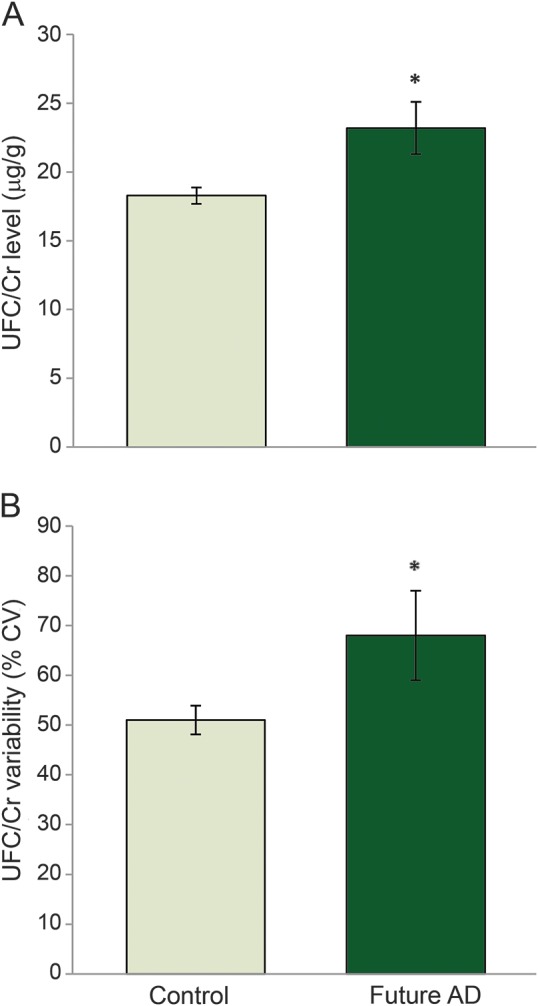
*p < 0.05; error bars represent 95% confidence intervals.AD = Alzheimer disease; CV = coefficient of variation; UFC/Cr = urinary free cortisol/creatinine.
Relationship of UFC/Cr to AD risk.
Separate Cox regressions were conducted with each UFC/Cr measure (level, slope, and variability) to investigate the relationship between cortisol regulation and AD risk (event = 94; censored = 804 for unadjusted models and 801 for adjusted models).
UFC/Cr level.
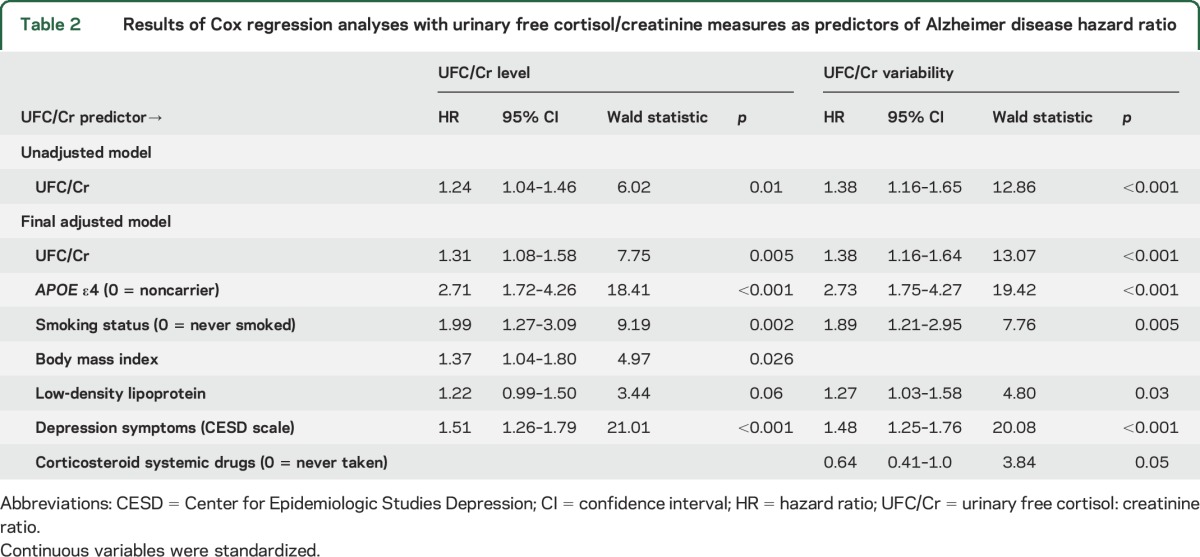
In the unadjusted model, higher UFC/Cr level was significantly related to greater AD risk a with hazard ratio (HR) of 1.24 (table 2). Elevated UFC/Cr level was also a significant predictor of AD risk in the final adjusted model that controlled for APOE ε4 carrier status, smoking status, BMI, LDL, and depression symptoms. Every SD increase in UFC/Cr level was related to a 1.31-times increase in risk for AD (table 2). APOE ε4, BMI, smoking status, and depression symptoms were also significant predictors of AD risk. Being an APOE ε4 carrier, having increased BMI and depression symptoms on average over the study period, and ever having smoked were associated with increased hazard for AD.
Table 2.
Results of Cox regression analyses with urinary free cortisol/creatinine measures as predictors of Alzheimer disease hazard ratio
UFC/Cr slope.
UFC/Cr slope was not significantly associated with AD risk in the unadjusted (Wald = 0.40, p = 0.53, HR = 1.05, 95% confidence interval [CI] = 0.90–1.23) or adjusted (Wald = 0.81, p = 0.37, HR = 1.09, 95% CI = 0.90–1.32) model.
UFC/Cr variability.
In the unadjusted model, higher UFC/Cr variability was significantly related to greater AD risk with an HR of 1.38 (table 2). Increased UFC/Cr variability was also a significant predictor of AD risk in the final adjusted model that controlled for APOE ε4 carrier status, smoking status, LDL, systemic corticosteroid use, and depression symptoms. Every SD increase in UFC/Cr variability was related to a 1.38-times increase in AD risk (table 2). APOE ε4, smoking status, LDL, and depression symptoms were significant predictors of AD risk. Being an APOE ε4 carrier, ever having smoked, and having increased LDL and depression symptoms on average over the study period were associated with increased risk for AD.
Sensitivity analysis.
Using measures ≥2 years before AD onset.
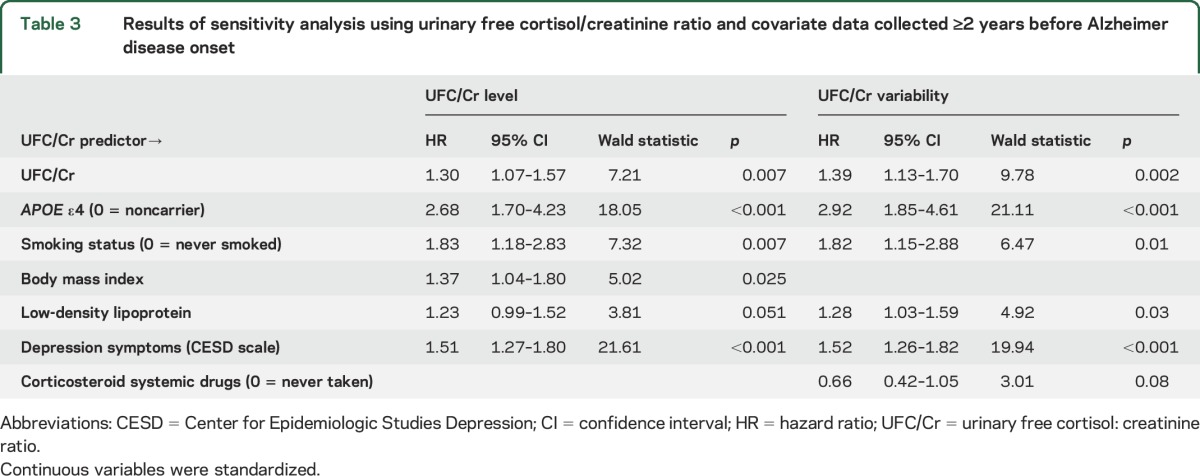
The average number of years between the last visit and year of AD onset was 3.8 for UFC/Cr level and 3.6 for UFC/Cr variability. These numbers and the event number (see below) differ for level and variability analyses because we included participants with only one UFC/Cr measure to calculate UFC/Cr level. This approach helped to maintain consistency with the final sample and was followed for all sensitivity analyses. Higher UFC/Cr level and higher UFC/Cr variability significantly predicted greater AD risk when controlling for final model covariates (UFC/Cr level: event = 94, censored = 801; UFC/Cr variability: event = 88, censored = 801, table 3). Every SD increase in UFC/Cr level and UFC/Cr variability was related to a 1.30- and 1.39-times increase in AD risk, respectively (table 3).
Table 3.
Results of sensitivity analysis using urinary free cortisol/creatinine ratio and covariate data collected ≥2 years before Alzheimer disease onset
Using measures ≥5 years before AD onset.
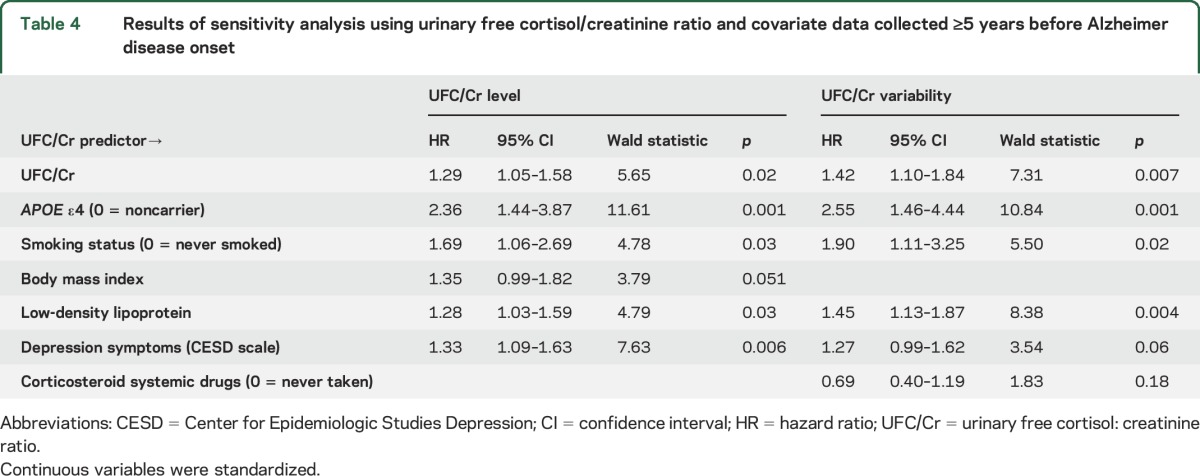
The average number of years between the last visit and year of AD onset was 6.3 for UFC/Cr level and 6.1 for UFC/Cr variability. Higher UFC/Cr level and higher UFC/Cr variability significantly predicted greater AD risk when controlling for final model covariates (UFC/Cr level: event = 80, censored = 801; UFC/Cr variability: event = 62, censored = 801, table 4). Every SD increase in UFC/Cr level and UFC/Cr variability was related to a 1.29- and 1.42-times increase in AD risk, respectively (table 4).
Table 4.
Results of sensitivity analysis using urinary free cortisol/creatinine ratio and covariate data collected ≥5 years before Alzheimer disease onset
DISCUSSION
The present study found that long-term exposure to and fluctuation in UFC are associated with risk of AD. High UFC/Cr level and high UFC/Cr variability increased the risk for AD by a factor of 1.31 and 1.38, respectively. The significant relationship between these 2 UFC/Cr measures and AD risk was maintained when using UFC/Cr data collected ≥5 years before AD onset and when controlling for well-known AD risk factors such as APOE ε4 and depression symptoms.
Elevated cortisol may affect age-related cognitive and brain changes and possibly facilitate the development of AD. In middle-aged adults, cortisol increases have been related to worse executive functioning21 and decreased prefrontal cortical volume22; in older adults without dementia, increases have been related to impaired episodic memory and hippocampal atrophy.23,24 Glucocorticoid treatment in rodent models of AD has been associated with increased Aβ plaques and tau phosphorylation.7,8 Elevated cortisol has been related to hippocampal atrophy6 and cognitive decline in patients with AD4,6 and brain Aβ deposition in cognitively normal and older adults with AD.10 Results from these studies in conjunction with the present data suggest that elevated cortisol may play a role in AD pathogenesis. Our cortisol measures in the sensitivity analysis preceded AD onset by 6 years on average, a time period within the preclinical phase of disease when AD pathology is likely evident.25 Thus, cortisol may play a role in modifying the downstream clinical expression of underlying AD pathology.
UFC/Cr variability also predicted AD risk. Participants whose UFC/Cr output fluctuated over time were at greater risk for AD than those with stable output. Intraindividual variability in certain parameters, independent of average levels, has been found to predict disease development.26,27 Increased intraindividual variability in cognitive performance has been shown to presage cognitive decline28 and dementia29 and is thought to reflect age-related changes in neural structure.30 Congruent with these studies, our findings support the value of examining variability in physiologic measures as predictors of dementia.
The hippocampus, which is affected in the early stages of AD,31 plays an important role in cortisol regulation, inhibiting the hypothalamic-pituitary-adrenal axis after stressor-induced cortisol elevations,32 allowing cortisol increases after psychosocial stress,33 and controlling the cortisol awakening response.34 Early pathology in the hippocampus before AD onset could alter cortisol regulation, resulting in unstable cortisol output and high cortisol variability. Conversely, unstable cortisol fluctuations over time may also influence the health of the hippocampus, a glucocorticoid-rich subcortical region. Increased cortisol variability and level could result from psychological distress.35,36 Neuroticism, which is characterized as a tendency to experience psychological distress, has been shown to be a risk factor for AD.37 We speculate that cortisol level or variability could be a mediator of the influence of neuroticism on AD risk.
The only prospective study of which we are aware, the Rotterdam Study, did not find a relationship between cortisol and AD risk.11 Differences in cortisol collection methods could explain this discrepancy. Schrijvers et al.11 collected one cortisol measure at baseline, whereas we collected multiple measures, each representing total cortisol output per day, thus allowing examination of the relationship between average cortisol exposure over time and AD risk.
Consistent with previous reports,1,2,4,5 the future AD group had a higher UFC/Cr level than controls. The future AD group also had higher UFC/Cr variability than controls. There was no difference in UFC/Cr slope between the future AD and control groups, and UFC/Cr slope was not predictive of AD hazard. The pattern of change in UFC/Cr over time may have been complex and not adequately described by a linear UFC/Cr slope. Consistent with the well-established association between APOE ε4 and AD,38 APOE ε4 carriers had greater risk for AD relative to noncarriers, suggesting that our sample was representative.
There are several limitations to the present study. Use of 24-hour UFC provides a good measure of total daily cortisol production and excretion but obscures the cortisol circadian rhythm, which may be an important biomarker.39 CSF free cortisol, although difficult to collect in large longitudinal studies, would have provided an alternative measure of centrally active glucocorticoids. Few studies have correlated UFC to CSF cortisol, with one reporting a strong correlation (r = 0.64, p < 0.01).40
We found significant relationships between UFC/Cr measures and AD risk using data for which the last cortisol collection occurred on average from 2.9 to 6 years before AD onset. Because AD has a prolonged prodromal period, it is difficult to distinguish causative factors from prodromal changes. The use of AD onset rather than diagnosis in our study excludes data collected during the immediate prodromal period but includes data collected during the preclinical phase of AD, when pathology may already be evident. Because the hippocampus plays a role in corticosteroid regulation via negative feedback to the hypothalamus and is affected by AD, it is possible that cortisol production may contribute to AD pathology and in turn be influenced by the development of AD.
In this study, high UFC/Cr level and high UFC/Cr variability were related to increased AD risk. Cortisol dysregulation may influence the expression of AD pathology or be a preclinical marker of AD.
GLOSSARY
- Aβ
β-amyloid
- AD
Alzheimer disease
- BLSA
Baltimore Longitudinal Study of Aging
- BMI
body mass index
- CI
confidence interval
- CR
creatinine
- DSM-III-R
Diagnostic and Statistical Manual of Mental Disorders, Third Edition, Revised
- HR
hazard ratio
- LDL
low-density lipoprotein
- UFC
urinary free cortisol
AUTHOR CONTRIBUTIONS
Gilda E. Ennis drafted the manuscript and analyzed and interpreted study data. Yang An analyzed and interpreted study data and reviewed the content of the manuscript. Susan M. Resnick contributed to the study concept and design and the writing of the manuscript. Luigi Ferrucci contributed to the study concept and design and reviewed the manuscript. Richard J. O'Brien was responsible for the diagnosis of AD onset, a major study variable, and reviewed the manuscript. Scott D. Moffat contributed to the study concept and design, analysis, and writing of the manuscript and is principal investigator on the grant that funded the research.
STUDY FUNDING
This research was supported by a grant from the National Institute on Aging of the NIH (R01-AG028466; Scott D. Moffat, principal investigator) and a Ruth L. Kirschstein Public Health Service training grant (T32 AG000175). This study was also supported in part by the Intramural Research Program, National Institute on Aging, NIH.
DISCLOSURE
G. Ennis was supported by a Ruth L. Kirschstein PHS training grant (T32 AG000175). She reports no other disclosures. Y. An, S. Resnick, L. Ferrucci, R. O'Brien, and S. Moffat report no disclosures relevant to the manuscript. Go to Neurology.org for full disclosures.
REFERENCES
- 1.Armanini D, Vecchio F, Basso A, et al. Alzheimer's disease: pathophysiological implications of measurement of plasma cortisol, plasma dehydroepiandrosterone sulfate, and lymphocytic corticosteroid receptors. Endocrine 2003;22:113–118. [DOI] [PubMed] [Google Scholar]
- 2.Giubilei F, Patacchioli FR, Antonini G, et al. Altered circadian cortisol secretion in Alzheimer's disease: clinical and neuroradiological aspects. J Neurosci Res 2001;66:262–265. [DOI] [PubMed] [Google Scholar]
- 3.Näsman B, Olsson T, Fagerlund M, Eriksson S, Viitanen M, Carlström K. Blunted adrenocorticotropin and increased adrenal steroid response to human corticotropin-releasing hormone in Alzheimer's disease. Biol Psychiatry 1996;39:311–318. [DOI] [PubMed] [Google Scholar]
- 4.Umegaki H, Ikari H, Nakahata H, et al. Plasma cortisol levels in elderly female subjects with Alzheimer's disease: a cross-sectional and longitudinal study. Brain Res 2000;881:241–243. [DOI] [PubMed] [Google Scholar]
- 5.Weiner M, Vobach S, Olsson K, Svetlik D, Risser RC. Cortisol secretion and Alzheimer's disease progression. Biol Psychiatry 1997;42:1030–1038. [DOI] [PubMed] [Google Scholar]
- 6.Huang CW, Lui CC, Chang WN, Lu CH, Wang YL, Chang CC. Elevated basal cortisol level predicts lower hippocampal volume and cognitive decline in Alzheimer's disease. J Clin Neurosci 2009;16:1283–1286. [DOI] [PubMed] [Google Scholar]
- 7.Dong H, Csernansky JG. Effects of stress and stress hormones on amyloid-beta protein and plaque deposition. J Alzheimers Dis 2009;18:459–469. [DOI] [PMC free article] [PubMed] [Google Scholar]
- 8.Rothman SM, Mattson MP. Adverse stress, hippocampal networks, and Alzheimer's disease. Neuromolecular Med 2010;12:56–70. [DOI] [PMC free article] [PubMed] [Google Scholar]
- 9.Kulstad JJ, McMillan PJ, Leverenz JB, et al. Effects of chronic glucocorticoid administration on insulin-degrading enzyme and amyloid-beta peptide in the aged macaque. J Neuropathol Exp Neurol 2005;64:139–146. [DOI] [PubMed] [Google Scholar]
- 10.Toledo JB, Toledo E, Weiner MW, et al. Cardiovascular risk factors, cortisol, and amyloid-beta deposition in Alzheimer's Disease Neuroimaging Initiative. Alzheimers Dement 2012;8:483–489. [DOI] [PMC free article] [PubMed] [Google Scholar]
- 11.Schrijvers EM, Direk N, Koudstaal PJ, et al. Associations of serum cortisol with cognitive function and dementia: the Rotterdam Study. J Alzheimers Dis 2011;25:671–677. [DOI] [PubMed] [Google Scholar]
- 12.Seeman T, McEwen BS, Singer BH, Albert MS, Rowe JW. Increase in urinary cortisol excretion and memory declines: MacArthur studies of successful aging. J Clin Endocrinol Metab 1997;82:2458–2465. [DOI] [PubMed] [Google Scholar]
- 13.Petersenn S, Newell-Price J, Findling JW, et al. High variability in baseline urinary free cortisol values in patients with Cushing's disease. Clin Endocrinol (Oxf) 2014;80:261–269. [DOI] [PMC free article] [PubMed] [Google Scholar]
- 14.Radloff LS. The CES-D scale: a self report depression scale for research in the general population. Appl Psychol Meas 1977;1:385–401. [Google Scholar]
- 15.Kley HK, Schlaghecke R, Kruskemper HL. Stability of steroids in plasma over a 10-year period. J Clin Chem Clin Biochem 1985;23:875–878. [PubMed] [Google Scholar]
- 16.Fuld PA, editor. Psychological Testing in the Differential Diagnosis of the Dementias. Alzheimer's Disease: Senile Dementia and Related Disorders. New York: Raven Press; 1978. [Google Scholar]
- 17.Morris JC. The clinical dementia rating (CDR): current version and scoring rules. Neurology 1993;43:2412–2414. [DOI] [PubMed] [Google Scholar]
- 18.Diagnostic and Statistical Manual of Mental Disorders (DSM-III-R). Washington, DC: American Psychiatric Association; 1987. [Google Scholar]
- 19.McKhann G, Drachman D, Folstein M, Katzman R, Price D, Stadlan EM. Clinical diagnosis of Alzheimer's disease: report of the NINCDS-ADRDA Work Group under the auspices of Department of Health and Human Services Task Force on Alzheimer's Disease. Neurology 1984;34:939–944. [DOI] [PubMed] [Google Scholar]
- 20.Petersen RC, Smith GE, Waring SC, Ivnik RJ, Tangalos EG, Kokmen E. Mild cognitive impairment: clinical characterization and outcome. Arch Neurol 1999;56:303–308. [DOI] [PubMed] [Google Scholar]
- 21.Franz CE, O'Brien RC, Hauger RL, et al. Cross-sectional and 35-year longitudinal assessment of salivary cortisol and cognitive functioning: the Vietnam Era Twin Study of Aging. Psychoneuroendocrinology 2011;36:1040–1052. [DOI] [PMC free article] [PubMed] [Google Scholar]
- 22.Kremen WS, O'Brien RC, Panizzon MS, et al. Salivary cortisol and prefrontal cortical thickness in middle-aged men: a twin study. Neuroimage 2010;53:1093–1102. [DOI] [PMC free article] [PubMed] [Google Scholar]
- 23.Lupien S, Lecours AR, Lussier I, Schwartz G, Nair NPV, Meaney M. Basal cortisol levels and cognitive deficits in human aging. J Neurosci 1994;14:2893–2903. [DOI] [PMC free article] [PubMed] [Google Scholar]
- 24.Lupien SJ, De Leon M, De Santi S, et al. Cortisol levels during human aging predict hippocampal atrophy and memory deficits. Nat Neurosci 1998;1:69–73. [DOI] [PubMed] [Google Scholar]
- 25.Morris JC. Early-stage and preclinical Alzheimer disease. Alzheimer Dis Assoc Disord 2005:163–165. [DOI] [PubMed] [Google Scholar]
- 26.Kikuya M, Hozawa A, Ohokubo T, et al. Prognostic significance of blood pressure and heart rate variabilities: the Ohasama Study. Hypertension 2000;36:901–906. [DOI] [PubMed] [Google Scholar]
- 27.Lattanzi S, Luzzi S, Provinciali L, Silvestrini M. Blood pressure variability predicts cognitive decline in Alzheimer's disease patients. Neurobiol Aging 2014;35:2282–2287. [DOI] [PubMed] [Google Scholar]
- 28.Bielak AA, Hultsch DF, Strauss E, Macdonald SW, Hunter MA. Intraindividual variability in reaction time predicts cognitive outcomes 5 years later. Neuropsychology 2010;24:731–741. [DOI] [PubMed] [Google Scholar]
- 29.Holtzer R, Verghese J, Wang C, Hall CB, Lipton RB. Within-person across-neuropsychological test variability and incident dementia. JAMA 2008;300:823–830. [DOI] [PMC free article] [PubMed] [Google Scholar]
- 30.MacDonald SW, Li SC, Backman L. Neural underpinnings of within-person variability in cognitive functioning. Psychol Aging 2009;24:792–808. [DOI] [PubMed] [Google Scholar]
- 31.Scheff SW, Price DA. Alzheimer's disease-related alterations in synaptic density: neocortex and hippocampus. J Alzheimer's Dis 2006;9:101–115. [DOI] [PubMed] [Google Scholar]
- 32.Lupien SJ, Lepage M. Stress, memory, and the hippocampus: can't live with it, can't live without it. Behav Brain Res 2001;127:137–158. [DOI] [PubMed] [Google Scholar]
- 33.Buchanan TW, Tranel D, Kirschbaum C. Hippocampal damage abolishes the cortisol response to psychosocial stress in humans. Horm Behav 2009;56:44–50. [DOI] [PMC free article] [PubMed] [Google Scholar]
- 34.Buchanan TW, Kern S, Allen JS, Tranel D, Kirschbaum C. Circadian regulation of cortisol after hippocampal damage in humans. Biol Psychiatry 2004;56:651–656. [DOI] [PubMed] [Google Scholar]
- 35.Mikolajczak M, Roy E, Luminet O, Fillée C, de Timary P. The moderating impact of emotional intelligence on free cortisol responses to stress. Psychoneuroendocrinology 2007;32:1000–1012. [DOI] [PubMed] [Google Scholar]
- 36.Garcia-Banda G, Chellew K, Fornes J, Perez G, Servera M, Evans P. Neuroticism and cortisol: pinning down an expected effect. Int J Psychophysiology 2014;91:132–138. [DOI] [PubMed] [Google Scholar]
- 37.Wilson RS, Evans DA, Bienias JL, de Leon CFM, Schneider JA, Bennett DA. Proneness to psychological distress is associated with risk of Alzheimer's disease. Neurology 2003;61:1479–1485. [DOI] [PubMed] [Google Scholar]
- 38.Saunders AM, Strittmatter WJ, Schmechel D, et al. Association of apolipoprotein E allele 4 with late-onset familial and sporadic Alzheimer's disease. Neurology 1993;43:1467–1472. [DOI] [PubMed] [Google Scholar]
- 39.Deuschle M, Schweiger U, Weber B, et al. Diurnal activity and pulsatility of the hypothalamus-pituitary-adrenal system in male depressed patients and healthy controls. J Clin Endocrinol Metab 1997;82:234–238. [DOI] [PubMed] [Google Scholar]
- 40.Carroll BJ, Curtis GC, Mendels J. Cerebrospinal fluid and plasma free cortisol concentrations in depression. Psychol Med 1976;6:235–244. [DOI] [PubMed] [Google Scholar]