Abstract
Purpose
Multislice maps of extracellular pH (pHe) are needed to interrogate the heterogeneities of tumors and normal organs. To address this need, we have developed a multislice acidoCEST MRI acquisition method with a CEST spectrum fitting method that measures in vivo pHe over a range of 6.3 to 7.4.
Methods
The Phase Offset MultiPlanar (POMP) method was adapted for CEST-FISP MRI to acquire multiple image slices with a single CEST saturation pulse. The Bloch-McConnell equations were modified to include pH based on a calibration of pH and chemical exchange rate for the contrast agent, iopamidol. These equations were used to estimate the pixelwise pHe values throughout the multislice acidoCEST MR images of the tumor, kidney, bladder and other tissues of a MDA-MB-231 tumor model.
Results
Multislice acidoCEST MRI successfully mapped a gradient of pHe from 6.73 to 6.81 units from the tumor core to rim, and mapped a gradient of pHe 6.56 to 6.97 across the mouse kidney. The bladder was found to be pHe 6.3.
Conclusion
AcidoCEST MRI with POMP acquisition and Bloch-McConnel analysis can map pHe in multiple imaging slices through the tumor, kidney, and bladder. This multislice evaluation facilitates assessments of spatial heterogeneity of tissue pHe.
Keywords: CEST MRI, tumor pH, iopamidol, CEST-FISP, POMP MRI, Multiband MRI
Introduction
Extracellular acidosis is a hallmark of many cancer types that employ glycolytic metabolism to produce excess lactic acid, known as the Warburg effect (1,2). Recent studies have used Chemical Exchange Saturation Transfer (CEST) MRI to measure the extracellular pH (pHe) in tumor tissues in mouse models of human cancers (3). Known as acidoCEST MRI, this method administers an exogenous agent to the mouse model via i.v. injection, then detects the two CEST signals of the agent, and then uses the ratio of the two CEST signal amplitudes to determine the pHe value of the tissue (Fig. 1). Importantly, the ratio of the two CEST signals is not dependent on concentration, T1 relaxation time, or variable saturation power, which improves the accuracy of an in vivo pHe measurement (4). AcidoCEST MRI has been used to show that acidic tumors have a faster growth rate (5), and are associated with higher expression levels of carbonic anhydrase (6), so that acidoCEST MRI can improve initial diagnoses and prognostications of the tumor. AcidoCEST MRI has also been used to track the early metabolic response to chemotherapy in a mouse model of human breast cancer, which shows that this imaging method may impact the choice of personalized medicine for each individual patient (7). AcidoCEST MRI has also been used to show a correlation between pHe and lesion size in a lung fibrosis model, demonstrating that acidoCEST MRI has potential to assess other pathologies in addition to solid tumors (8).
Figure 1.
The pH dependence of CEST from iopamidol. The CEST spectra of iopamidol (inset) show changes in the CEST signals at 4.2 and 5.6 ppm over a range of pH 5.82 to 7.67. These experimental results were fit with the Bloch-McConnell equations to directly determine the pH-independent rate, k0, and pH-dependent rate, kb, of chemical exchange. CEST spectra are not shown for samples at pH 6.08 and 7.42, and for the sample at 39 mM at pH 6.72.
To date, acidoCEST MRI has been limited to single slice imaging. For studies with subcutaneous or orthotopic models of human cancers, the single imaging slice is positioned to capture the largest two-dimensional profile of the tumor. However, acidoCEST MRI results have shown that this single imaging slice of the tumor has spatial heterogeneity of pHe values, and therefore pHe heterogeneity almost certainly exists in three dimensions (9,10). A multislice assessment of pHe heterogeneity may improve the diagnostic utility of acidoCEST MRI because the spatial heterogeneity of tumor pHe has been shown to be related to tumor growth rate (5). Similarly, normal organs such as the kidney are known to have spatial heterogeneity of pHe values, so that multislice acidoCEST MRI can also improve the diagnoses of these organs (11,12). From a technical perspective, multislice imaging mitigates the risk of incorrectly setting the location of a single imaging slice to visualize the tissue of interest.
We proposed to develop a multislice acidoCEST MRI method to provide greater spatial coverage of tumors and normal organs. We investigated Phase Offset MultiPlanar (POMP) imaging that can simultaneously acquire multiple image slices (13). As a major advantage, this technique can be incorporated into any MR acquisition protocol by replacing the excitation pulse with POMP pulses and by increasing the selection width of the refocusing pulse to cover the several consecutive POMP sections. We hypothesized that a POMP acidoCEST MRI protocol should be simple to develop and implement. Although the Controlled Aliasing In Parallel Imaging Results IN Higher Acceleration (CAIPIRINHA) method can also simultaneously acquire multiple image slices (14), this method requires a multichannel coil while POMP can be performed with a single channel coil. The Hadamard method can also simultaneously acquire multislice images (15), but this method suffers from motion artifacts and increased total imaging time, and requires pre-processing with an inverse Hadamard transform prior to image processing.
As an additional limitation, current acidoCEST MRI methods have been limited to measuring an in vivo pHe range of 6.3 to 7.0 (16). The CEST signal at 5.6 ppm from the exogenous agent, iopamidol (Isovue®, Bracco Diagnostics USA, Monroe Township, NJ) or iopromide (Ultravist®, Bayer Healthcare LLC, Whippany, NJ), is generated by an aryl amide proton with a fast chemical exchange rate. Because the chemical exchange of an amide proton is base-catalyzed, the exchange rate of this amide proton becomes too fast to generate strong CEST signals at high pH (Fig. 1). The CEST signal from this amide proton is too weak to reliably detect during in vivo studies when pHe is greater than 7.0, and therefore the ratio of two CEST signals cannot be obtained to measure pHe values above 7.0. To account for this problem, we have assigned pixels within in vivo pHe maps as being “above pHe 7.0” when the agent’s CEST signal at 4.2 ppm can only be detected with statistical significance (6,7). However, measuring a larger range of pHe values would certainly improve the utility of acidoCEST MRI for diagnosing tumors and normal organs.
To address this problem, we proposed to measure tumor pHe solely using the CEST signal at 4.2 ppm from the exogenous agent. The amide proton at this chemical shift has a moderate chemical exchange rate, which remains sufficiently slow at higher pH to generate a strong CEST signal at values higher than pH 7.0. We investigated the fitting of the Bloch equations modified for chemical exchange (also known as the Bloch-McConnell equations) to a CEST spectrum that contains the CEST signal at 4.2 ppm (Fig. 1) (17,18). We hypothesized that this analysis approach would expand the measurement range of acidoCEST MRI to pH 7.4. We incorporated a calibration between pH and chemical exchange rate into the Bloch McConnell equations so that our fitting method could directly estimate the pHe value while also simultaneously estimating the concentration of the agent in the in vivo tissue, the endogenous T1 relaxation time of the in vivo tissue, and saturation power. We investigated if these parameter estimates are correlated during the fitting process, to determine if pHe can still be accurately measured by acidoCEST MRI without dependence on these other characteristics.
Methods
Simulations of acidoCEST MRI
To determine the co-dependence of pH estimates on other experimental conditions, CEST spectra were simulated with values of 0.2, 0.4, 0.6, 0.8 and 1.0 seconds for the T1 relaxation time constant of the sample; a sample concentration of 8, 16, 24, 32, and 40 mM; a B0 shift of −1, −0.5, 0, 0.5, and 1 ppm; B1 strengths of 80%, 100%, and 120%; and pH values of 6 to 8 in increments of 0.05 pH units. The pH values were also simulated at values of 5.82, 6.08, 6.47, 6.72, 6.93, 7.42, and 7.67 at 78 mM, and at pH 6.72 at 39 mM, to compare simulated and experimental results. The default parameters for these simulations were set to 10 mM concentration; 1 second T1 time; 0 ppm B0 shift; and 100% B1 strength. The same saturation time, power, and frequency array used for in vivo analysis were used for these simulations.
Modification of the Bloch-McConnell equations
The Bloch-McConnell equations were modified to include pH as a parameter, and these modified equations were used to fit CEST spectra to directly estimate pH. The chemical exchange rate, kex, consists of a pH-independent rate, k0, and a base-catalyzed exchange rate, kb, for an amide hydrogen atom of the contrast agent (the acid-catalyzed exchange rate, ka, is relatively negligible for an amide group; Eq. [1]) (19).
| [1] |
The right side of Eq. [1] was substituted into the Bloch-McConnell equations. The values of k0 and kb were determined by measuring kex of chemical solutions of the agent over a range of pH values, and fitting Eq. [1] to the experimental results using a non-linear least squares fitting method. Phantoms of iopamidol were prepared at 78 mM at pH values of 5.82, 6.08, 6.47, 6.72, 6.93, 7.42 and 7.67. An additional phantom was prepared at 39 mM with a pH value of 6.72 to ensure that the calibration was independent of concentration. These chemical solutions were maintained at 37.0±0.5°C degrees with warm air with a 600 MHZ vertical bore NMR spectrometer (Bruker Biospin, Inc., Billerica, MA). CEST spectra were obtained using an ultrafast CEST MRI technique (20). The effects of diffusion were mitigated by collecting portions of CEST spectra from −7.5 ppm to 0 ppm, −2.5 to 5 ppm, and 2.5 ppm to 10 ppm, with overlapping ranges to confirm that the contrast from these samples did not change between experiments. An increment of 0.03 ppm was used for each range of saturation frequencies.
POMP acidoCEST MRI of phantoms
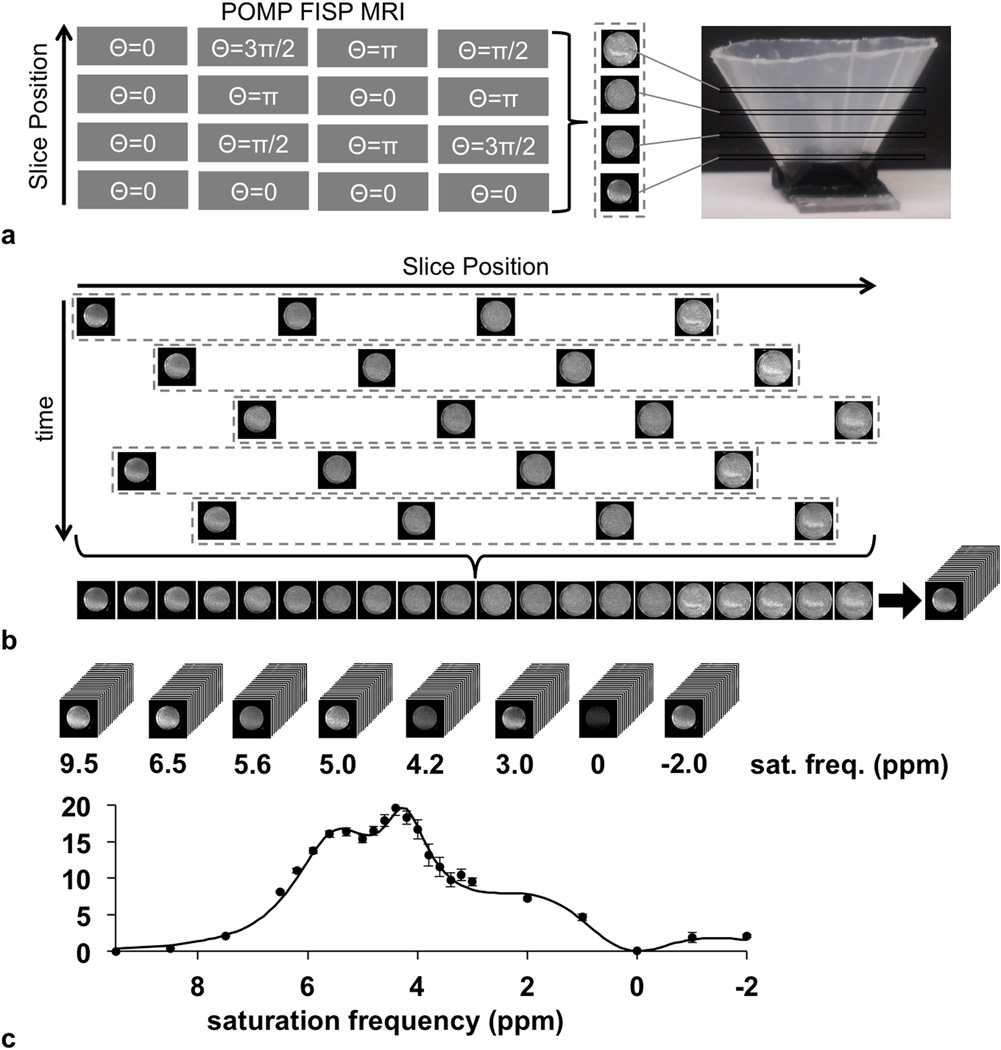
To develop a POMP acidoCEST MRI protocol, we created a phantom container by gluing a polyethylene conical funnel (Fisher Scientific, Inc.) to a plexiglass platform, and we filled the container with 78 mM iopamidol (Isovue®, Bracco Diagnostics USA, Monroe Township, NJ) at pH 6.80. We placed the phantom in a 7T Biospec MRI scanner with a 72 mm-diameter quadrature transceiver coil (Bruker Biospin, Inc., Billerica, MA), and maintained the temperature of the phantom at 37.0±0.5°C using warm air (SA Instruments, Stony Brook, NY). MR images were acquired using a CEST-FISP protocol with POMP acquisition. The FISP acquisition used a 4.68 msec TR; 2.34 msec TE; 30° excitation angle; 4.0 × 4.0 cm field of view; 128 × 128 matrix size; 312.5 × 312.5 µm in-plane resolution; 0.5 mm slice thickness; coronal slice orientation; centric encoding order; unbalanced “FID” mode; partial k-space acceleration of 6/8, 1/8 zero fill acceleration; 580 msec scan time (21). Multiband excitation pulses were designed by adding 4 hermite pulses, each with a bandwidth factor of 5.4 (4,700 Hz or 15.6 ppm) that exceeded the chemical shifts of the contrast agent at 5.6 and 4.2 ppm. These hermite pulses were frequency modulated to produce a gap of 4 times the individual slice bandwidth between the edges of each slice, which generated four slices per acquisition (Fig. 2a) (13). The simultaneous acquisition of these four slices was repeated five times to generate a total of 20 image slices (Fig. 2b). The acquisition of these slices was interleaved to avoid artifacts (22). These 20 image slices were acquired at one CEST saturation frequency, and then the saturation frequency was iterated to acquire subsequent sets of 20 image slices (Fig. 2c). CEST saturation consisted of a 2 second continuous wave radio frequency pulse at 3.0 µT saturation power with no additional spoiling or fat saturation pulses, at 24 saturation frequency offsets of −2, −1, −0, 1, 2, 3, 3.2, 3.4, 3.6, 3.8, 4.0, 4.2, 4.4, 4.6, 4.8, 5.0, 5.3, 5.6, 5.9, 6.2, 6.5, 7.5, 8.5, and 9.5 ppm. The acquisition time to acquire this CEST spectrum was 7:28 min. We refer to the entire set of 480 images as one acidoCEST MR image set.
Figure 2.
The CEST-FISP MRI protocol with a POMP acquisition scheme. a: The schematic of the pulse sequence shows that the slice phase is modulated to alias the four slices in the image. Centric encoding allows the acquisition of the center of k-space immediately after presaturation to obtain maximum CEST contrast. b: 20 slices are acquired through five repetitions of the CEST-FISP-POMP protocol. The slice acquisitions are interleaved to mitigate saturation of iopamidol in neighboring slices. c: A stack of CEST MR images is acquired at each saturation frequency, which is then used to create CEST spectra of each pixel in each slice.
Phantoms of iopamidol were tested to verify that the POMP acidoCEST MRI protocol described above can accurately and precisely measure pH in a concentration-independent manner. These phantoms had pH values of 6.25, 6.56, 6.71, 6.86, 7.23, and 7.32 with a concentration of 20 mM, and a pH value of 6.71 at concentrations of 5, 10, 20, 40, and 80 mM. Standard straight-wall tubes were used to test these phantoms, rather than using the cone phantom.
POMP acidoCEST MRI of a mouse model
In vivo imaging studies were performed to image a mouse model of MDA-MB-231 human mammary carcinoma that otherwise had a normal kidney and bladder. All studies were conducted with the approval of the Institutional Animal Care and Use Committee (IACUC) of the University of Arizona. To prepare the tumor, 107 cells were injected in the right rear flank of a 7 week old, athymic nude female mouse. The tumor reached a size of 183 mm3 at three weeks after cell injection. To prepare for MRI, the mouse was anesthetized with 1.5–2.0% isoflurane in O2 carrier gas, a 26 g catheter was inserted into the tail vein, and the mouse was secured to a customized cradle. Rectal temperature and respiration were monitored, and body temperature was maintained at 37.0 ± 0.2 °C using warm air and an automated temperature feedback system (SA Instruments, Stony Brook, NY). After positioning the mouse in the magnet, the locations of the tumor, kidney and bladder were identified using a RARE spin echo MRI protocol with a 2.54 sec TR; 12.7 msec TE; 90° excitation angle; 6.0 × 3.0 cm field of view; 128 × 64 matrix; 469 × 469 µm in-plane resolution; 0.5 mm slice thickness; 20 sagittal slices; centric encoding order; 64 s scan time. Three acidoCEST MR image sets were acquired prior to injection. A 200 µL bolus of iopamidol at 300 mgI/mL concentration (788 mM) was administered i.v., followed by a 200 µL/hr infusion of iopamidol for 42 minutes. An acidoCEST MR image set was acquired after the bolus injection, at 18 minutes after injection, and at 36 minutes after injection. After MRI acquisitions were completed, the mouse was removed from the MRI magnet and allowed to recover.
All MRI studies were performed with a CEST-FISP MRI protocol modified for POMP acquisition using the same 7T Biospec MRI scanner. The CEST-FISP MRI acquisition for in vivo imaging was identical to the protocol used for phantom imaging, except that the in vivo imaging protocol used a 5.8 msec TR; 2.7 msec TE; 3.75° excitation angle; 6.0 × 8.0 cm field of view; 120 × 160 matrix; 0.5 × 0.5 mm in-plane resolution; sagittal slice orientation. The acquisition time to acquire this CEST spectrum was 5:10 min.
In vivo image analysis
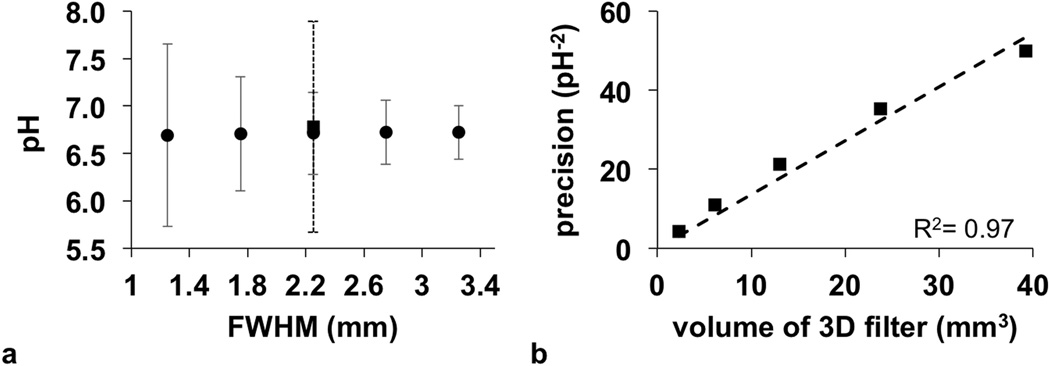
Images were denoised with a 3D Gaussian spatial filter, using Full Width at Half Maximum (FWHM) values ranging from 1.25 to 3.25 (5). A CEST spectrum for each voxel was generated by subtracting the average pre-injection image from the average post-injection image at each saturation frequency, and using the MR signal amplitude with saturation at 9.5 ppm to normalize the MR signal amplitudes at all other saturation frequencies. The CEST spectra for the voxels of the tumor were averaged, and average CEST spectra were also obtained for the kidney and bladder. These average CEST spectra were each fit with the Bloch-McConnell equations modified to directly estimate pHe to estimate the average pHe and concentration of agent in each tissue. As with all non-linear models, fitting CEST spectra with the Bloch-McConnell equations can result in local minima. We mitigated this issue by using an initial guess of 7.3 for pHe and 0 for concentration. After estimating average values for tumor, kidney and bladder, these estimated average values were used as initial guesses when fitting the pH-modified Bloch-McConnell equations to the CEST spectrum of each individual voxel of the kidney, tumor, and bladder. However, when evaluating the bladder, we used an initial guess of 6.0 pH units and the maximum concentration was increased to 1000 mM during the fitting process.
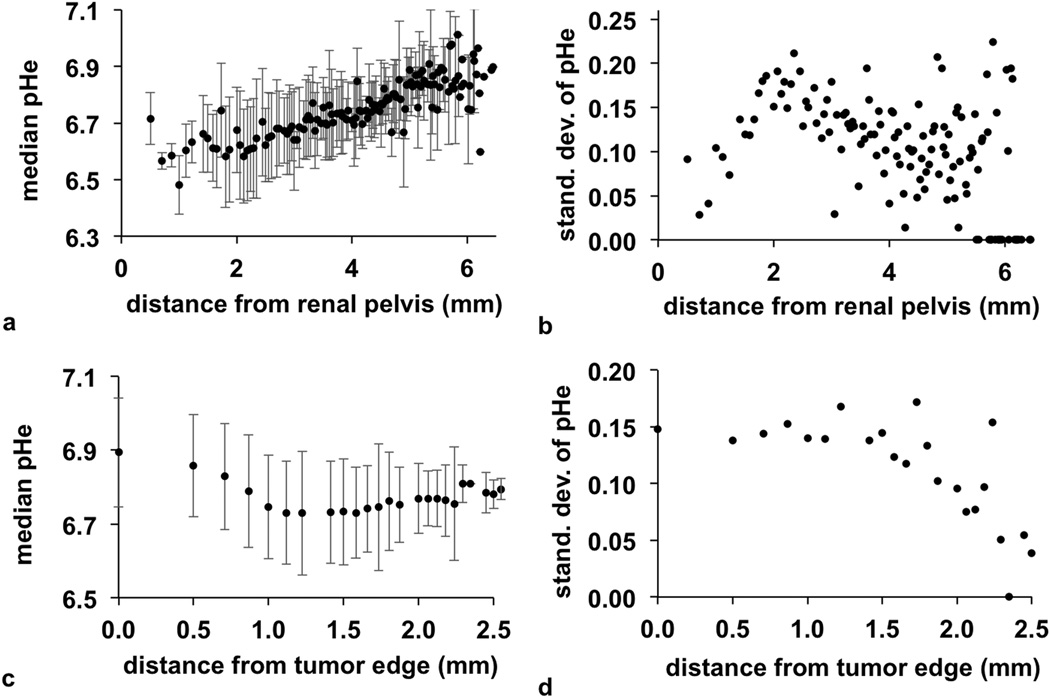
To evaluate spatial heterogeneity in the kidney, the renal pelvis of the kidney was identified from the RARE anatomical image and the multislice pH parametric map. We selected a single voxel at the center of the renal pelvis, and then determined the average pHe as a function of distance from this voxel. To evaluate spatial heterogeneity in the tumor, we used the RARE anatomical image to identify all voxels that were outside the edge of the tumor. The minimum distance from a voxel inside the tumor to any voxel outside the tumor was used to evaluate tumor pHe vs. distance from the edge of the tumor.
Results
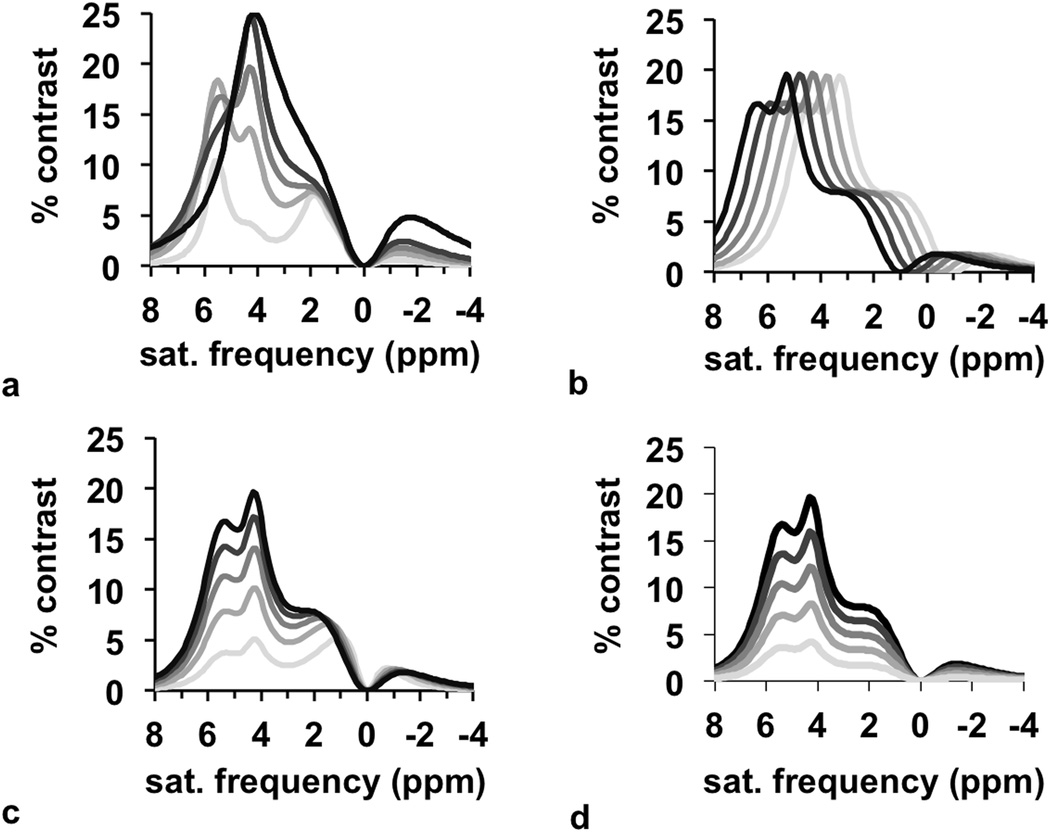
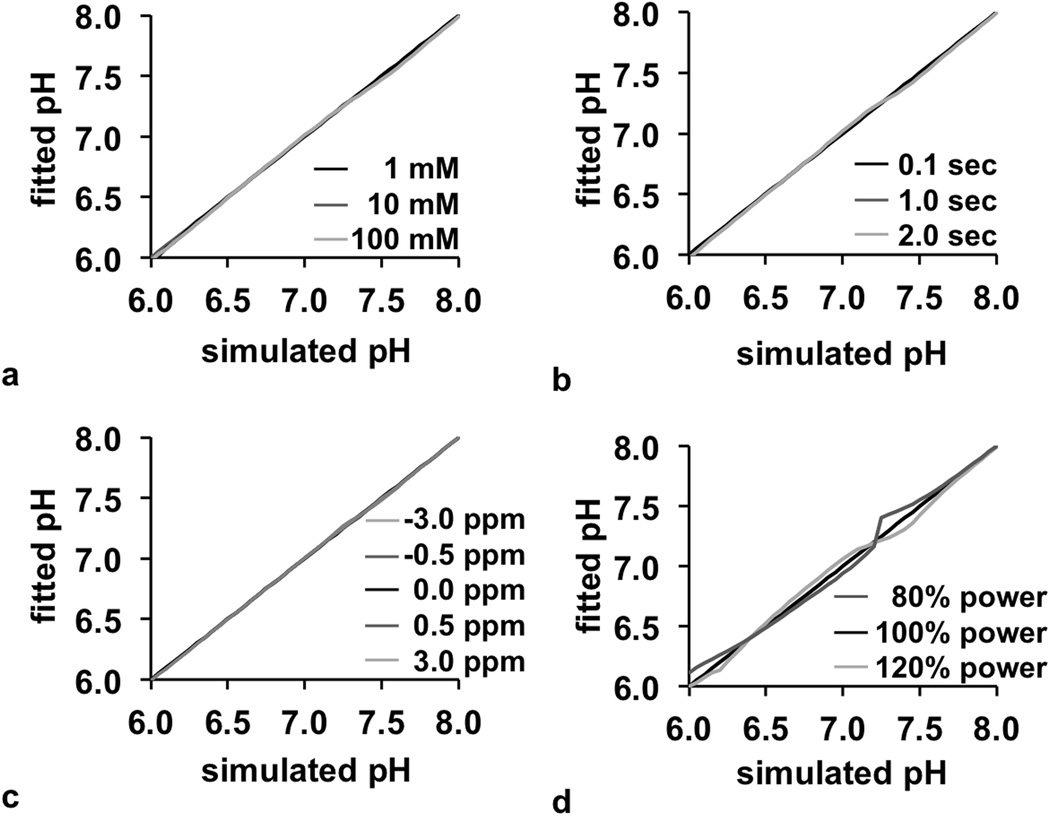
CEST spectra were simulated with a range of pH values, concentrations, T1 relaxation time constants, B0 homogeneity, and B1 homogeneity. These traditional CEST spectra were then converted to a spectrum of % CEST contrast, which is described as a “CEST contrast spectrum” for the remainder of this report (Fig. 3). These results showed that pH primarily affects the line shape of the CEST contrast spectrum, the concentration and T1 time primarily affects the amplitude of the spectrum, and the B0 homogeneity affects the frequency shift of the spectrum. Therefore, the estimation of pH from Bloch fitting is decoupled from the estimations of the other parameters. This observation was validated by comparing pH values from Bloch fitting vs. the pH values used to simulate each CEST spectrum. In each case, the pH could be accurately estimated from the fitting process over a range of concentrations, T1 times, and B0 inhomogeneities (Fig. 4a–c). Although B1 inhomogeneity can also influence the line shape of the CEST contrast spectrum, the pH could also be estimated from Bloch fitting with good accuracy in the presence of B1 inhomogeneity (Fig. 4d).
Figure 3.
Simulations of CEST contrast. The appearance of the spectra depend on (a) pH, (b) B0 inhomogeneity, (c) T1 relaxation time, and (d) concentration, which shows that the effect of pH is uncorrelated from the effect of other parameters.
Figure 4.
Fitting of pH. The fitted pH value was compared to the simulated pH value from pH 6.0 to 8.0 as a function of (a) concentration, (b) T1 relaxation time, (c) B0 inhomogeneity, and (d) B1 inhomogeneity, which shows that the pH value can be fitted independently from these other parameters. Most lines in the graphs are overlapped.
The kb and k0 chemical exchange rates of iopamidol were quantitatively analyzed using phantoms of the agent that ranged from pH 5.82 to 7.67. Experimental CEST spectra and CEST contrast spectra matched simulated spectra, which provided evidence that the simulations were performed correctly. Most of the values of kb and k0 were determined with good precision for the two amide protons and the hydroxyl proton that generates CEST signal at 1.87 ppm, based on experimental CEST spectra of iopamidol (Table 1). However, the k0 value for the amide proton resonating at 5.6 ppm was determined with lower precision. These fitted parameters for iopamidol were different than previously reported results (23), because our study was performed at 37 °C while the previous study was performed at 25 °C. The values of kb and k0 for the hydroxyl protons resonating at 0.73 ppm could not be determined with any precision, due to the proximity of this CEST signal near the direct saturation of water.
Table 1.
Estimated exchange rates for labile protons of iopamidol.
| Saturation Frequency (ppm) |
Number of protons |
k0 (Hz)1 | kb (Hz)1 |
|---|---|---|---|
| 0.73 | 4 | 882 (1014, −1014) | 923 (1014, −1014) |
| 1.87 | 1 | 740 (580, 901) | 1334 (1157, 1510) |
| 4.26 | 2 | 0 (−4, 4) | 135 (147, 123) |
| 5.58 | 1 | 41 (−238, 321) | 1093 (969, 1217) |
95% confidence intervals are listed in parentheses
The POMP CEST-FISP MRI protocol was successfully implemented with no evidence of systematic artifacts (Fig. 2). The cone phantom was useful for verifying the absence of spatial distortion within and between imaging slice planes. The average standard deviation along the slice direction was 0.57% CEST, showing good precision for measuring CEST amplitude along this dimension. For comparison, the in-plane precision was 0.64% CEST. Furthermore, phantoms ranging in pH from 6.25 to 7.32 were measured with the POMP CEST-FISP MRI protocol, which showed an excellent correlation in measured pH value relative to a benchtop pH microelectrode (Fig. 5a). Phantoms ranging in concentration from 5 to 80 mM at pH 6.71 showed excellent pH measurement accuracy in a concentration-independent manner.
Figure 5.
Experimental pH measurements in phantoms. (a) The pH of 20 mM of iopamidol measured with acidoCEST MRI was correlated with the pH measured with a benchtop pH electrode (R2 = 0.83). (b) AcidoCEST MRI was used to measure the pH of solutions of iopamidol at pH 6.71 (the horizontal line shows the pH value of 6.71). The pH could be estimated with good precision at ≥ 10 mM concentration. Error bars in both graphs represent the 95% confidence intervals of the acidoCEST MRI fitting process.
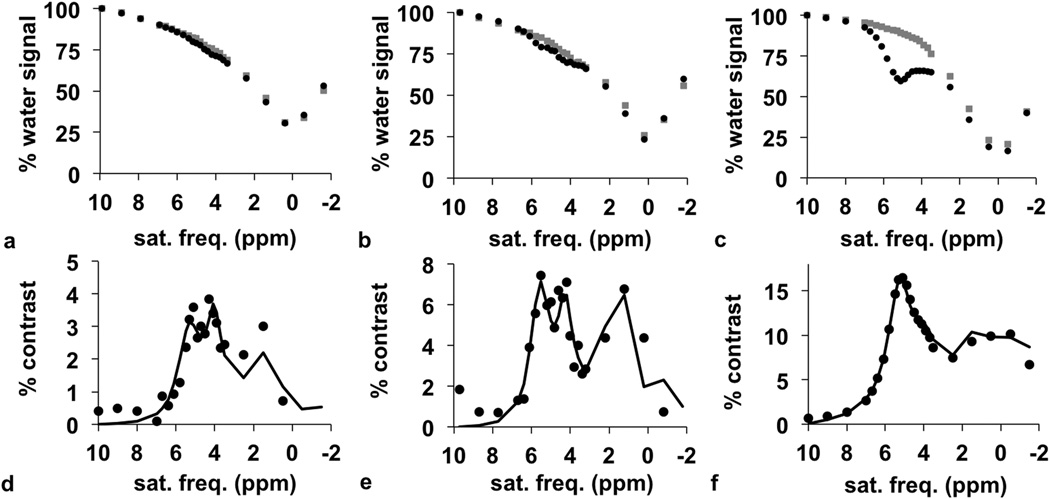
The POMP CEST-FISP MRI protocol was then used to generate CEST spectra through the 3D region of interest of the tumor, kidney, and bladder. Prior to the injection of the contrast agent, the CEST spectra showed a very modest peak at 3.6 ppm that was attributed to the chemical exchange from endogenous amide protons (gray lines in Fig. 6a–c). After injection, the CEST spectra showed two CEST signals from the two magnetically inequivalent amide groups and a third CEST signal from the hydroxyl groups of the agent (black lines in Fig. 6a–c).
Figure 6.
In vivo CEST-FISP MRI with a POMP acquisition scheme. The CEST spectra of (a) tumor, (b) kidney, and (c) bladder before (gray) and after (black) injection of iopamidol shows a decrease in water signal after injection. The difference between pre-injection and post-injection CEST spectra shows % contrast for the (d) tumor, (e) kidney, and (f) bladder.
Each post-injection CEST spectrum was subtracted from a corresponding pre-injection spectrum to generate a CEST contrast spectrum, which retained the CEST signals from the agent and eliminated the CEST signal from the endogenous amide protons (circles in Fig. 6d–f). These spectra were fit with the Bloch-McConnell equations to determine pH. This analysis method produced excellent fits of the three CEST signals of the tumor and kidney. The CEST signal at 4.2 ppm was weak in the contrast spectrum of the bladder, because the amide proton at this chemical shift has slow chemical exchange at low pH. However, the Bloch fitting procedure was still able to fit this weak spectral feature, which attests to the quality of this fitting method. During the analysis of all CEST spectra, the fitted B1 value matched the B1 value that was used during image acquisition, which verified the excellent B1 homogeneity during CEST saturation.
Gaussian spatial smoothing was critical for improving the Bloch fitting of CEST contrast spectra for each pixel. Increasing the FWHM of the Gaussian filter created CEST contrast spectra with an improved contrast-to-noise ratio (CNR) that improved the confidence intervals of the fitting process (Fig. 7a). Importantly, 3D Gaussian spatial filtering greatly improved the fitting process (solid error bar at 2.25 FWHM in Fig. 7a) relative to 2D spatial filtering (dashed error bar at 2.25 FWHM in Fig. 7a). A FWHM of 2.25 was found to provide precise fitting while still retaining good spatial resolution, and subsequent analyses used this FWHM value. Notably, the average pHe did not change as a function of FWHM, indicating that partial volume effects did not introduce systematic errors when estimating pHe on a pixelwise basis.
Figure 7.
The precision of pH measurements with respect to spatial filter size. a: The average pH with error bars that represent the 95% confidence intervals are shown as a function of the Full Height at Half Maximum (FWHM) filter size. b: The precision of the pH measurement increases with increasing filter size.
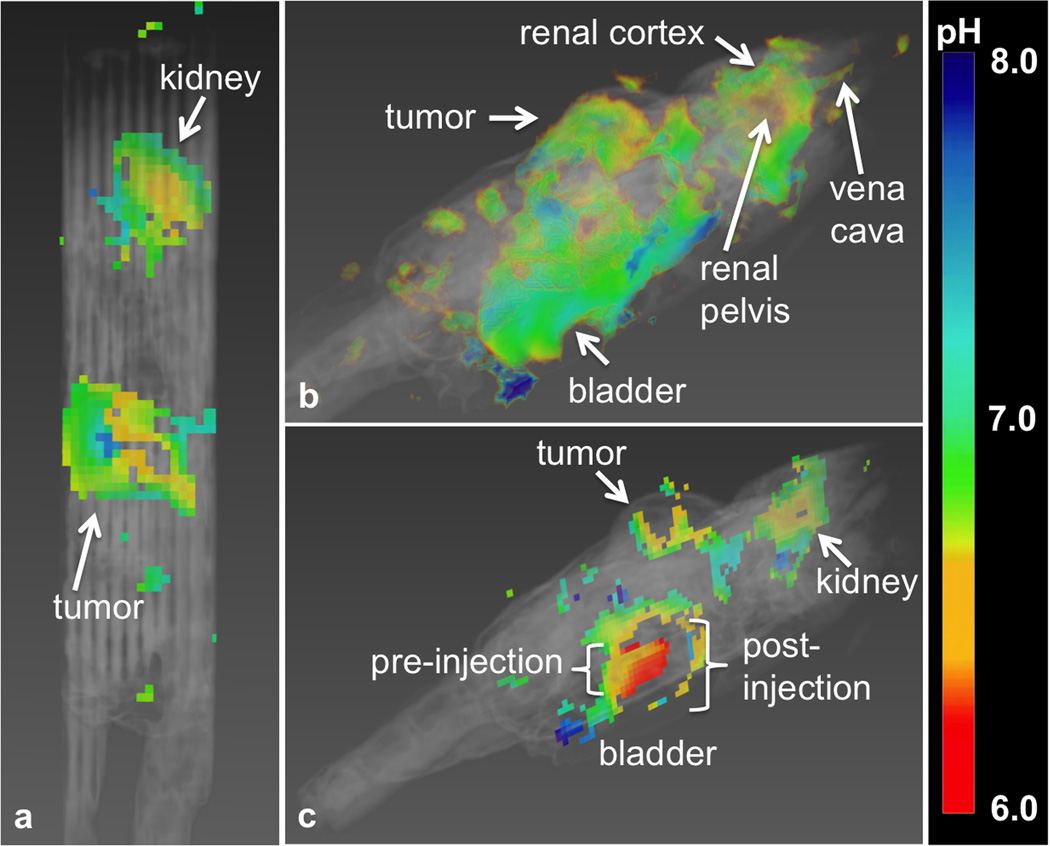
The multislice parametric map of pHe was overlaid on the multislice, T2-weighted anatomical image of the mouse. This 3D view showed that the pHe of most normal tissues had a value of approximately 7.2 throughout the majority of the mouse. As exceptions, the tumor had an average value of 6.74, the kidney had a distribution of acidic pHe values around 6.72, and the bladder had a pHe value of 6.3 (Fig. 8). The 95% confidence intervals for fitting these average pHe values were 0.26, 0.27, an 0.10 pH units for the tumor, kidney, and bladder, respectively. The fitted average concentration of agent in the kidney was 61 mM, while the fitted average concentration in the tumor was 12 mM. These concentration measurements compared favorably with a previous CT study of the concentration of a similar iodinated CEST agent in tumors (3).
Figure 8.
Multislice parametric pHe maps of the tumor, kidney, and bladder. a: The tumor showed an average pHe of 6.74. b: The pHe increased from the renal pelvis (6.54) to the cortex (6.84). c: The bladder had a pHe of 6.3. The region into which the bladder swells after injection during infusion could not be fit, indicating that the fitting method used is robust against overfitting.
This 3D view also showed that only a region of the bladder could be analyzed (Fig. 8b). This bladder region was consistent with the size and location of the bladder before infusion, while the additional region into which the bladder swelled during infusion of agent could not be analyzed. This result shows that our methodology is conservative and avoids producing irrelevant pHe maps. This result also shows that this methodology cannot analyze tissues with significant motion between pre-injection and post-injection scans.
Three-dimensional parametric maps of pHe provided the opportunity to evaluate the spatial heterogeneity of tissue acidity. The average pHe measurements increased 6.54 to 6.84 from the renal pelvis to cortex (Fig. 9a). The heterogeneity of pHe values was highest near the renal pelvis and decreased towards the cortex (Fig. 9b). These observations matched our expectations for kidney physiology, because acidic metabolites are diluted through perfusion from the renal pelvis, through the medulla and to the cortex. The tumor showed a decreasing pHe from the tumor edge through the tumor rim (i.e., the first 1.5 mm from the edge; Fig. 9c), with a minor increase in pHe from the rim to the core (i.e., between 1.5 mm and 2.5 mm from the edge). The spatial heterogeneity also decreased from tumor rim to core (Fig. 9d). Our past studies have indicated that tumor necrosis is associated with neutral pHe, presumably due to poor metabolic activity (3). Therefore, a similar pHe in the tumor core of this mouse model relative to the tumor rim suggests that the core tissue was still metabolically active. More generally, these results show that POMP CEST-FISP MRI provides a new tool for interrogating the 3D heterogeneity of tumor metabolism.
Figure 9.
Radial distributions of pHe. a: The median pHe increased from the renal pelvis, indicating a lower pHe in the medulla than the cortex. b: The heterogeneity of the median pHe peaked at 2 mm from the renal pelvis, and decreased farther from the renal pelvis. c: The pHe of the tumor was most acidic at a depth of 1.0–1.5 mm, which represented the tumor rim. d: The heterogeneity of the median pHe was consistent from the tumor edge to the tumor rim and decreased in the tumor core. The error bars in graphs (a) and (c) represented the standard deviation. Some distance measurements in the kidney and tumor were represented by only 1 voxel and therefore had a standard deviation of zero.
Discussion
We have demonstrated that CEST MRI can be sufficiently accelerated to analyze 3D volumes with an exogenous agent. Our POMP CEST-FISP MRI protocol obtained pixelwise CEST spectra with 24 saturation frequencies and 20 image slices within 7:28 min, which equates to 0.93 sec/slice/frequency. For comparison, a previous report has shown endogenous CEST MRI with multiband excitation, with 34 saturation frequencies and 4 image slices acquired in 3:46 min, which equates to 1.66 sec/slice/frequency (24). The slower acquisition per image slice was attributed to a gradient echo acquisition scheme, relative to the FISP acquisition scheme used in our study. The combination of POMP and FISP was critical for obtaining faster results that could capture CEST signals from an exogenous contrast agent.
Fitting the Bloch-McConnell equations modified to directly include pH was also critical for our study. The Bloch-McConnell equations have 7 parameters that need to be fit, relative to 12 parameters that must be fit with Lorentzian line shape analysis of the direct saturation of water and three CEST signals from the two amide groups and the hydroxyl groups of iopamidol. This fitting method also estimated the concentration of exogenous agent in each tissue, which added substantial value to the analysis. Furthermore, the estimation of pH is highly orthogonal to the estimation of other parameters with this Bloch-McConnell fitting process, because the pH is largely determined by the line shape of the CEST contrast spectrum, while other parameters are largely determined from the amplitude and frequency. This conclusion has also been demonstrated in previous studies that have used a different approach (12,25). Importantly, the CEST signal from the hydroxyl groups serves as an internal control to further decouple the estimate of pH from concentration, because CEST of the hydroxyl groups is pH-independent. Therefore, fitting the entire CEST contrast spectrum with the Bloch-McConnell equations provides the most comprehensive analysis. This example of fitting exogenous CEST spectra compliments similar techniques that fit Bloch-McConnell equations to endogenous CEST spectra (26,27).
Our fitting method assumed that the endogenous T1 and T2 relaxation time constants were the same for all tissues. This assumption has been shown to be reasonable when estimating chemical exchange rates of exogenous agents at or near physiological pH (17,28,29). More specifically, this assumption is true when the average resident lifetime of the labile proton is shorter than the average T2 relaxation time of the proton, which is the case for iopamidol at physiological pH. However, the Bloch-McConnell fitting process can be improved by reducing the number of parameters to be fit, so that incorporating a pixelwise T1- and T2-map into the fitting process may improve the precision of the pHe measurement. Furthermore, the estimation of T1 time and agent concentration is inherently coupled in the Bloch-McConnell equations. A T1-map would improve the accuracy of estimating agent concentration on a pixelwise basis.
Gaussian spatial filtering was also critical for our analysis. Spatial filtering mitigated problems with motion and improved the CNR, which improved the precision of the fitting method. The improved precision scaled with the volume of tissue that was averaged via spatial filtering, but at the expense of reducing the real spatial resolution. Therefore, the selection of filter size should be made solely on the tradeoff between spatial resolution and precision of fit. Also, the filter size may be reduced by acquiring more averages to improve CNR, using an alternative method to denoise, or by optimizing imaging parameters.
Our pHe measurements were more dependent on the CEST signal at 4.2 ppm than at 5.6 ppm (except for pixels that represented the highly acidic bladder). The CEST signal at 5.6 ppm from a similar exogenous contrast agent has been used to measure pHe with a dual-power CEST MRI method, whereby the ratio of the CEST signal at 5.6 ppm measured at two saturation power levels is correlated with pH (30). Unfortunately, this dual-power CEST MRI method doubles the scan time for pHe assessments, which is especially problematic for exogenous agents that have fast pharmacokinetic uptake and wash-out. Furthermore, B1 inhomogeneity can compromise the accuracy of a power-dependent CEST MRI method, and B1 inhomogeneity is spatially dependent. These spatial inaccuracies in estimating pHe values may be misinterpreted as greater spatial heterogeneity in tissues. For this reason, a frequency-dependent CEST analysis may be more robust for pHe analyses, such as the analysis of the full CEST spectrum performed in this study.
The multislice pHe map showed that the tumor was relatively homogenous, with only a minor difference in average pHe between the tumor rim and core. This result matched our expectation for a relatively small flank tumor. Larger flank tumors can become necrotic in the core, and often demonstrate a greater difference in MR images between the rim and core (31). This study suggests that future studies may employ POMP CEST-FISP MRI to interrogate the longitudinal evolution of tumor physiology.
Our pHe map of the renal system, including the renal pelvis, calyx, cortex, and the bladder, is consistent with renal physiology. For comparison, other MRI studies have mapped kidney pHe using T1 relaxivity MRI (11) and CEST MRI (12, 30, 32–33). However, these cases only used a 2D imaging method to map kidney pHe. Future studies that use multislice POMP CEST-FISP MRI may more completely assess kidney physiology.
Conclusions
We have demonstrated that multislice POMP CEST-FISP MRI with an exogenous contrast agent can measure pHe in vivo. Multislice imaging improves the Gaussian spatial smoothing process, and provides an assessment of pHe throughout a tissue volume. Fitting in vivo CEST spectra with the Bloch-McConnell equations can directly estimate pHe and concentration. The combination of these methods successfully mapped the pHe of the tumor, kidney, and bladder within a flank tumor model.
Acknowledgments
These studies were supported by the National Cancer Institute of the National Institutes of Health under award numbers R01CA167183, R01CA197029, P30CA023074. EAR and JCR designed the studies; EAR, JCG, MDP, and JCR performed phantom studies; EAR and CMH performed in vivo studies; EAR analyzed the results; EAR, JCR, MDP, and JCR drafted the manuscript and all authors approved the final publication. JCG acknowledges support from the NIH Minority Access to Research Careers grant T34 GM008718.
References
- 1.Warburg O. On the origin of cancer cells. Science. 1956;123:309–314. doi: 10.1126/science.123.3191.309. [DOI] [PubMed] [Google Scholar]
- 2.Akhenblit PA, Pagel MD. Recent advances in targeting tumor energy metabolism with tumor acidosis as a biomarker of drug efficacy. J Cancer Sci Therapy. 2016;8:20–29. doi: 10.4172/1948-5956.1000382. [DOI] [PMC free article] [PubMed] [Google Scholar]
- 3.Chen LQ, Howison CM, Jeffery JJ, Robey IF, Kuo PH, Pagel MD. Evaluations of extracellular pH within in vivo tumors using acidoCEST MRI. Magn Reson Med. 2014;72:1408–1417. doi: 10.1002/mrm.25053. [DOI] [PMC free article] [PubMed] [Google Scholar]
- 4.Sheth VR, Liu G, Li Y, Pagel MD. Improved pH measurements with a single PARACEST MRI contrast agent. Contrast Media Molec I. 2012;7:26–34. doi: 10.1002/cmmi.460. [DOI] [PMC free article] [PubMed] [Google Scholar]
- 5.Chen LQ, Randtke EA, Jones KM, Moon BF, Howison CM, Pagel MD. Evaluations of tumor acidosis within in vivo tumor models using parametric maps generated with acidoCEST MRI. Mol Imaging Biol. 2015;17:488–496. doi: 10.1007/s11307-014-0816-2. [DOI] [PMC free article] [PubMed] [Google Scholar]
- 6.Chen LQ, Howison CM, Spier C, Stopeck AT, Malm SW, Pagel MD, Baker AF. Assessment of carbonic anhydrase IX expression and extracellular pH in B-cell lymphoma cell line models. Leukemia Lymphoma. 2015;56:1432–1439. doi: 10.3109/10428194.2014.933218. [DOI] [PMC free article] [PubMed] [Google Scholar]
- 7.Akhenblit PJ, Hanke NT, Gill A, Persky DO, Howison CM, Pagel MD, Baker AF. Assessing metabolic changes in response to mTOR inhibition in a mantle cell lymphoma xenograft model using acidoCEST MRI. Mol Imaging. 2016 doi: 10.1177/1536012116645439. in press. [DOI] [PMC free article] [PubMed] [Google Scholar]
- 8.Jones KM, Randtke EA, Howison CM, Cárdenas-Rodríguez J, Sime PJ, Kottmann RM, Pagel MD. Measuring extracellular pH in a lung fibrosis model with acidoCEST MRI. Molec Imaging Biol. 2015;17:177–184. doi: 10.1007/s11307-014-0784-6. [DOI] [PMC free article] [PubMed] [Google Scholar]
- 9.Sheth VR, Li Y, Chen LQ, Howison CM, Flask CA, Pagel MD. Measuring in vivo tumor pHe with CEST-FISP MRI. Magn Reson Med. 2012;67:760–768. doi: 10.1002/mrm.23038. [DOI] [PMC free article] [PubMed] [Google Scholar]
- 10.Liu G, Li Y, Sheth VR, Pagel MD. Imaging in vivo extracellular pH with a single PARACEST MRI contrast agent. Molec Imaging. 2012;11(1):47–57. [PMC free article] [PubMed] [Google Scholar]
- 11.Raghunand N, Howison C, Sherry AD, Zhang S, Gillies RJ. Renal and systemic pH imaging by contrast-enhanced MRI. Magn Reson Med. 2003;49:249–257. doi: 10.1002/mrm.10347. [DOI] [PubMed] [Google Scholar]
- 12.Longo DL, Dastrù W, Digilio G, Keupp J, Langereis S, Lanzardo S, Prestigio S, Steinbach O, Terreno E, Uggeri F, Aime S. Iopamidol as a responsive MRI-chemical exchange saturation transfer contrast agent for pH mapping of kidneys: In vivo studies in mice at 7 T. Magn Reson Ned. 2011;65:202–211. doi: 10.1002/mrm.22608. [DOI] [PubMed] [Google Scholar]
- 13.Glover GH. Phase-offset multiplanar (POMP) volume imaging: a new technique. J Magn Reson Imaging. 1991;1:457–461. doi: 10.1002/jmri.1880010410. [DOI] [PubMed] [Google Scholar]
- 14.Breuer FA, Blaimer M, Heidemann RM, Mueller MF, Griswold MA, Jakob PM. Controlled aliasing in parallel imaging results in higher acceleration (CAIPIRINHA) for multi-slice imaging. Magn Reson Med. 2005;53:684–691. doi: 10.1002/mrm.20401. [DOI] [PubMed] [Google Scholar]
- 15.Souza SP, Szumowski J, Dumoulin CL, Plews DP, Glover G. SIMA: simultaneous multislice acquisition of MR images by Hadamard-encoded excitation. J Comput Assist Tomogr. 1998;12:1026–1030. [PubMed] [Google Scholar]
- 16.Moon BF, Jones KM, Chen LQ, Liu P, Randtke EA, Howison CM, Pagel MD. A comparison of iopromide and iopamidol, two acidoCEST MRI contrast media that measure tumor extracellular pH. Contrast Media Molec Imaging. 2015;10:446–455. doi: 10.1002/cmmi.1647. [DOI] [PMC free article] [PubMed] [Google Scholar]
- 17.Woessner DE, Zhang S, Merritt ME, Sherry AD. Numerical solution of the Bloch equations provides insights into the optimum design of PARACEST agents for MRI. Magn Reson Med. 2005;53:790–799. doi: 10.1002/mrm.20408. [DOI] [PubMed] [Google Scholar]
- 18.Murase K, Tanki N. Numerical solutions to the time-dependent Bloch equations revisited. Magn Reson Imaging. 2011;29:126–131. doi: 10.1016/j.mri.2010.07.003. [DOI] [PubMed] [Google Scholar]
- 19.Liepinsh E, Otting G. Proton exchange rates from amino acid side chains—implications for image contrast. Magn Reson Med. 1996;35:30–42. doi: 10.1002/mrm.1910350106. [DOI] [PubMed] [Google Scholar]
- 20.Xu X, Lee JS, Jerschow A. Ultrafast scanning of exchangeable sites by NMR spectroscopy. Angew Chem Int Ed. 2013;52:8281–8284. doi: 10.1002/anie.201303255. [DOI] [PMC free article] [PubMed] [Google Scholar]
- 21.Shah T, Lu L, Dell K, Pagel MD, Griswold M, Flask CA. CEST-FISP: A novel technique for rapid chemical exchange saturation transfer (CEST) MRI at 7T. Magn Reson Med. 2011;65:432–437. doi: 10.1002/mrm.22637. [DOI] [PMC free article] [PubMed] [Google Scholar]
- 22.Dixon WT, Hancu I, Ratnakar SJ, Sherry AD, Lenkinski RE, Alsop DC. A multislice gradient echo pulse sequence for CEST imaging. Magn Reson Med. 2010;63:253–256. doi: 10.1002/mrm.22193. [DOI] [PMC free article] [PubMed] [Google Scholar]
- 23.Sun PZ, Longo DL, Hu W, Xiao G, Wu R. Quantification of iopamidol multi-site chemical exchange properties for ratiometric chemical exchange saturation transfer (CEST) imaging of pH. Phys Med Biol. 2014;59:4493–4504. doi: 10.1088/0031-9155/59/16/4493. [DOI] [PMC free article] [PubMed] [Google Scholar]
- 24.Liu D, Zhou J, Xue R, Wang DJJ. Using simultaneous multi-slice excitation to accelerate CEST imaging. Proc Intl Soc Mag Reson Med. 2014:3294. [Google Scholar]
- 25.McVicar N, Li AX, Goncalves DF, Bellyou M, Meakin SO, Prado MA, Bartha R. Quantitative tissue pH measurement during cerebral ischemia using amine and amide concentration-independent detection (AACID) with MRI. J Cereb Blood Flow Metab. 2014;34:690–698. doi: 10.1038/jcbfm.2014.12. [DOI] [PMC free article] [PubMed] [Google Scholar]
- 26.Tee YK, Harston GW, Blockley N, Okell TW, Levman J, Seerin F, Cellerini M, Jezzard P, Kennedy J, Payne SJ, Chappell MA. Comparing different analysis methods for quantifying the MRI amide proton transfer (APT) effect in hyperacute stroke patients. NMR Biomed. 2014;27:1019–1029. doi: 10.1002/nbm.3147. [DOI] [PMC free article] [PubMed] [Google Scholar]
- 27.Chappell MA, Donahue MJ, Tee YK, Khrapititchev AA, Sibson NR, Jezzard P, Payne SJ. Quantitative Bayesian model-based analysis of amide proton transfer MRI. Magn Reson Med. 2013;70:556–567. doi: 10.1002/mrm.24474. [DOI] [PMC free article] [PubMed] [Google Scholar]
- 28.Dixon WT, Ren J, Lubag AJ, Ratnakar J, Vinogradov E, Hancu I, Lenkinski RE, Sherry AD. A concentration-independent method to measure exchange rates in PARACEST agents. Magn Reson Med. 2010;63:625–632. doi: 10.1002/mrm.22242. [DOI] [PMC free article] [PubMed] [Google Scholar]
- 29.Randtke EA, Chen LQ, Corrales LR, Pagel MD. The Hanes-Woolf linear QUESP method improves the measurements of fast chemical exchange rates with CEST MRI. Magn Reson Med. 2014;71:1603–1612. doi: 10.1002/mrm.24792. [DOI] [PMC free article] [PubMed] [Google Scholar]
- 30.Longo DL, Sun PZ, Consolino L, Michelotti FC, Uggeri F, Aime S. A general MRI-CEST ratiometric approach for pH imaging: demonstration of in vivo pH mapping with iobitridol. J Am Chem Soc. 2014;136:14333–14336. doi: 10.1021/ja5059313. [DOI] [PMC free article] [PubMed] [Google Scholar]
- 31.Bhujwalla ZM, Artemov D, Ballesteros P, Cerdan S, Gillies RJ, Solaiyappan M. Combined vascular and extracellular pH imaging of solid tumors. NMR in Biomedicine. 2002;15(2):114–119. doi: 10.1002/nbm.743. [DOI] [PubMed] [Google Scholar]
- 32.Longo DL, Busato A, Lanzardo S, Antico F, Aime S. Imaging the pH evolution of an acute kidney injury model by means of iopamidol, a MRI-CEST pH-responsive contrast agent. Magn Reson Med. 2013;70:859–864. doi: 10.1002/mrm.24513. [DOI] [PubMed] [Google Scholar]
- 33.Wu Y, Zhang S, Soesbe TC, Yu J, Vinogradov E, Lenkinski RE, Sherry AD. pH imaging of mouse kidneys in vivo using a frequency-dependent paraCEST agent. Magn Reson Med. 2016 doi: 10.1002/mrm.25844. Epub ahead of print. [DOI] [PMC free article] [PubMed] [Google Scholar]


