Abstract
Purpose
To investigate whether there is imaging evidence of hypothalamic injury in patients with mild traumatic brain injury (MTBI), which is a major public health problem due to the high prevalence and difficulty in diagnosis and treatment.
Materials and Methods
Twenty-four patients (mean age 34.2, range, 18–56 years) with symptomatic MTBI and 22 age-matched healthy controls (mean age 37.0, range 20–61 years) participated in the study. Diffusion kurtosis imaging was performed with diffusion-weighted images acquired along 30 gradient directions and three b-values (b = 0, 1000, 2000 s/mm2) based on a twice-refocused spin-echo sequence with a 3T magnetic resonance imaging (MRI) scanner. Resting-state functional (f)MRI with standard echo planar imaging (EPI) were performed to localize the resting-state networks (RSN) and hypothalamic functional connectivity.
Results
There were significantly reduced mean kurtosis (P = 0.0092) and radial kurtosis (P = 0.0078) in patients as compared to controls in the hypothalamus. Furthermore, there was a significant negative correlation (r = −0.675, P = 0.0007) between radial kurtosis in the hypothalamus and fatigue severity scale in patients. The MTBI group also showed disrupted hypothalamic RSNs, with significantly decreased positive connectivity in medial prefrontal cortex, inferior posterior parietal, and cingulate regions but increased connectivity in the peri-hypothalamic regions and cerebellum, together with significantly decreased negative RSNs in visual and bilateral premotor areas (cluster corrected P < 0.05).
Conclusion
Our results show disruption of functional and structural hypothalamic connectivity in patients with MTBI, and might further the understanding of an array of clinical symptoms in MTBI such as sleep disturbance and fatigue.
Mild tramatic brain injury (MTBI) is a significant public health problem, representing 75% of the total TBI cases. However, its underlying pathophysiological mechanisms of complex posttraumatic symptoms are poorly understood, leading to a paucity of successful treatment strategies.1 There is usually no evidence of brain structural abnormality on conventional neuroimaging, such as computed tomography (CT) and magnetic resonance imaging (MRI) scans,2 despite the fact that there are quite a few recently developed advanced neuroimaging techniques including functional (f)MRI for detecting brain abnormalities in MTBI such as thalamic injury and white matter atrophy.3 The commonly reported sequelae following TBI of any severity include fatigue, problems with sleep, problems with appetite and arousal, and lack of motivation,4 which are all closely related to hypothalamic dysfunction and neuropeptide dysregulation.5 There is an increasing body of literature indicating that damage to the hypothalamic–hypophysical axis has been underdiagnosed and may account for some of the sequelae following TBI of any severity.6,7 In MTBI, these sequelae may be reported immediately but in some cases (up to 30%) can develop and persist months to years after the injury.8 While damage following moderate to severe TBI can be easily envisioned, MTBI can also cause injury to hypothalamic cell bodies that may result in substantial neuropeptide dysregulation with associated clinical hypothalamic symptoms related to motivated behavior, sleep/wake cycles, and arousal.5,9 However, there are few studies investigating the hypothalamic injury in MTBI in vivo and its role in post-concussive syndrome is largely underappreciated.
Diffusion MRI is sensitive to tissue microstructure by measuring random translational motion of water molecules due to its hindrance of water diffusion among neuronal/axonal cells.10 Previous studies have demonstrated the ability of diffusion tensor imaging (DTI) in identifying axonal injury in patients with TBI.11,12 Recent advances of DTI have the potential to characterize diffusion abnormalities at microscopic cellular levels in MTBI patients.13 While fractional anisotropy (FA) and mean diffusivity (MD) measures have been explored in patients with TBI,14 this study focused on the detection (and consequences) of microstructural injury in MTBI using diffusional kurtosis imaging (DKI), which has been developed and validated recently. DKI is an extended version of DTI. Compared to DTI, DKI provides a quantitative measure of the degree to which water diffusion is non-Gaussian, which truly reflects the underlying authentic and unassuming biological microenvironment in most tissues.15 A principal advantage of diffusional kurtosis compared with the conventional diffusion coefficient is that it is a specific measure of tissue structure (eg, cellular compartments and membranes) and has better sensitivity in gray matter. Although the diffusion coefficient is affected by tissue structure, it is also influenced by other factors, such as the concentration of macromolecules, and is hence a less specific indicator of a tissue’s structural complexity.16 DKI has been proposed for differentiating MTBI from controls in brain regions including thalamus and frontal white matter in both initial and longitudinal visits.17 In this study we used DKI in detecting hypothalamic injury in MTBI, which has potential to provide different and complementary information than conventional DTI.
Resting-state functional MRI (RS-fMRI) has recently drawn more attention in detecting robust various neuronal functional connectivity patterns.18 Using RS-fMRI, studies have consistently demonstrated phase-locked low-frequency oscillations (<0.1 Hz) of blood oxygenation level-dependent (BOLD) signal across functionally connected brain regions (resting state networks, RSNs) in the resting brain.3,19 There are several well-established intrinsic brain networks at resting stage including the default mode network (DMN), the anti-DMN dorsal attention network, and sensorimotor and visual networks.18,20 There is also increasing evidence of functional connectivity between deep gray matter and cortex including basal ganglia and thalamus.3,21 In TBI, diffuse axonal injury resulting in disruption of functional networks in the brain is thought to be a major contributor to cognitive dysfunction in survivors of traumatic brain injury.22 Following brain injury, there is significant disruption or decreased RSFC between brain regions in patients with TBI.23 Either hypometabolism at DMN or hyperconnectivity in the frontal regions had been reported in patients with diffuse axonal injury, chronic TBI, or vegetative conditions.24-26 Furthermore, Hillary et al also showed an interval increase of functional connectivity during disease recovery.27 In MTBI, Mayer et al28 found abnormal connectivity between the DMN and frontal cortex. Our group recently reported decreased posterior DMN functional connectivity compensated with increased anterior DMN connectivity in MTBI patients compared to controls, as well as lower neuronal activity and functional connectivity in the thalamus and disruption of thalamocortical connections.21,29
There is an increasing body of literature that suggests that damage to the hypothalamic–hypophysial axis has been underdiagnosed and may account for some of the sequelae following MTBI, but with limited supported imaging findings.21 The purpose of the present study was to identify hypothalamic structural, functional, and their pathway injury using advanced quantitative MRI techniques including DKI and RS-fMRI to reflect both microstructural and functional connectivity and activity abnormalities in patients with MTBI.
Materials and Methods
Subjects
Our Institutional Review Board approved this study and our study was in compliance with the Health Insurance Portability and Accountability Act (HIPPA), and all study participants had signed the informed consent form after the nature of this study was explained. MTBI patients were recruited from the Emergency Department of a university-affiliated Level I trauma center. Twenty-four patients (mean age of 34.2 ± 11.4 years, range 18–56 years, 17 men and 7 women, mean educational attainment: 16 ± 2 years) with symptomatic MTBI and 22 age-, sex-, education level-, and handedness-matched healthy controls (mean age of 37.0 ± 11.8 years, range 20–61 years, 9 men and 13 women, mean educational attainment: 15 ± 2 years) participated in this prospective study. The patients had a mean interval between MRI and traumatic incident of 22 days (range: 3–53 days) and initial Glasgow Coma Scale (GCS) of 13–15 were observed after loss of consciousness. All the patients had varied posttraumatic symptoms such as fatigue, sleep disturbance, emotional stress, memory trouble, and headache. Exclusion criteria included a history of alcohol or drug abuse; a preexisting psychiatric disorder; a prior brain injury other than the current episode; and a history of other neurologic disease, including stroke, epilepsy, and somatic disorders. Control subjects were also confirmed to have no history of psychiatric, neurologic, or central nervous system diseases and had normal conventional MRI findings.29,30
Neuropsychological tests, postconcussive syndrome score, anxiety, depression, and fatigue evaluations were performed within 12 hours of the MRI scan for patients with MTBI. Fatigue was measured by a composite fatigue severity scale,31 for which higher scores indicate greater symptomatology.
MRI
All MRI experiments were performed using a 3T Trio MRI scanner (Siemens Medical Solutions, Erlangen, Germany). MR images were acquired using a body coil for transmission and a 12-element SENSE coil for reception. In addition to the diffusion and functional MRI data, a set of coplanar T2-weighted turbo spin echo images, a whole-brain 3D T1-weighted volume images, and susceptibility weighted imaging were also acquired to exclude nontraumatic lesions. The total imaging time was around 45 minutes. The conventional T1- and T2-weighted images were reviewed by two radiologists with 14 years of experience in diagnostic MRI imaging, and lesions, if present, were reported.
The 3D magnetization-prepared rapid gradient echo (MPRAGE; TR/TE/TI = 2300/2.98/900 msec, flip angle = 9°, resolution =1 × 1 × 1 mm3) was used as reference image for overlaying RS-fMRI connectivity maps and also for the anatomical normalization of hypothalamic seed-based RS-fMRI.
DKI was performed with diffusion-weighted images (DWIs) acquired along 30 gradient directions and three b-values (b = 0, 1000, 2000 s/mm2) based on a twice-refocused spin-echo sequence. Scan parameters include TR/TE = 3700/96 msec, voxel size = 2.7 × 2.7 × 2.7 mm3, matrix = 82 × 82, 28 slices, and covered the whole cerebrum, acquisition time of ~8 minutes.
For RS-fMRI, a standard gradient-echo EPI (TR/TE =2 sec / 30 msec, number of volumes = 153, flip angle = 75°, field of view [FOV] = 220 × 220 mm2, matrix = 128 × 128, 153 volumes) was performed in axial plane parallel to a line passing through the anterior–posterior commissure (AC-PC line) with 5-mm slice thickness and 1-mm gap and positioned to cover nearly the entire cerebrum, resulting in a spatial resolution of 1.72 × 1.72 × 6 mm3 and acquisition time of 5 minutes, 6 seconds. All patients and healthy subjects were instructed to close their eyes but stay awake during the resting-state fMRI imaging examination.
Image Postprocessing and Data Analysis
HYPOTHALAMIC MASK DERIVATION
A hypothalamus mask was obtained with an in-house-developed probability mask that were averaged from 81 young normal control participants with the 75% probability map (Fig. 1). Briefly, for each of the 81 subjects, the hypothalamus was first manually delineated with the MEDx software (http://medx.sensor.com) based on the MPRAGE image in the coronal view at individual space after intensity inhomogeneity correction. The anatomical MPRAGE image was then normalized to the Montreal Neurological Institute (MNI) 2-mm template space, and the same transformation was applied to the individual hypothalamic mask. Group average of the hypothalamic maps was obtained in the MNI template space, and 75% probabilistic threshold was applied to derive the hypothalamic ROI in the template space as shown in Fig. 1.
FIGURE 1.
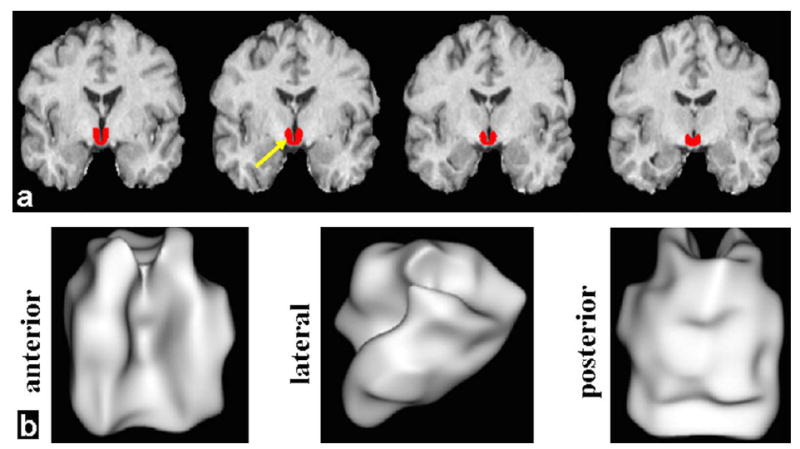
High-resolution 3D MPRAGE was used for delineation of hypothalamus (red) in order to provide a volume image for ROI- or seed-based analysis of DKI and RS-fMRI data. a: Four representative slices in coronal orientation (red color for hypothalamus) in the MNI template space. b: Three views (anterior, lateral, and posterior) of the 75% probabilistic hypothalamic mask are shown with the 3D rendering technique.
DIFFUSION KURTOSIS QUANTIFICATION
The DKI data were processed with in-house MatLab (MathWorks, Natick, MA) scripts. Three-dimensional motion correction and spatial smoothing (Gaussian filter full-width-half-maximum [FWHM] = 2.5 mm) were performed with SPM8 software package (Statistical Parametric Mapping, http://fsl.fmrib.ox.ac.uk/fsl/fslwiki/). The signal intensities of the diffusion-weighted data acquired from each gradient direction were then fitted on a voxel-by-voxel basis to obtain MD and mean kurtosis (MK) maps using a Levenberg–Marquardt nonlinear fitting algorithm.16 The apparent diffusion coefficient from all 30 gradient directions was used to calculate diffusion tensor indices that were then employed to obtain FA and MD maps. The MK, axial kurtosis (Kax), radial kurtosis (Krad) parametric images were also obtained in the processing pipeline with linear constrained least squares fitting to ensure biologically plausible tensor estimates using fast heuristic algorithm based on the exact closed-form solution.16 Namely, MK is the average of apparent kurtosis coefficient and Krad is defined as the mean diffusional kurtosis perpendicular to the direction of highest diffusion, consistent with the definition of radial diffusivity; while Kax is the diffusional kurtosis in the axial direction of the highest diffusion.
For the hypothalamic regional quantification based on mask in the MNI template space, the FMRIB Software Library (FSL, http://fsl.fmrib.ox.ac.uk/fsl) tract-based spatial statistics toolbox steps 1–2 (ie, preprocessing, brain mask extraction with FA >0.2, and normalization) were used for registration of all participants’ FA into the FSL 1-mm white matter skeleton template. The transformation of the individual FA data to the FSL MNI (1-mm isotropic resolution) common space was implemented with the nonlinear registration tool FNIRT based on a b-spline representation of the registration warp field. The same normalization parameters from individual FA to template space were applied to the other DTI and DKI maps of each subject. Hypothalamus region of interest (ROI)-based diffusion values of each subject were derived by averaging diffusional measures (after downsampled to 2-mm resolution) within hypothalamus mask, and were used for later statistical analyses.
RS-FMRI ANALYSIS
All the fMRI data were checked to have acceptable movement artifacts range with head motion ≤2 mm.29 We used 3D high-resolution T1-MPRAGE for image coregistration and normalization. To generate functional connectivity map using seed-based analysis, the seed region was selected in the whole hypothalamus (Fig. 1) for computing the Pearson’s correlation between the preprocessed average time series of the seed and each voxel within the whole brain area.8 The resultant values of Z-transformed (using Fisher’s r-to-z transform) map were used for subsequent group-level analysis.29
Statistical Analysis
A one-sample t-test was used to derive the hypothalamic connectivity network in both groups for either a positive (z >0) or negative (z <0) correlation map. In order to improve the test specificity, the optimal threshold was applied with Gaussian random field clustering corrected P < 0.05 and cluster size K > 20 with a 25% gray matter mask from the FSL standard template.21 This integrated threshold was used with a significant level for small-volume correction to the whole brain in order to remove false-positive error and maintain true-positive sensitivity. For comparison of RS-fcMRI maps between patients and controls, a two-sample t-test was used. The same empirical threshold of P < 0.05 and cluster size K > 20 were used for functional connectivity MRI (fcMRI) results after applying a 25% gray matter mask from the FSL standard template.
Globally, the number of voxels connected from hypothalamus (ie, nonzero fcMRI from hypothalamus) was computed across subjects for each group and compared with a two-sample t-test as well. Hypothalamic regional DKI parameters were also compared with the two-sample t-test between two groups, and Pearson correlation was performed between the DKI parameters and the fatigue scores in the patient group.
Results
No visible traumatic lesions were seen on conventional imaging such as T2 or susceptibility weighted imaging (SWI). The group mean kurtosis map of control and MTBI patients is shown in Fig. 2a,b, respectively, indicating lower mean kurtosis in the lateral and posterior portion of the hypothalamic region in MTBI patients. There were significantly reduced kurtosis values of MK (P = 0.0092) and Krad (P = 0.0078), but not Kax (P = 0.1528), in MTBI patients as compared to controls (Fig. 3) in the hypothalamus. We did not find statistical difference of hypothalamic FA (P = 0.5733) or MD (P = 0.4648) between these two groups. Diffusion measurements of hypothalamus including indices from DTI (FA, MD) and kurtosis imaging (MK, Krad, and Kax) in patients and controls are listed in Table 1. In patients with MTBI, there was a significantly higher fatigue z-score than the control group (28.0 ± 16.2 vs. 16.0 ± 8.0, P = 0.005). Furthermore, there was a significant negative correlation (r = −0.675, P = 0.0007) between Krad measured in the hypothalamus and fatigue severity scale in MTBI patients (Fig. 4).
FIGURE 2.
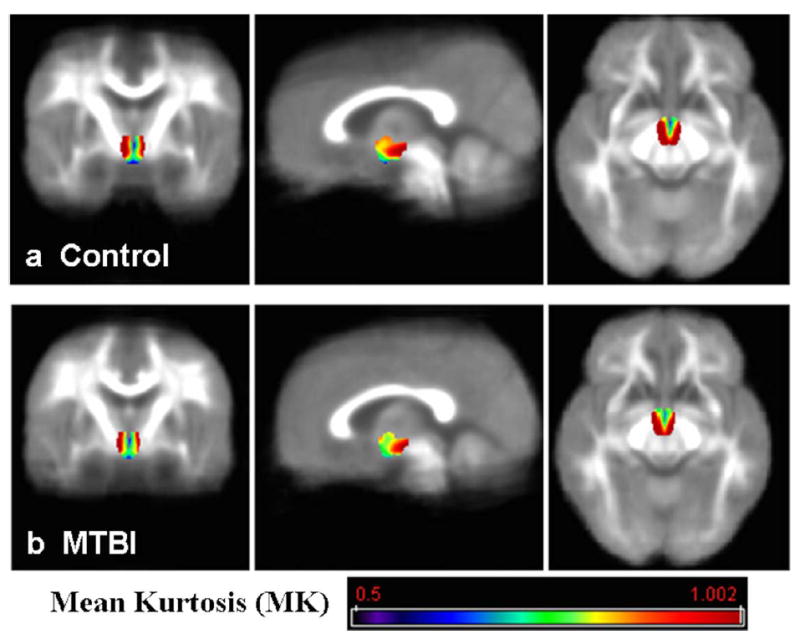
Hypothalamic mean kurtosis (MK) group mean map from control group (a) and MTBI group (b), shown in color and overlaid on each group mean MK background. Reduced mean kurtosis in the lateral and posterior portion in the hypothalamus in MTBI patients compared to controls can be appreciated.
FIGURE 3.
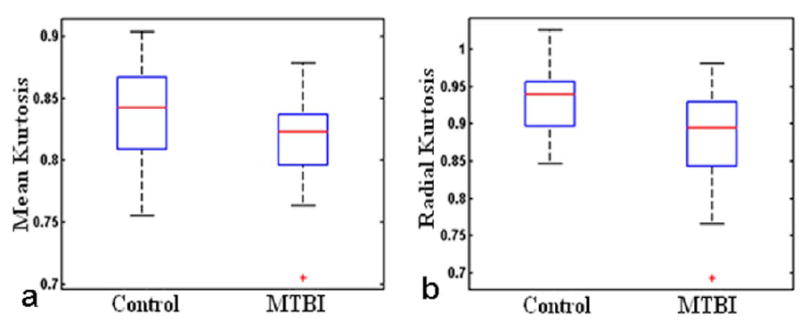
Significantly reduced kurtosis values of mean kurtosis (MK) (P = 0.0092) and radial kurtosis (Krad) (P = 0.0078) in patients as compared to controls.
TABLE 1.
Diffusion differences in MTBI patients compared to controls. Significant differences, namely reduced mean kurtosis (MK) and radial kurtosis (Krad) were highlighted in BOLD. However, there are no significant differences (p>0.05) of other DKI parameters including conventional FA and MD, and axial kurtosis (Kax)
| Measures | Controls | MTBI Patients | P-value |
|---|---|---|---|
| FA | 0.23 ±0.02 | 0.22 ±0.02 | 0.5733 |
| MD | 1.40 ±0.14 | 1.37 ±0.12 | 0.4648 |
| MK | 0.84 ±0.04 | 0.81 ±0.04 | 0.0092 |
| Krad | 0.93 ±0.05 | 0.88 ±0.07 | 0.0078 |
| Kax | 0.72 ±0.04 | 0.70 ±0.03 | 0.1528 |
FIGURE 4.
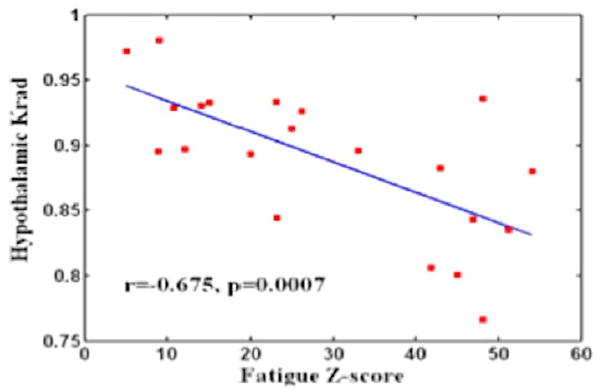
A significant negative correlation (r = −0.675, P = 0.0007) was found between the hypothalamic radial kurtosis (Krad) and the fatigue score across MTBI subjects who had significantly higher scores than normal controls (P = 0.005).
Using seed-based methods, a symmetric normal pattern of hypothalamic connectivity of both positive and negative correlations was shown in the healthy control group (corrected P < 0.05, K > 20; Fig. 5a). The functional network with positive correlation primarily involved brain stem, deep gray matter, and several focal cortical areas. More specifically, these regions include bilateral hypothalamus, tuberomamillary nucleus, thalamus, putamen, caudate, basal forebrain, medial prefrontal and inferior parietal cortex, small superior amygdala region; the locus coeruleus in the medial portion of brain stem, and raphe nuclei. The functional network with negative correlation primarily involved the visual and primary motor cortices. Compared to the control group, the MTBI group (corrected P < 0.05, K > 20; Fig. 5b) showed disrupted hypothalamic fcMRI, which demonstrated significantly decreased positive connectivity in the medial prefrontal cortex, inferior posterior parietal, and cingulate regions and increased connectivity in the peri-hypothalamic regions and cerebellum. In addition, the patient group also showed significantly decreased negative RSNs in the visual and bilateral premotor areas (corrected P < 0.05).
FIGURE 5.
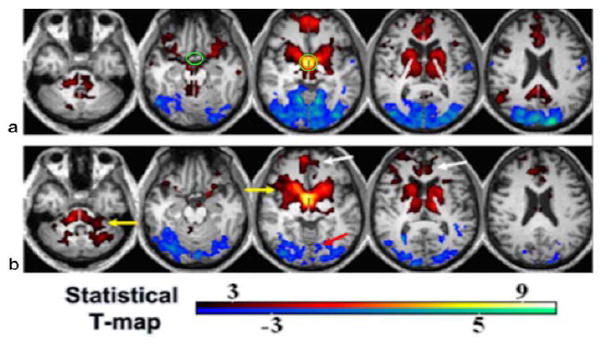
Hypothalamic resting-state network (RSN) in controls (a) and MTBI patients (b) using seed-based one-sample t-test and corrected P < 0.05. Green circle in (a) marks the hypothalamic ROI. Red-yellow color indicates positive correlation, while blue-cyan indicates negative correlation. There was significantly decreased connectivity in MTBI in both positive (white arrows) and negative (red arrow) networks and increased RSN (yellow arrows) using a two-sample t-test (P < 0.05).
Figure 6a shows the statistical difference image comparing the functional connectivity maps seeded from hypothalamus between the two groups with control > MTBI shown in warm red color that mainly localizes in temporal, medial prefrontal, posterior cingulate, right inferior parietal, supplementary motor, and control < MTBI shown in blue color primarily in the visual and bilateral premotor areas (corrected P < 0.05, K > 20, 25% gray matter mask). There was a significantly higher number of hypothalamic-connected voxels (ie, fcMRI) in MTBI patients compared to the control group (279,282 ± 7990 vs. 272,813 ± 9012, P = 0.015) (Fig. 6b), which might come from the reduced suppression of occipital cortex connections in MTBI as shown in Fig. 5b. Although both structural (by kurtosis imaging) and functional connectivity (by RS-fMRI) measures showed hypothalamic abnormalities, there was no direct association between the changes of diffusion kurtosis and the number of voxels of hypothalamic RSNs (r < 0.14, P > 0.5).
FIGURE 6.
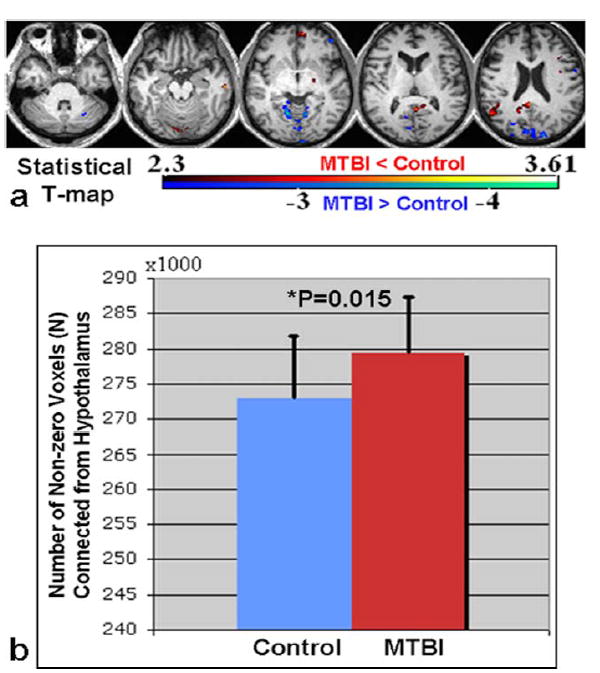
a: Statistical difference map comparing hypothalamic fcMRI between two groups (red-yellow indicates CT > MTBI contrast while blue-cyan indicates CT < MTBI with cluster corrected P < 0.05). b: Globally, the number of voxels connected from hypothalamus to the whole brain with nonzero correlation was also significantly higher in MTBI patients compared to controls (P = 0.015).
Discussion
Injury to the hypothalamus can occur following a traumatic accident through either shearing that cause diffuse axonal injury within its pathway and damage to its cell bodies which extends through the skull due to the coup/contrecoup forces.32 In the case of MTBI, it is now believed that even when no evidence based on conventional methods including imaging of hypothalamic dysfunction, repeated screening should be conducted up to 3 years postinjury in order to detect the development of hypothalamic symptoms due to the potential subclinical damage causing apoptosis and atrophy in the hypothalamus.33 Our results demonstrated both microstructural and functional connectivity abnormalities of hypothalamus in these MTBI patients at a relatively early stage after injury (<2 months), indicating DKI and RS-fMRI have the potential to provide objective measures in patients with hypothalamic symptoms that are difficult to explain with conventional MRI.
Our findings of different sensitivities of DKI and DTI in hypothalamic injury in MTBI may suggest that DKI is more useful in detecting microstructural tissue complexity changes than conventional DTI, particularly in gray matter, which has predominant isotropic Gaussian diffusion.25,34 Furthermore, significant negative correlation between hypothalamic radial kurtosis and fatigue score suggested that MTBI patients with a higher severity of fatigue had lower Krad, possibly due to decreased tissue complexity within the hypothalamus after injury. The changes of hypothalamic RSNs in patients suggest disrupted intrinsic functional networks after injury, consistent with recent findings.35,36 The significantly decreased functional connectivity with basal forebrain (one of the orexin projecting sites) and medial prefrontal area in MTBI may be due to direct injury (ie, diffuse axonal injury), while decreased negative connectivity in occipital regions in MTBI is probably due to the reduced antiphase synchronization between hypothalamus and occipital cortex.8 However, increased hypothalamic connectivity within peri-hypothalamic regions and cerebellum and global fcMRI from hypothalamic may indicate the compensative mechanism with functional reorganization or hypothalamic reactivity after injury.
Direct localization of the hypothalamus with an fMRI experiment such as visual food demonstrated lower hypothalamic activity in MTBI patients compared to controls (Supplementary Material). Implementation of visual-food-based fMRI task studies with more subjects are expected. Recent technical development of DKI including incorporating perfusion in the intravoxel incoherent motion (IVIM) in the kurtosis imaging and modeling, evaluating the robustness of the techniques in healthy subjects with aging and regional quantifications, are possible future directions.37,38 Further applications in differentiating different types of tumor and glioma, and extension to whole-body imaging, have demonstrated promising results of the extra-dimensionality kurtosis for characterizing tissue complexity in addition to conventional DTI parameters.39,40 Although there is supportive evidence of the DKI and RS-fMRI techniques implemented in this study, currently our results are still limited to a small sample size. The MTBI patient is, by definition, a heterogeneous disease population due to different injury mechanisms and various brain injury sites of each individual,8 which might complicate the results interpretation without careful adjustment for these effects. Further recruitments of more patients and demographic-matched controls, as well as stratification of the MRI results by injury causes and relating time phases to imaging findings to help solve this problem, are warranted in the near future. Due to time limitations, there were only two nonzero b-values with the DKI sequence; acquiring more b-values with accelerated techniques could help to further characterize the compartmental microstructural changes in MTBI. Examining the brain injury mechanism and effects with more advanced multi-parametric imaging metrics including iron depositions, oxidative metabolism, and perfusion are expected.41,42 Studying the longitudinal follow-up structural and functional imaging changes in MTBI patients including the volumetric findings to characterize the full-spectrum possible persistent brain changes in these patients is also expected.
In conclusion, since the hypothalamus is a spatially and functionally heterogeneous structure with complex bimodal functional features, the diffusional and functional RS- and task-related MRI techniques will provide supplementary information regarding structural and functional abnormalities. Our results of disruption of functional and structural hypothalamic connectivity and activity in patients with MTBI and significant correlation with fatigue symptoms might help to resolve an array of clinical symptoms in MTBI related to sleep disturbance and fatigue due to orexin level changes.
Supplementary Material
Acknowledgments
Contract grant sponsor: National Institutes of Health (NIH); contract grant number: NIH-RO1 NS039135-10.
Footnotes
Additional Supporting Information may be found in the online version of this article.
References
- 1.Silver JM, McAllister TW, Yudofsky SC. Textbook of traumatic brain injury. 2. Arlington, VA: American Psychiatric Publishing; 2011. [Google Scholar]
- 2.Jantzen KJ. Functional magnetic resonance imaging of mild traumatic brain injury. J Head Trauma Rehabil. 2010;25:256–266. doi: 10.1097/HTR.0b013e3181e5477c. [DOI] [PubMed] [Google Scholar]
- 3.Wu X, Kirov II, Gonen O, Ge Y, Grossman RI, Lui YW. MR imaging applications in mild traumatic brain injury: an imaging update. Radiology. 2016;279:693–707. doi: 10.1148/radiol.16142535. [DOI] [PMC free article] [PubMed] [Google Scholar]
- 4.Castriotta RJ, Wilde MC, Lai JM, Atanasov S, Masel BE, Kuna ST. Prevalence and consequences of sleep disorders in traumatic brain injury. J Clin Sleep Med. 2007;3:349–356. [PMC free article] [PubMed] [Google Scholar]
- 5.Baumann CR, Werth E, Stocker R, Ludwig S, Bassetti CL. Sleep-wake disturbances 6 months after traumatic brain injury: a prospective study. Brain. 2007;130(Pt 7):1873–1883. doi: 10.1093/brain/awm109. [DOI] [PubMed] [Google Scholar]
- 6.Childers MK, Rupright J, Jones PS, Merveille O. Assessment of neuroendocrine dysfunction following traumatic brain injury. Brain Inj. 1998;12:517–523. [PubMed] [Google Scholar]
- 7.Fichtenberg NL, Zafonte RD, Putnam S, Mann NR, Millard AE. Insomnia in a post-acute brain injury sample. Brain Inj. 2002;16:197–206. doi: 10.1080/02699050110103940. [DOI] [PubMed] [Google Scholar]
- 8.Zhou Y, Kierans A, Kenul D, et al. Mild traumatic brain injury: longitudinal regional brain volume changes. Radiology. 2013;267:880–890. doi: 10.1148/radiol.13122542. [DOI] [PMC free article] [PubMed] [Google Scholar]
- 9.Petchprapai N, Winkelman C. Mild traumatic brain injury: determinants and subsequent quality of life. A review of the literature. J Neurosci Nurs. 2007;39:260–272. [PubMed] [Google Scholar]
- 10.Nunez A, Rodrigo-Angulo ML, Andres ID, Garzon M. Hypocretin/ orexin neuropeptides: participation in the control of sleep-wakefulness cycle and energy homeostasis. Curr Neuropharmacol. 2009;7:50–59. doi: 10.2174/157015909787602797. [DOI] [PMC free article] [PubMed] [Google Scholar]
- 11.Assaf Y, Holokovsky A, Berman E, Shapira Y, Shohami E, Cohen Y. Diffusion and perfusion magnetic resonance imaging following closed head injury in rats. J Neurotrauma. 1999;16:1165–1176. doi: 10.1089/neu.1999.16.1165. [DOI] [PubMed] [Google Scholar]
- 12.Bendlin BB, Ries ML, Lazar M, et al. Longitudinal changes in patients with traumatic brain injury assessed with diffusion-tensor and volumetric imaging. Neuroimage. 2008;42:503–514. doi: 10.1016/j.neuroimage.2008.04.254. [DOI] [PMC free article] [PubMed] [Google Scholar]
- 13.Kraus MF, Susmaras T, Caughlin BP, Walker CJ, Sweeney JA, Little DM. White matter integrity and cognition in chronic traumatic brain injury: a diffusion tensor imaging study. Brain. 2007;130(Pt 10):2508–2519. doi: 10.1093/brain/awm216. [DOI] [PubMed] [Google Scholar]
- 14.Lipton ML, Gellella E, Lo C, et al. Multifocal white matter ultrastructural abnormalities in mild traumatic brain injury with cognitive disability: a voxel-wise analysis of diffusion tensor imaging. J Neurotrauma. 2008;25:1335–1342. doi: 10.1089/neu.2008.0547. [DOI] [PubMed] [Google Scholar]
- 15.Jensen JH, Helpern JA, Ramani A, Lu H, Kaczynski K. Diffusional kurtosis imaging: the quantification of non-Gaussian water diffusion by means of magnetic resonance imaging. Magn Reson Med. 2005;53:1432–1440. doi: 10.1002/mrm.20508. [DOI] [PubMed] [Google Scholar]
- 16.Tabesh A, Jensen JH, Ardekani BA, Helpern JA. Estimation of tensors and tensor-derived measures in diffusional kurtosis imaging. Magn Reson Med. 2011;65:823–836. doi: 10.1002/mrm.22655. [DOI] [PMC free article] [PubMed] [Google Scholar]
- 17.Stokum JA, Sours C, Zhuo J, Kane R, Shanmuganathan K, Gullapalli RP. A longitudinal evaluation of diffusion kurtosis imaging in patients with mild traumatic brain injury. Brain Inj. 2015;29:47–57. doi: 10.3109/02699052.2014.947628. [DOI] [PubMed] [Google Scholar]
- 18.Biswal B, Yetkin FZ, Haughton VM, Hyde JS. Functional connectivity in the motor cortex of resting human brain using echo-planar MRI. Magn Reson Med. 1995;34:537–541. doi: 10.1002/mrm.1910340409. [DOI] [PubMed] [Google Scholar]
- 19.Cordes D, Haughton VM, Arfanakis K, et al. Frequencies contributing to functional connectivity in the cerebral cortex in “resting-state” data. AJNR Am J Neuroradiol. 2001;22:1326–1333. [PMC free article] [PubMed] [Google Scholar]
- 20.Damoiseaux JS, Rombouts SA, Barkhof F, et al. Consistent resting-state networks across healthy subjects. Proc Natl Acad Sci U S A. 2006;103:13848–13853. doi: 10.1073/pnas.0601417103. [DOI] [PMC free article] [PubMed] [Google Scholar]
- 21.Zhou Y, Lui YW, Zuo XN, et al. Characterization of thalamo-cortical association using amplitude and connectivity of functional MRI in mild traumatic brain injury. J Magn Reson Imaging. 2014;39:1558–1568. doi: 10.1002/jmri.24310. [DOI] [PMC free article] [PubMed] [Google Scholar]
- 22.Smith DH, Meaney DF, Shull WH. Diffuse axonal injury in head trauma. J Head Trauma Rehabil. 2003;18:307–316. doi: 10.1097/00001199-200307000-00003. [DOI] [PubMed] [Google Scholar]
- 23.Sacco K, Gabbatore I, Geda E, et al. Rehabilitation of communicative abilities in patients with a history of TBI: behavioral improvements and cerebral changes in resting-state activity. Front Behav Neurosci. 2016;10:48. doi: 10.3389/fnbeh.2016.00048. [DOI] [PMC free article] [PubMed] [Google Scholar]
- 24.Kim J, Whyte J, Patel S, et al. Resting cerebral blood flow alterations in chronic traumatic brain injury: an arterial spin labeling perfusion FMRI study. J Neurotrauma. 2010;27:1399–1411. doi: 10.1089/neu.2009.1215. [DOI] [PMC free article] [PubMed] [Google Scholar]
- 25.Nakashima T, Nakayama N, Miwa K, Okumura A, Soeda A, Iwama T. Focal brain glucose hypometabolism in patients with neuropsychologic deficits after diffuse axonal injury. AJNR Am J Neuroradiol. 2007;28:236–242. [PMC free article] [PubMed] [Google Scholar]
- 26.Cauda F, Micon BM, Sacco K, et al. Disrupted intrinsic functional connectivity in the vegetative state. J Neurol Neurosurg Psychiatry. 2009;80:429–431. doi: 10.1136/jnnp.2007.142349. [DOI] [PubMed] [Google Scholar]
- 27.Hillary FG, Slocomb J, Hills EC, et al. Changes in resting connectivity during recovery from severe traumatic brain injury. Int J Psychophysiol. 2011;82:115–123. doi: 10.1016/j.ijpsycho.2011.03.011. [DOI] [PubMed] [Google Scholar]
- 28.Mayer AR, Mannell MV, Ling J, Gasparovic C, Yeo RA. Functional connectivity in mild traumatic brain injury. Hum Brain Mapp. 2011;32:1825–1835. doi: 10.1002/hbm.21151. [DOI] [PMC free article] [PubMed] [Google Scholar]
- 29.Zhou Y, Milham MP, Lui YW, et al. Default-mode network disruption in mild traumatic brain injury. Radiology. 265:882–892. doi: 10.1148/radiol.12120748. [DOI] [PMC free article] [PubMed] [Google Scholar]
- 30.Grossman EJ, Ge Y, Jensen JH, et al. Thalamus and cognitive impairment in mild traumatic brain injury: a diffusional kurtosis imaging study. J Neurotrauma. 2012;29:2318–2327. doi: 10.1089/neu.2011.1763. [DOI] [PMC free article] [PubMed] [Google Scholar]
- 31.Krupp LB, LaRocca NG, Muir-Nash J, Steinberg AD. The fatigue severity scale. Application to patients with multiple sclerosis and systemic lupus erythematosus. Arch Neurol. 1989;46:1121–1123. doi: 10.1001/archneur.1989.00520460115022. [DOI] [PubMed] [Google Scholar]
- 32.Kolassa IT, Wienbruch C, Neuner F, et al. Altered oscillatory brain dynamics after repeated traumatic stress. BMC Psychiatry. 2007;7:56. doi: 10.1186/1471-244X-7-56. [DOI] [PMC free article] [PubMed] [Google Scholar]
- 33.Yount R, Raschke KA, Biru M, et al. Traumatic brain injury and atrophy of the cingulate gyrus. J Neuropsychiatry Clin Neurosci. 2002;14:416–423. doi: 10.1176/jnp.14.4.416. [DOI] [PubMed] [Google Scholar]
- 34.Long JA, Watts LT, Chemello J, Huang S, Shen Q, Duong TQ. Multiparametric and longitudinal MRI characterization of mild traumatic brain injury in rats. J Neurotrauma. 2015;32:598–607. doi: 10.1089/neu.2014.3563. [DOI] [PMC free article] [PubMed] [Google Scholar]
- 35.Zhou Y, Lui YW. Changes in brain organization after TBI: evidence from functional MRI findings. Neurology. 2013;80:1822–1823. doi: 10.1212/WNL.0b013e318292a37d. [DOI] [PubMed] [Google Scholar]
- 36.Delouche A, Attye A, Heck O, et al. Diffusion MRI: pitfalls, literature review and future directions of research in mild traumatic brain injury. Eur J Radiol. 2016;85:25–30. doi: 10.1016/j.ejrad.2015.11.004. [DOI] [PubMed] [Google Scholar]
- 37.Wong PK. Susceptibility-weighted MRI in mild traumatic brain injury. Neurology. 2015;85:921. [PubMed] [Google Scholar]
- 38.Hahnel S, Herweh C. MRI biomarkers in mild traumatic brain injury. Neurology. 2015;84:554–555. doi: 10.1212/WNL.0000000000001244. [DOI] [PubMed] [Google Scholar]
- 39.Pang H, Ren Y, Dang X, et al. Diffusional kurtosis imaging for differentiating between high-grade glioma and primary central nervous system lymphoma. J Magn Reson Imaging. 2016;44:30–40. doi: 10.1002/jmri.25090. [DOI] [PubMed] [Google Scholar]
- 40.Rosenkrantz AB, Padhani AR, Chenevert TL, et al. Body diffusion kurtosis imaging: basic principles, applications, and considerations for clinical practice. J Magn Reson Imaging. 2015;42:1190–1202. doi: 10.1002/jmri.24985. [DOI] [PubMed] [Google Scholar]
- 41.Jensen JH, Helpern JA. Effect of gradient pulse duration on MRI estimation of the diffusional kurtosis for a two-compartment exchange model. J Magn Reson. 2011;210:233–237. doi: 10.1016/j.jmr.2011.03.012. [DOI] [PMC free article] [PubMed] [Google Scholar]
- 42.Zhou Y, Wang W, Kenul D, et al. Detection of mild traumatic brain injury utilizing multifeature analysis of MRI. Proc 21st Annual Meeting ISMRM; Salt Lake City. 2013. p. 2688. [Google Scholar]
Associated Data
This section collects any data citations, data availability statements, or supplementary materials included in this article.


