

Abstract
The toxicity of mercury is often attributed to its tight binding to cysteine thiolate anions in vital enzymes. To test our hypothesis that Hg(II) binding to histidine could be a significant factor in mercury's toxic effects, we studied the enzyme chymotrypsin, which lacks free cysteine thiols; we found that chymotrypsin is not only inhibited, but also denatured by Hg(II). We followed the aggregation of denatured enzyme by the increase in visible absorbance due to light scattering. Hg(II)‐induced chymotrypsin precipitation increased dramatically above pH 6.5, and free imidazole inhibited this precipitation, implicating histidine‐Hg(II) binding in the process of chymotrypsin denaturation/aggregation. Diethylpyrocarbonate (DEPC) blocked chymotrypsin's two histidines (his40 and his57) quickly and completely, with an IC50 of 35 ± 6 µM. DEPC at 350 µM reduced the hydrolytic activity of chymotrypsin by 90%, suggesting that low concentrations of DEPC react with his57 at the active site catalytic triad; furthermore, DEPC below 400 µM enhanced the Hg(II)‐induced precipitation of chymotrypsin. We conclude that his57 reacts readily with DEPC, causing enzyme inhibition and enhancement of Hg(II)‐induced aggregation. Above 500 µM, DEPC inhibited Hg(II)‐induced precipitation, and [DEPC] >2.5 mM completely protected chymotrypsin against precipitation. This suggests that his40 reacts less readily with DEPC, and that chymotrypsin denaturation is caused by Hg(II) binding specifically to the his40 residue. Finally, we show that Hg(II)‐histidine binding may trigger hemoglobin aggregation as well. Because of results with these two enzymes, we suggest that metal‐histidine binding may be key to understanding all heavy metal‐induced protein aggregation.
Keywords: protein denaturation, mercury toxicity, enzyme inhibition, metal–protein binding
Introduction
Some mercury compounds are known to be quite toxic,1 thus mercury is considered a major environmental pollutant.2 It has three oxidation states—0, I, and II—and can be found in three major forms: elemental mercury (0), inorganic mercury (I, II), and organic or organo‐mercury.3 Mercury species differ significantly in properties, but all are toxic.4 Diethylmercury and dimethylmercury are considered “supertoxic”—a fatal dose of dimethylmercury requires absorption of less than two drops (100 µL, or 1.3 mmol).5
A key theme of mercury toxicology is the metabolic conversion of elemental and organo‐mercury into inorganic mercury.1 Elemental mercury vapor and organo‐mercury compounds both have high bioavailability, as they easily permeate biological membranes and thus spread throughout the body. Intestinal microflora and cellular enzymes degrade organo‐mercury compounds (e.g., methylmercury) to Hg2+, after which the inorganic Hg2+ accumulates in the central nervous system and the kidney.3, 6, 7, 8 The strong association of inorganic mercury with the kidney is traced to binding of Hg2+ to proteins containing thiols (e.g., cysteine) as well as thioethers (e.g., methionine).9
The toxic effects exerted by mercury compounds are most often attributed to the tight binding of Hg2+ to cysteine‐thiol and seleno‐cysteine residues of critical enzymes (Fig. 1).9, 10, 11, 12 Hg2+ binding causes a number of dramatic changes to the SH group: Hg2+ is much larger than the H that it replaces; the nucleophilicity of the S atom is dramatically reduced; and loss of H makes the group nonacidic. Clearly, if the —SH group is key to enzyme activity, it is easy to see how Hg2+ binding might well curtail such activity. What is often not appreciated however is that Hg2+ (and other heavy metal cations) can also cause proteins to unfold, aggregate, and precipitate out of solution.13, 14, 15, 16, 17, 18, 19 In fact, the Merck Index notes that aqueous mercuric chloride “coagulates albumin.”20 Thus there are two distinct mechanisms by which Hg2+ can inhibit enzymes.
Figure 1.
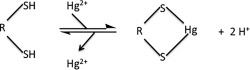
Hg2+ binds to two nearby cysteine‐thiols.
Myshkin et al.14, 15, 21, 22, 23 have found that the metal‐induced aggregation of hemoglobin depends on Hg2+ binding to a noncysteine side chain along with cysteine‐β93, and that interfering with Hg2+‐non‐cysteine binding protects against aggregation.21, 22, 24 Because Hg2+ binding to cysteine thiols is already well‐characterized, we set out to study Hg2+ inhibition of enzymes that lack accessible cysteine sites. Chymotrypsin, a digestive enzyme found in the small intestine, hydrolyzes protein peptide bonds,25, 26 and it lacks free cysteine‐thiols because its ten cysteines are oxidized to five disulfide bridges and are thus effectively protected from mercury binding.26 Chymotrypsin is thus a good model for studying Hg2+ inhibition due to interaction with non‐cysteine amino acid side chains. Furthermore, its hydrolytic activity is easily assayed using chromophoric peptide substrates.
In the absence of accessible cysteine side chains, histidine is a potential binding candidate for Hg2+. Applying hard‐soft acid base theory, mercury, a soft acid, should have a moderate affinity for nitrogen‐based molecules.27 The formation constants (logK f) for various 1:1 Hg2+:ligand complexes are listed in Table 1. Although Hg‐N K fs are 7‐11 orders of magnitude lower than Hg‐S K fs, Hg2+ still has a moderate affinity for N ligands. Specifically, K f for the Hg2+‐histidine and Hg2+‐histidine‐methyl ester complexes are 107. 28 and 105. 33, respectively. Similarly, results from isothermal titration calorimetry yield K f = 107.85 for Hg2+‐histidine (cf., 1011.76 for Hg2+‐cysteine).30 Hence it is reasonable to expect Hg2+ to bind to histidine, as well as cysteine, side chains.
Table 1.
| S‐Ligand | Log K f | N‐Ligand | Log K f |
|---|---|---|---|
| S2‐ | 52.7 | NH3 | 8.8 |
| Mercaptosuccinic acid | 16.3 | CH3NH2 | 8.66 |
| Mercaptoacetic acid | 15.9 | Pyridine | 5.1 |
| β‐mercaptoethanol | 15.1 | Imidazole | 3.57 |
| Cysteine | 14.4 | Histidine | 7.28 |
| Histidine‐Me‐ester | 5.33 |
Chymotrypsin has two histidines: his57 is part of the active site catalytic triad, and his40 lies near the active site. The effects of Hg2+ on chymotrypsin can be easily assayed through two means: hydrolytic activity, and denaturation leading to aggregation. Mercury‐denatured chymotrypsin aggregates, causing an increase in turbidity; the increased light scattering is easily measured by monitoring low wavelength absorbance,31 for example at 350 nm, and this effective absorbance has been shown to correlate directly (i.e., linearly) with the amount of aggregated/precipitated protein.32 The hydrolytic activity of chymotrypsin can be assayed spectrophotometrically at 410 nm using the chromophoric substrates p‐nitrophenyl acetate (an ester) or N‐succinyl‐l‐phenylalanine‐p‐nitroanilide (an amide), as depicted in Figure 2. Both the amide and ester substrates are hydrolyzed by chymotrypsin to form the yellow chromophores p‐nitroaniline and p‐nitrophenoxide, respectively (Fig. 2).
Figure 2.
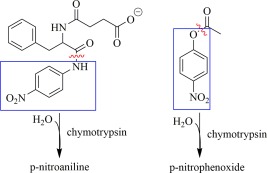
Chymotrypsin chromophoric substrates: Left, the amide N‐succinyl‐l‐phenylalanine‐p‐nitroanilide, and right, the ester p‐nitrophenyl acetate. Hydrolytic cleavage sites are indicated by red ∼, and the chromophoric products are boxed (blue).
Results
Hg2+‐induced precipitation of chymotrypsin is moderately inhibited by acetate
In the presence of Hg2+, chymotrypsin denatures and aggregates; the resulting particles scatter light, causing an increase in turbidity which can be assayed by the increase in absorbance at low wavelengths, for example, 350 nm (Fig. 3). The increase in A 350 with time could almost always be fit to double first‐order kinetics [Eq. (5)]. For the control experiment in Figure 3(A) (without added acetate, black curve), k fast = 13.28 ± 0.07 min−1, ΔA 350,fast = 0.3656 ± 0.0013, and A final = 1.0045 ± 0.0002.
Figure 3.
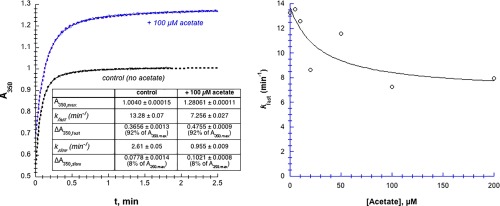
Acetate moderately inhibits Hg2+‐induced aggregation of chymotrypsin. [chymotrypsin] = 20 µM, 50 mM MOPS at pH 7.23, [Hg2+] = 1.025 mM. (A) A350 transients are fit to double‐first order kinetics, that is, a fast first order phase followed by a slower first order phase (Eq. (5), dashed lines). (B) Data were fit to Eq. (3), but modified to decline to a non‐zero value (k fast,final) at infinite [acetate]. Parameters for the fitted curve are: k fast,0 = 14 ± 4 µM min−1, k fast,final = 6.9 ± 2.5 µM min−1, and IC50 = 30 ± 40 µM, R 2 = 0.71. Uncertainties in the first order fitted values of k are smaller than the point symbols.
Because chymotrypsin has no cysteine thiols available to bind with Hg2+ (all ten of chymotrypsin's cysteines are oxidized to disulfide bridges), the most likely side chains to interact with Hg2+ are histidine imidazoles and glutamate/aspartate carboxylates. To determine whether Hg2+ can interact with these groups, we examined whether the addition of free acetate or imidazole could inhibit the Hg2+‐induced chymotrypsin precipitation. In Figure 3(A) we see that the addition of 100 µM acetate decreased k fast by 45% (to 7.3 min−1), and increased A 350,max by 27% (to 1.28). In other words, added acetate slows down the rate of the fast phase of the precipitation reaction, but increases the overall amount of precipitation. The acetate‐dependence of k fast plotted in Figure 3(B) shows a maximum 50% decline in k fast, with IC50 ≈ 30 µM. Above 200 µM acetate, chymotrypsin aggregation slowed to the point that the absorbance transients were sigmoidal (data not shown). Thus, high concentrations of acetate cause a moderate decrease in the rate of Hg2+‐induced chymotrypsin precipitation.
Utilizing EDC and NHS to block carboxylates from binding to Hg2+
To further explore the nature of the interaction between Hg2+ and chymotrypsin carboxylate side chains, we attempted to block these sites using the carbodiimide EDC, with and without N‐hydroxysuccinimide (NHS, which forms a stable intermediate that enhances the EDC‐carboxylate reaction).33, 34, 35 EDC at 50 mM slowed the Hg2+‐induced chymotrypsin precipitation such that the absorbance transients became sigmoidal, as opposed to first order (data not shown). Furthermore, 5 mM EDC with 12.5 mM NHS also reduced the rate of precipitation to give sigmoidal absorbance transients (data not shown).
Although the results above suggested that EDC blocking of chymotrypsin carboxylates inhibited Hg2+‐induced precipitation, control experiments [Supporting Information Fig. S4, Eq. (S1)] showed that this effect was in fact due to direct interaction between EDC and Hg2+, thus keeping the Hg2+ from binding to chymotrypsin. It seems likely that EDC serves as a divalent chelator of Hg2+, and thus is not an effective carboxylate labeling reagent in the presence of Hg2+.
Hg2+‐induced precipitation of chymotrypsin is completely inhibited by imidazole
Imidazole dramatically inhibits Hg2+‐induced chymotrypsin precipitation (Fig. 4). Compared to the fast rate constant for chymotrypsin precipitation in the absence of imidazole (13.28 ± 0.07 s−1), k fast is 94% lower in 500 µM imidazole (0.902 ± 0.003 s−1); the fitted curve in Figure 4 shows IC 50 for imidazole = 78 µM. Unlike acetate, high concentrations of free imidazole bind Hg2+ sufficiently tightly to protect completely against chymotrypsin precipitation. Interestingly, we found that at ≥1 mM imidazole, Hg2+ caused precipitation in the absence of chymotrypsin; at ≥4 mM imidazole the precipitation reaction was so fast that the rate could not be measured. Hence at imidazole:Hg2+ stoichiometric ratios ≥ 1:1, an insoluble precipitate is formed.
Figure 4.
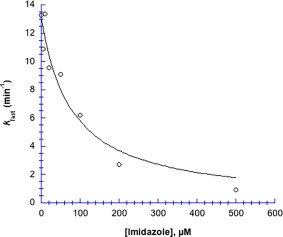
Imidazole inhibits the rate of Hg2+‐induced chymotrypsin aggregation. Data were fit to Eq. (3). Parameters for the fitted curve are: k fast,0 = 13.1 ± 0.8 µM min−1, and IC 50 = 78 ± 21 µM; R 2 = 0.94. [chymotrypsin] = 20 µM, 50 mM MOPS at pH 7.23, [Hg2+] = 1.025 mM. Uncertainties in the first order fitted values of k fast are smaller than the point symbols.
Hg2+‐induced precipitation of chymotrypsin is pH dependent
Comparing Figure 4 with Figure 3, we learn that imidazole interacts much more effectively with Hg2+ than acetate does, protecting against chymotrypsin precipitation. This is not surprising, considering the 14 order of magnitude difference for mercury binding to these two ligands: logK f for Hg(OAc)2(s) is 2.5 (calculated from its solubility of 0.09 M at 25°C), compared to 16.7 for the 1:2 mercury(II)‐imidazole complex.36 From these results we concluded that Hg2+ is more likely to bind strongly to chymotrypsin's two histidines than to its aspartates or glutamates. We therefore studied the pH‐dependence of the Hg2+‐induced chymotrypsin precipitation reaction (Fig. 5) to see if the reaction was enhanced above pH 6, the nominal aqueous pK a of histidine's imidazole side chain. Sure enough, although turbidity as measured by A350 was undetectable below pH 6.2 (green curve in Fig. 5), it was readily observed above pH 6.5; between pH 6.5–7.0 (blue curve), A350 increased sigmoidally with time. The lag time characteristic of sigmoidal kinetics is common for aggregation processes that proceed via a rate‐determining nucleation step.37, 38, 39 From pH 7.1 to 8.9 (black curve), the increase in A 350 was very fast and first order. Above pH 9 (red curve), the absorbance transients indicated a moderately fast first order increase in A 350, followed by a slower first order decrease. The slow decrease in light scattering above pH 9 was due to the sedimentation of highly aggregated particles and their removal from the path length of the cuvette (data not shown). The A 350 transients in Figure 5 demonstrate that the rate of Hg2+‐induced chymotrypsin denaturation/aggregation increases dramatically in the pH 6.5–7.1 range, commensurate with the nominal aqueous pK a of histidine's imidazole side chain.
Figure 5.
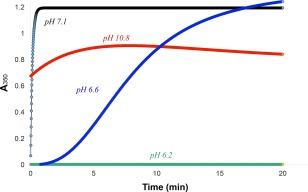
pH dependence of Hg2+‐induced precipitation of chymotrypsin. Buffers are: MES (green and blue); CAPS (red), and MOPS (black). Final concentrations: 20 µM chymotrypsin, 1.025 mM Hg2+, and all buffers are 50 mM.
Control experiments were performed to demonstrate that the turbidity that we observed was caused by the interaction between Hg2+ and chymotrypsin. No change in A 350 was observed at any pH in the absence of Hg2+ or chymotrypsin, and increases in the concentration of either Hg2+ or chymotrypsin led to increases in both the rate and extent of A 350 rise (Supporting Information Fig. S5). Precipitation was generally independent of buffer type, except for Tris and glycine. Tris buffer inhibited chymotrypsin precipitation (relative to other buffers at the same pH); such inhibition was expected, due to the ability of Tris (an amine compound) to bind tightly to Hg2+.21, 40 On the other hand, glycine buffer enhanced the precipitation to a degree that the rate was too fast to be measured. These buffers were avoided in future experiments due to their specific interactions with chymotrypsin and/or Hg2+.
We also performed some Hg2+‐chymotrypsin precipitation experiments in the absence of buffer (Fig. 6). Below pH 6.4, the precipitation first order rate constant was low and roughly pH‐insensitive (k = 0.41 ± 0.19 min−1), but above pH 6.4, k increased dramatically, reaching 2.75 min−1 (almost seven‐fold higher) at pH 6.95. These results, like those in Figure 5, suggested that Hg2+‐induced aggregation depends on the deprotonation of an acidic group with a pK a in the 6.5–7.0 range, again implicating histidine.
Figure 6.
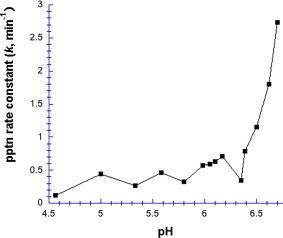
pH dependence of Hg2+‐induced precipitation of chymotrypsin, in the absence of buffer. [Chymotrypsin] = 20 µM, and [Hg2+] = 1.0 mM.
Activity of chymotrypsin remaining in solution after Hg2+‐induced precipitation
We have demonstrated that Hg2+ caused chymotrypsin denaturation and aggregation, but by centrifuging our samples and probing the supernatant, we were also able to show that Hg2+ inhibited the enzyme that remained in solution. To compare these two effects, we plotted both the percent of chymotrypsin remaining in solution and the relative activity of chymotrypsin remaining in solution, as a function of the concentration of Hg2+ (Fig. 7: N‐succinyl‐l‐phenylalanine p‐nitroanilide, an amide substrate, was used to assay the activity of chymotrypsin). It can be seen in Figure 7 that at 0.2 mM Hg2+, when more than 90% of chymotrypsin still remained in solution, the enzyme's hydrolytic activity was reduced by over 75%. This trend is very clear at the lower concentrations of Hg2+ (0.05–0.3 mM); at 0.5 mM Hg2+ and above, very little chymotrypsin remained in solution and what little did remain was completely inhibited (0% activity). The same trends were observed with the ester substrate pNPA (Supporting Information Fig. S7).
Figure 7.
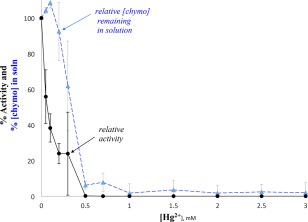
Hg2+ decreased how much chymotrypsin remained in solution, and chymotrypsin's activity. Each point is the average of three measurements, and y axis error bars = standard deviation; the activity of each set was normalized to the 0 mM concentration for that day. [chymotrypsin] calculated from A281 and ε281. Prior to Hg2+ additions, solutions contained 50 mM MOPS buffer, pH 7.14 and initial [chymo] = 20 µM. Final [succinyl phenylalanine] = 3 mM.
Although Hg2+ forms a coordinate (or dative) covalent bond with imidazole, we found that it behaved similar to a reversible noncompetitive inhibitor. Figure 8 shows the results of Michaelis–Menten experiments in the presence of 0–0.3 mM Hg2+, after removal of the precipitated enzyme; fitted Michaelis–Menten parameters are presented in Table 2. K m values ranged from 1 to 3 mM, and the differences between them were not statistically significant. On the other hand, k cat declined significantly: Compared to the control value, k cat was two‐fold lower in 0.1 mM Hg2+, and six‐fold lower in 0.2 mM Hg2+. (Note that at these two Hg2+ concentrations, 95% and 88% of the enzyme remained in solution. Even at 0.3 mM Hg2+, 72% remained in solution.) A decline in k cat with unaltered K m resembles the effect of a reversible noncompetitive inhibitor, one that leaves substrate binding unaltered while inhibiting the subsequent catalytic step. The experiment in the presence of 0.3 mM Hg2+ was anomalous, seeming to show an inordinately high K m (black Xs curve). Fitting to the Michaelis–Menten equation was unsuccessful, with P > 1 for V max and K m, indicating statistical insignificance; in other words, the points in this curve do not fit hyperbolic saturation.
Figure 8.
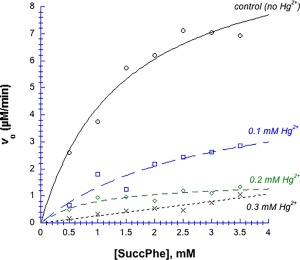
Michaelis–Menten plot of chymotrypsin in the presence of Hg2+, in 50 mM MOPS, pH 7.14. Substrate was the amide succ‐phe, data were fit to Eq. (2). Black circles = control (without Hg2+), blue squares = 0.1 mM Hg2+, green diamonds = 0.2 mM Hg2+, black Xs = 0.3 mM Hg2+. Final [chymotrypsin] remaining in solution, and all fitted Michaelis–Menten parameters are listed in Table II. For the 0.3 mM Hg2+ curve, V max and K m returned P values ≫ 1, indicating that these points do not fit hyperbolic saturation.
Table 2.
Michaelis–Menten Parameters for Chymotrypsin‐catalyzed Hydrolysis of Amide Substrate in the Presence of Hg2+
| [Hg2±], mM | [chymo] in solution, µM | V max, µM/min | k cat, min−1 | K m, mM | R 2 |
|---|---|---|---|---|---|
| 0 | 40.5 ± 0.7 | 10.5 ± 1.1 | 0.259 ± 0.028 | 1.5 ± 0.4 | 0.95 |
| 0.103 | 38.4 ± 1.2 | 5.2 ± 1.8 | 0.13 ± 0.05 | 2.9 ± 1.8 | 0.86 |
| 0.205 | 35.7 ± 1.8 | 1.56 ± 0.27 | 0.044 ± 0.008 | 1.0 ± 0.5 | 0.77 |
| 0.308 | 29.1 ± 2.7 | NSSa | NSS | NSS | 0.88 |
NSS = not statistically significant.
Histidine blocking with diethylpyrocarbonate
To further characterize the importance of chymotrypsin's histidines in Hg2+‐induced precipitation, we employed DEPC as a histidine‐blocking reagent. In kinetic studies we determined that after low‐concentration DEPC incubations of 5–10 min, chymotrypsin activity declined by 68% to a constant low rate (Supporting Information Fig. S6). This histidine blocking reaction followed first order kinetics, with k = 0.43 min−1 (Supporting Information Fig. S6).
Histidine blocking by DEPC inhibited chymotrypsin's hydrolytic activity quite effectively, with an IC 50 of 35 µM (Fig. 9). At 700 µM DEPC, enzyme activity was 83% inhibited, from v 0 (control) = 4.8 µM min−1 down to 0.4 µM min−1 (Fig. 9).
Figure 9.
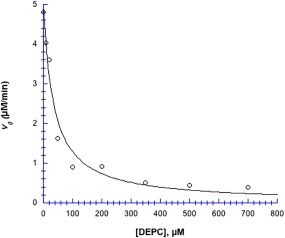
DEPC inhibitor profile. 40 µM chymotrypsin in 50 mM MOPS at pH 7.14, incubated with DEPC for 10 min, after which, the substrate pNPA was added to a final concentration of 2.9 mM. Data were fit to Eq. (3): v o (control) = 4.98 ± 0.27 µM min−1; IC 50 = 35 ± 6 µM; R 2 = 0.97. Uncertainties in v 0 values (obtained from ΔA 410/Δt slopes) are smaller than the point symbols.
DEPC concentration had a biphasic effect on the Hg2+‐induced precipitation of chymotrypsin (Fig. 10). Up to 500 µM, DEPC enhanced precipitation, increasing A 350,max by 30–35%; above 500 µM DEPC inhibited precipitation, and 2500 µM DEPC afforded complete protection against precipitation.
Figure 10.
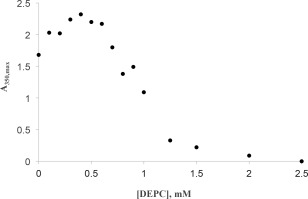
Effects of DEPC on Hg2+ induced chymotrypsin precipitation. Final cuvette concentrations: 40 µM chymotrypsin, 50 mM MOPS, pH 7.14, 0.410 mM HgCl2. Uncertainties in the first order fitted values of A350,max are smaller than the point symbols.
Discussion
Mercury and other toxic heavy metals disrupt cellular function by inhibiting or denaturing critical enzymes and proteins. Within these proteins, Hg2+ binds very tightly to cysteine or selenocysteine residues9, 10, 11, 12 with K f ≈ 1014−1016 (Table 1). However, Hg2+ also binds fairly tightly to imidazoles and amines (K f ≈ 105−109, Table 1), as well as carboxylates7, 8 (K f ≈ 103). The binding of Hg2+ to critical protein side chains can cause inhibition by changing the active site structure, or by causing general unfolding.10, 13, 41 Mercury is well‐known for its disruption of the active sites of a number of important anti‐oxidant enzymes and compounds (e.g., methionine synthase, thioredoxin reductase, glutathione reductase, glutathione peroxidase).3, 10, 12 It is less widely recognized that a number of divalent metal cations like Hg2+, Cd2+, Pb2+, Ni2+, and Zn2+ can bind to proteins, causing them to unfold, aggregate, and precipitate out of solution.13, 15, 16, 17, 18 Studies by the Myshkin group on oxy‐ and met‐hemoglobin showed that the binding of Hg2+ to cysteine thiols triggered surprisingly small changes in protein conformation, which nevertheless led to denaturation and aggregation.14, 15, 21 In the presence of substoichiometric concentrations of Hg2+, both mercurated and non‐mercurated hemoglobin were present, and though the mercurated protein more readily aggregated, the non‐mercurated form also participated in the formation of the aggregates.14 Finally, Hg2+ chelators like EDTA and thiourea protected hemoglobin against denaturation and precipitation.24
We found in this study that chymotrypsin, like hemoglobin, aggregates in the presence of Hg2+, and that this Hg2+‐induced precipitation can be inhibited by chelators [e.g., acetate, Fig. 3; imidazole, Fig. 4; and the carbodiimide EDC, Supporting Information Fig. S4 and Eq. (S1)]. Unlike hemoglobin, chymotrypsin lacks free cysteine thiols, as all ten of its cysteines are oxidized into disulfide bridges. Although Hg2+ can bind to one of the two S atoms in an S—S bond, such binding is generally weak in the absence of additional intramolecular chelation sites42, 43 (see section 9 in the Supporting Information for further discussion of this point). Hg2+ binding sites within chymotrypsin are therefore likely to be either aspartate/glutamate carboxylate side chains, or histidine imidazole side chains.
Our competition results showed that although free acetate inhibited Hg2+‐induced chymotrypsin precipitation moderately (40% decline in rate constant, IC50 = 30 µM, Fig. 3), inhibition by free imidazole was much more effective (>94% decline in rate constant, IC50 = 78 µM, Fig. 4). Our results (94% aggregation rate decline at a 25:1 imidazole:enzyme mole ratio) matched those of Myshkin and Khromova, who used histidine to inhibit hemoglobin aggregation (93% rate decline at a 30:1 histidine:enzyme mole ratio).22 Finally, at 1 mM imidazole, prior to the addition of chymotrypsin, Hg2+ and imidazole formed a precipitate. As the concentration of imidazole increased from 1 to 10 mM, the rate of precipitation increased dramatically. This indicated that when the imidazole:Hg2+ molar ratio is 1:1 or higher, a neutral mercury‐imidazole salt quickly precipitated out of solution. Imidazole‐Hg2+ precipitation is discussed further in section 10 of the Supporting Information and Figure S10.
Only a few authors have examined the influence of pH on metal‐induced protein aggregation. Mantyh et al.19 studied the aggregation of the β‐amyloid peptide induced by Fe3+, Al3+, and Zn2+, and found enhanced aggregation above pH 3–5, with pK a values around 4–6 for the aggregation increase. This suggested metal interaction with the following residue side chains within the β‐amyloid peptide: aspartate, glutamate, or histidine with a lowered pK a. Similar to Mantyh et al., we found that higher pH favored Hg2+‐induced chymotrypsin precipitation: Figures 5 and 6 show that the chymotrypsin precipitation rate increased dramatically above pH 6.4, indicating the importance of a deprotonated acidic side chain with a pK a around 6.5. Given that the nominal pKa of aqueous histidine is 6–7, all of these results suggest that the denaturation/aggregation of chymotrypsin is triggered by Hg2+ binding to deprotonated histidine side chain(s).
On the other hand, Myshkin and Khromova found that the rate of Hg2+‐induced aggregation of hemoglobin declined with increasing pH over the 7.2–8.1 range.23 They interpreted this as OH− binding to Hg2+ and hindering its ability to bind to the protein. However, these same authors showed that Tris buffer binds to Hg2+, displacing one of its protein ligands and inhibiting aggregation.21, 22 Because the pK a of Tris is 8.1, the concentration of its deprotonated conjugate base increases four‐fold over the 7.2 to 8.1 pH range, from 12 to 51% of total buffer. Thus, it seems more likely that the increase of deprotonated Tris and its subsequent increased binding to Hg2+ causes the aggregation inhibition. This Tris buffer effect, and the fact that hemoglobin contains two accessible cysteine thiols (β‐93) that are known to bind Hg2+, whereas chymotrypsin lacks reduced thiols, undoubtedly explain our difference in pH effects.
We have expanded the work of previous authors13, 14, 15, 17, 18, 21, 24 by studying not only enzyme aggregation induced by Hg2+, but also how Hg2+ inhibited the enzyme remaining in solution. In Figure 7, the discrepancy between percent chymotrypsin remaining in solution and percent relative activity revealed that at concentrations ≤0.2 mM, Hg2+ inhibited chymotrypsin in solution without causing precipitation. Michaelis–Menten plots (Fig. 8) showed that Hg2+ binding to aqueous chymotrypsin lowered k cat while leaving K m essentially unchanged. We conclude from these results that Hg2+‐histidine binding, although irreversible, results in enzyme inhibition similar to that of a reversible noncompetitive inhibitor. In other words, in the presence of Hg2+, chymotrypsin‐substrate binding is unaltered, while catalysis at the active site is shut down. This observation is supported by Henderson, who found that methylating chymotrypsin's histidines left substrate affinity (K m) unaltered.44 Above 0.2 mM, Hg2+ caused chymotrypsin to denature, resulting in aggregation and precipitation of the enzyme. At 0.5 mM Hg2+ and above, almost no chymotrypsin remained in solution, and hydrolytic activity was nil (Fig. 7).
As previously mentioned, chymotrypsin contains two histidines: his57 is a member of the active site catalytic triad, whereas his40 is located just a few Ångstroms behind the active site, through a crevice (Fig. 11). For example, his40 is close enough to hydrogen‐bond to the active site aspartate194 side chain when the N‐terminus is deprotonated at pH > 9, causing enzyme inhibition.45, 46 Within chymotrypsin's optimal pH range of 6–8, his40 does not influence the active site, whereas deprotonated his57 base‐catalyzes the critical ser195 nucleophile.45 The fact that Hg2+ ≤0.2 mM dramatically inhibits chymotrypsin activity (Figs. 7 and 8) indicates that Hg2+ may bind readily to his57, leaving it unable to participate in the catalytic mechanism of chymotrypsin [Fig. 12(A)]. Mirroring our results, Henderson showed that methylation of his57 alone caused a 200,000‐fold decrease in k cat (with relatively little change in K m).44 Our modest six‐fold decrease in k cat in the presence of 0.2 mM Hg2+ is undoubtedly due to the moderate affinity and accessibility of his57, leaving most enzyme molecules mercury‐free.
Figure 11.
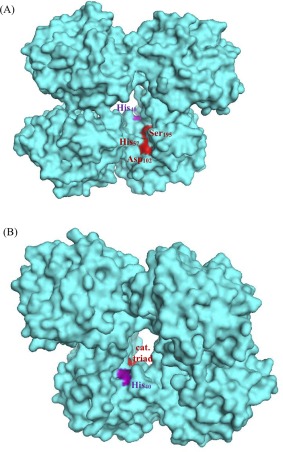
Structure of α‐chymotrypsin (PDB# 4Q2K): (A) front view; (B) rear view.
Figure 12.
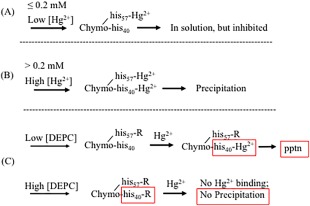
Consequences of Hg2+‐histidine binding in chymotrypsin. (A) Low concentrations of Hg2+ (≤0.2 mM) preferentially bind to chymotrypsin's his57, causing enzyme inhibition, but not aggregation. (B) High concentrations of Hg2+ (>0.2 mM) result in binding to both his57 and his40 of chymotrypsin; binding to his40 causes the enzyme to aggregate. (C) Low concentrations of DEPC (<0.5 mM) block his57 with an R group; this shifts Hg2+ binding to his40, causing enhanced precipitation. High concentrations of DEPC block both his57 and his40, protecting against Hg2+ binding and precipitation.
At and above 0.5 mM Hg2+, chymotrypsin precipitates out of solution almost completely (<8% remaining), and catalytic activity of the remaining chymotrypsin falls to zero (Fig. 7). Because chymotrypsin only has two histidines, it is tempting to hypothesize that Hg2+ binds differentially to the two histidine imidazole side chains. We propose that his57 is more reactive to Hg2+ than is his40. This could be due to steric accessibility, or local protein environment polarity or electrostatics. According to this hypothesis, at ≤0.2 mM, Hg2+ binds to his57, causing enzyme inhibition but no aggregation [Fig. 12(A)]; above 0.2 mM, Hg2+ binds to his40, causing denaturation and aggregation of the enzyme [Fig. 12(B)].
Our model depicted in Figure 12 suggests that inhibition of chymotrypsin activity should be traceable to Hg2+ binding to two different sites: At the first site, his57, Hg2+ binding yields noncompetitive inhibition; binding at the second site, his40, leads to denaturation, aggregation, and complete loss of activity. Such two‐site inhibition is sometimes referred to as “parabolic” inhibition, and can be characterized by a Dixon plot (1/v 0 vs. [inhibitor]0) that slopes upward parabolically.47 These data are fit to a second order polynomial (1/v 0 = a + b[I]0 + c[I]0 2), where the polynomial coefficients a, b, and c are related to the Michaelis–Menten parameters [see Supporting Information section 7, Eq. (S2)]. Converting our data from Figure 7 (black curve) to the 1/v0 vs. [Hg2+] Dixon format (Supporting Information Fig. S8), we see that the data do indeed fit well to a second order polynomial (R 2 = 0.985). This adds support to our model connecting chymotrypsin inhibition to the binding of Hg2+ to two distinct sites within the enzyme.
Further support for the hypothesis presented in Figure 12 is found in experiments in which we blocked the reactive nitrogen of histidine's imidazole side chain by reacting it with diethylpyrocarbonate. DEPC reacts with histidine to form a covalent adduct (Supporting Information Fig. S9) to which Hg2+ cannot bind; the formation of this adduct decreases the hydrolytic activity of the enzyme and also alters its Hg2+‐induced precipitation. The first order rate constant (k) for DEPC's reaction with chymotrypsin histidines is 0.43 ± 0.23 min−1, and enzymatic activity declined to its final inhibited value after 5–10 min (Supporting Information Fig. S6). The concentration profile showed that DEPC inhibited chymotrypsin activity with an IC 50 of 35 ± 6 µM; 700 µM inhibited the enzyme by 83% (Fig. 9).
The effect of histidine blocking by DEPC showed an interesting biphasic concentration dependence (Fig. 10). Up to about 500 µM DEPC, the extent of Hg2+‐induced precipitation of chymotrypsin was enhanced, with A350,max rising 30–35%. Above 500 µM DEPC chymotrypsin precipitation declined, with 2500 µM DEPC offering complete protection. These results are reminiscent of what we observed regarding Hg2+ binding to chymotrypsin's two histidines (Fig. 12). Here we posit that DEPC reactivity with chymotrypsin mirrors that of Hg2+, reacting preferentially with his57 at low DEPC concentrations (below 500 µM), then reacting with his40 at higher concentrations [Fig. 12(C)]. Below 500 µM DEPC, blocking of his57 causes partial inhibition of chymotrypsin activity (Supporting Information Fig. S6), and subsequently added Hg2+ is then forced to bind to his40, which enhances chymotrypsin precipitation [Fig. 12(B,C)]. Above 500 µM DEPC, prior blocking of his40 (along with his57) leaves Hg2+ without any imidazole side chains to bind to, thus completely protecting the enzyme from denaturation and aggregation [Fig. 12(B,C)]. Finally, we note that for prior incubations above 1.25 mM DEPC, subsequent Hg2+‐induced precipitation was very slow: It took from 1.5 to 2.5 h for the maximum A350 to be reached. These slower rates were undoubtedly due to the paucity of available histidines left for binding to Hg2+.
Finally, we wish to offer a new interpretation of Myshkin et al.'s results showing that exogenous histidine,22 and the amines Tris,21 EDTA, and thiourea,24 all inhibited the Hg2+‐induced aggregation of hemoglobin. Because of the kinetics of the aggregation reaction in the presence of these nitrogen‐based inhibitors, Myshkin et al. concluded that Hg2+ binding to four protein ligands induces aggregation: cysteine‐β93, two molecules of Tris buffer, and a non‐cysteine protein side chain. When a nitrogen‐based ligand (e.g., thiourea, EDTA, exogenous histidine or a third molecule of Tris buffer) displaces the non‐cysteine side chain, the Hg2+‐hemoglobin complex cannot form aggregates that are large enough to precipitate out of solution. Myshkin et al. tentatively identify this non‐cysteine Hg2+‐binding site as aspartate‐β94, based on a statement made by Garel et al.48
We note here two problems with this imputed role for aspartate‐Hg2+ binding: (1) Hg2+‐oxide binding is quite weak (e.g., the solubility of mercuric acetate at room temperature is almost 0.1 M); recall how weakly acetate inhibited Hg2+‐induced chymotrypsin aggregation [Fig. 3(B)]; and (2) Garel et al. cited Muirhead and Greer49 in support of their identification of a key “salt bridge between aspartate‐β94 and the carboxyl[ate] of the terminal histidine [β146].”48 The problem is that Garel et al. misinterpreted the following sentence: “The carboxyl[ate] group (labeled COO−) and the terminal histidine side chain, his‐β146, are also clearly visible; the latter bonding to the γ‐carboxyl[ate] of aspartate‐β94 in the same [polypeptide] chain.”49 Correct interpretation of the word “latter” shows that Muirhead and Greer identify histidine‐β146's imidazole side chain, and not its terminal carboxylate group, as aspartate‐β94's partner in this key salt bridge. In fact, Muirhead and Greer go on to implicate this histidine/imidazole‐aspartate/carboxylate salt bridge as “responsible for the… Bohr effect,” with its pK a of 7: Protonated histidine‐β146/imidazole forms this extra salt bridge with aspartate‐β94 in the deoxy form, stabilizing it and thus inhibiting oxygen binding. From this corrected reading of Muirhead and Greer, hemoglobin's non‐cysteine Hg2+ ligand is likely to be the imidazole side chain of histidine‐β146, rather than the carboxylate group of this residue or aspartate‐β94. All of this leads us to suggest that Myshkin et al.'s results, like ours, point to the key role of Hg2+ binding to the histidine imidazole side chain in triggering protein denaturation and aggregation. This in turn suggests that metal‐histidine binding may be key to understanding all metal‐induced protein aggregation.
Conclusion
Most studies on enzyme inhibition by Hg2+ focus on its binding to cysteine and selenocysteine side chains; we have shown that in chymotrypsin (and likely in hemoglobin), Hg2+ binds to histidine imidazole side chains. We have further shown that at low concentrations, both Hg2+ and DEPC bind preferentially to chymotrypsin's his57, causing inhibition of native (aqueous) enzyme; at high concentrations, Hg2+ and DEPC bind additionally to his40, and the Hg2+‐his40 form of the enzyme unfolds and aggregates. To our knowledge, we have presented the first data that distinguish between the inhibitory effects of blocking each of chymotrypsin's two histidines. The ability of Hg2+ to bind to residues other than cysteine or selenocysteine could implicate more enzymes in the toxicity of Hg2+. Furthermore, the key role of this non‐cysteine‐Hg2+ binding in enzyme aggregation suggests that weak Hg2+ ligands modeled after imidazole or simple amines might help with in vivo mercury detoxification.
Materials and Methods
A single aqueous stock solution of HgCl2 (10.253 mM) was used over a 12‐month period, stored in a glass bottle at room temperature. MOPS (4‐Morpholinepropanesulfonic acid) buffer stock solutions were prepared at pH 7.23 and pH 7.14. Chymotrypsin (Sigma‐Aldrich C4129) stock solutions (1 mM) were prepared daily in deionized H2O. Stock solutions of p‐nitrophenyl‐acetate (pNPA, Sigma‐Aldrich N8130) and N‐succinyl‐l‐phenylalanine p‐nitroanilide (Sigma‐Aldrich S2628) were also prepared daily in absolute ethanol and DMSO, respectively. Diethyl pyrocarbonate (DEPC, Sigma–Aldrich D5758) was prepared in acetonitrile. N‐(3‐dimethyl‐aminopropyl)‐N′‐ethylcarbodiimide hydrochloride (EDC, Sigma–Aldrich E6383) and N‐hydroxysuccinimide (NHS, Sigma–Aldrich 130672) solutions were prepared in deionized water.
Molar absorptivities of p‐nitrophenoxide, p‐nitroaniline, and chymotrypsin
p‐nitrophenylacetate hydrolyzes to acetate, 2 H+, and the visible chromophore p‐nitrophenoxide. The molar absorptivity of p‐nitrophenoxide was determined at its λmax, 400 nm, and also at 410 nm, where some literature measurements are made; we completely hydrolyzed p‐nitrophenyl‐acetate solutions ranging in concentration from 10 to 120 µM. Averaging six calibration curves gave ɛ 400 = 16200 ± 700 M−1 cm−1, and ɛ 410 = 15300 ± 600 M−1 cm−1 (± standard error).
N‐succinyl‐l‐phenylalanine‐p‐nitroanilide is hydrolyzed to l‐phenylalanine‐N‐succinate, H+, and the visible chromophore p‐nitroaniline. The molar absorptivity of p‐nitroaniline was determined at its λmax, 410 nm; we completely hydrolyzed N‐succinyl‐l‐phenylalanine‐p‐nitroanilide solutions ranging in concentration from 10 to 240 µM. Averaging the results of six calibration curves gave ɛ410 = 6600 ± 600 M−1 cm−1.
To measure the concentration of chymotrypsin in solution, its molar absorptivity was determined at λmax = 281 nm, using standard solutions ranging from 1 to 50 µM. Averaging the results of three calibration curves gave ɛ281 = 44300 ± 500 M−1 cm−1.
Free acetate and free imidazole protect chymotryspin from Hg2+ induced precipitation
Concentrations of imidazole or acetate, ranging from 0‐1000 µM, were incubated with 1.025 mM Hg2+ in 50 mM MOPS, pH 7.23, for 2 min. Chymotrypsin (20 µM) was then added and turbidity increase was monitored at A 350. A 350 versus time transients were fit to first order kinetics at each [imidazole].
EDC (and EDC + NHS) blocking of carboxylate side chains
Carbodiimides such as EDC react with carboxylate groups. Chymotrypsin (20 µM) was incubated with EDC (0–20 mM) for 15 min, followed by the addition of MES (pH 7.15, 50 mM final concentration) and HgCl2 (1.025 mM final concentration). Turbidity increase was monitored at A350. Because the reaction between EDC and NHS results in a more stable intermediate that reacts more effectively with carboxylates, the experiment above was also performed including NHS at a concentration 2.5x that of EDC.33, 34, 35
Control experiments were performed to determine whether protection against Hg2+‐induced chymotrypsin precipitation was due to a direct reaction between Hg2+ and the side chain labeling reagents EDC/EDC + NHS (reacts with aspartate/glutamate) and DEPC (reacts with histidine). Hg2+ was incubated with each of the above reagents for 30 min, and then chymotrypsin and MES buffer were added (final concentrations: 1 mM Hg2+, 20 µM chymotrypsin, 50 mM MES, pH 7.15) and A350 was monitored for 4–40 min. The reagent concentrations used were those that yielded extensive or complete protection against Hg2+‐chymotrypsin precipitation: 5 mM DEPC; 50 mM EDC; and 5 mM EDC + 12.5 mM NHS. Labeling reagents were incubated with Hg2+, followed by addition of buffer, deionized water, and finally, chymotrypsin, followed immediately by measurement of A 350. This protocol allowed time for the labeling reagents to interact with mercury, but insufficient time for them to react covalently with chymotrypsin side chains. Hence, under these conditions, any decline in chymotrypsin precipitation must be due to direct interactions between Hg2+ and the labeling reagents, thus preventing the mercury from binding to chymotrypsin side chains. Conversely, unaltered chymotrypsin precipitation would show that Hg2+ still binds to chymotrypsin side chains, thus Hg2+ does not interact directly with the labeling reagents.
EDC‐Hg2+ direct interaction was also followed spectrophotometrically, as EDC absorbance at 243 nm increases with added Hg2+. EDC (20 µM) in 50 mM MES, pH 7.15, was titrated with Hg2+ (0–2 mM final concentrations). Because Hg2+ also absorbs at 243 nm, the molar absorptivity of Hg2+ was determined at 243 nm, and absorbance due to Hg2+ was subtracted in order to isolate only EDC absorbance changes. The A243,corrected versus [Hg2+] data were plotted and fit to the equation for hyperbolic saturation [Eq. (1)].
pH dependence of Hg2+‐induced chymotrypsin precipitation
Buffer stock solutions were 0.2 M, and reactions were prepared with a final buffer concentration of 50 mM, 20 µM chymotrypsin, and 1.025 mM Hg2+; final reaction volumes were 1 mL. Light scattering of turbid/aggregated chymotrypsin particles was monitored via the absorbance increase at 350 nm and, when appropriate, A350 versus time transients were fit to first order kinetics [Eq. (5)]. Buffers were used within their buffer zone: pK a – 1 < pH < pK a + 1. Buffers used were (with pK a): sodium acetate (4.76); MES (6.15); MOPS (7.15); HEPES (7.55); Tris (8.08); TAPS (8.4); CHES (9.3); glycine (9.9); and CAPS (10.4). pH‐dependence was also studied in unbuffered solutions; in these experiments, the target pH was attained by adding aliquots of 10 mM NaOH or HCl.
Chymotrypsin remaining in solution after Hg2+‐induced precipitation
To study the extent of chymotrypsin precipitation, concentrations of Hg2+ ranging from 0 to 3.6 mM were incubated with chymotrypsin (20 µM) in 50 mM MOPS, pH 7.14, for a minimum of two hr. Deionized H2O was added to the Eppendorf tubes to bring the total volume of solution to 1 mL. After the incubation was complete, solutions were microfuged for 5 min at 12,000 rpm. The supernatant was collected and the concentration of chymotrypsin remaining in solution was calculated from A 281 using ɛ 281 = 44,300 M−1 cm−1; the “percent remaining” was calculated relative to the concentration of chymotrypsin in the control sample (without Hg2+). Using a final concentration of 3 mM N‐succinyl‐l‐phenylalanine p‐nitroanilide (from 0.25 M stock in DMSO) chymotrypsin hydrolysis activity was measured as an increase in A 410. The rate v 0 was calculated from the ΔA 410/Δt slope using ɛ 410 = 6600 M−1 cm−1 for the p‐nitroaniline chromophoric product. Percent activity was determined relative to the activity of the control (without Hg2+).
Michaelis–Menten kinetics of Hg2+‐inhibited chymotrypsin
To examine how Hg2+ inhibits chymotrypsin remaining in solution, the enzyme was incubated with three concentrations of HgCl2 (0.103, 0.205, and 0.308 mM). For each Hg2+ concentration, seven Eppendorf tubes were prepared. Hg2+ was incubated with chymotrypsin (20 µM) in 50 mM MOPS, pH 7.14, for a minimum of 2 h. Deionized H2O was added to bring the total volume of solution to 1 mL. After the incubation was complete, all seven Eppendorf tubes were microfuged for 5 min at 12,000 rpm to pellet out the aggregated chymotrypsin; the supernatants were transferred to seven cuvettes. Two stock solutions of the amide substrate N‐succinyl‐l‐phenylalanine p‐nitroanilide (0.28 and 0.2 M in DMSO) were prepared and aliquots were added to the seven supernatants, giving seven different final substrate concentrations varying from 0.05 to 3.5 mM. Chymotrypsin hydrolytic activity was measured as an increase in A 410. The rate, v 0 (µM/min), was calculated from the ΔA 410/Δt slope as before. The rate was plotted against substrate concentration (mM) and fit to the Michaelis–Menten equation [Eq. (2)]. A control Michaelis–Menten plot was also prepared with uninhibited chymotrypsin (no Hg).
Diethyl pyrocarbonate reacts with histidines in chymotrypsin
The reagent diethyl pyrocarbonate (DEPC) was utilized to block chymotrypsin histidines (see Supporting Information Fig. S9). To study the kinetics of DEPC reacting with histidine, the enzymatic activity of a DEPC‐chymotrypsin solution was assayed at various times. A 9.0 µL aliquot of 100 mM DEPC (in 98.5% vol/vol acetonitrile) was added to 720 µL of 1.0 mM chymotrypsin; this initial solution was thus 988 µM chymotrypsin, 1.2 mM DEPC, and 1.2% vol/vol acetonitrile. Over the course of 1 h, sixteen 40.5 µL aliquots of the chymo/DEPC solution were mixed in a cuvette with buffer, water, and pNPA substrate (0.32 M stock solution in ethanol) to give the following final concentrations: 40 µM chymotrypsin, 49 µM DEPC, 50 mM MOPS, pH 7.14, and 2.9 mM pNPA. Hydrolytic activity of chymotrypsin was measured as an increase in A410; the rate v 0 (µM/min) was calculated from the ΔA 410/Δt slope using ɛ 410 = 15300 M−1 cm−1 for the p‐nitrophenoxide chromophoric product. The rate v 0 (µM/min), plotted versus DEPC incubation time (min), showed first order exponential decline. During the course of these experiments we discovered that DEPC is soluble in acetonitrile but nearly insoluble in deionized H2O. Experiments that followed this discovery utilized DEPC stock solutions prepared in acetonitrile. Low concentrations of acetonitrile did not reduce the activity of chymotrypsin significantly (see Supporting Information Fig. S1).
To test the effect of histidine‐blocking by DEPC on the hydrolytic activity of chymotrypsin, the enzyme (40 µM) in 50 mM MOPS, pH 7.14, was incubated for 15 min with concentrations of DEPC varying from 0 to 700 µM (5 and 50 mM stock solutions in acetonitrile); the final volume of incubating solutions was 1 mL. The substrate pNPA (0.32 M stock in ethanol) at a final concentration of 2.9 mM was then added. The hydrolytic activity of chymotrypsin was measured as an increase in A 410, with v 0 (µM/min) calculated from the ΔA 410/Δt slope as above. The v 0 (µM/min) versus [DEPC] data were plotted and fit to the equation for enzyme inhibition concentration‐dependence [Eq. (3)].
To assay the effects of DEPC on Hg2+‐induced chymotrypsin precipitation, 0–2.5 mM DEPC (from 50 mM stock solution in acetonitrile) was incubated for 15 min with chymotrypsin (20 µM) in 50 mM MOPS pH 7.14, in a final volume of 960 µL. After the incubation, 40 µL of 10.253 mM Hg2+ was added, giving a final concentration of 0.410 mM Hg2+. Chymotrypsin precipitation was monitored at 350 nm, and the max A 350 was recorded and plotted against DEPC concentration (µM). In control experiments similar to those described above for EDC, we determined that DEPC does not interact directly with Hg2+.
Data analysis
hyperbolic saturation: Hg2+‐EDC binding
The absorbance of EDC at 243 nm (corrected for Hg2+ absorbance) was plotted against Hg2+ concentration, and fit to the general equation for hyperbolic saturation [Eq. (1), a version of the Michaelis–Menten equation] to determine A max and C 50, the Hg2+ concentration giving half‐maximal A 243.
| (1) |
Hyperbolic saturation: Michaelis–Menten analysis
Chymotrypsin activity (v 0, in µM/min) was plotted against initial substrate concentration [S]0, and fit to the Michaelis–Menten equation [Eq. (2)] to determine V max and K m.
| (2) |
where [S]0 is the initial concentration of substrate, V max (µM/min) corresponds to the maximum reaction rate when the enzyme is saturated with substrate, and K m corresponds to the substrate concentration at which v 0 = ½ V max; K m is a measure of enzyme‐substrate binding affinity.
Hyperbolic saturation: enzyme inhibition
Chymotrypsin activity (v 0, in µM/min) was plotted against DEPC concentration, and fit to the general equation for the concentration‐dependent inhibition of enzyme activity [Eq. (3)]:
| (3) |
where [I]o is the initial inhibitor concentration (0–700 µM), v0 (control) = the reaction rate of the uninhibited enzyme, and IC 50 is the inhibitor concentration that gives v0 = ½ v0 (control).
Protein aggregation kinetics
A detailed discussion of protein aggregation kinetics is included in Section 2 of the Supporting Information; here we include a brief synopsis. Protein aggregation is generally modeled as a multi‐step process that features nucleation followed by particle growth.37, 38, 39 If nucleation is rate‐determining, then aggregation kinetics are sigmoidal, featuring an initial lag time, followed by rapid aggregation and eventual saturation.37, 38, 39, 50 If nucleation is fast (either inherently,51, 52, 53 or due to seeding of nuclei,37 pH ≥ 7,19 or addition of heavy metal cations14, 15, 16, 17, 18, 19), then the entire aggregation process follows first order kinetics.37, 38, 39
In our studies of the kinetics of Hg2+‐induced chymotrypsin aggregation, between pH 6.5–7.0, turbidity increased sigmoidally with time, and the A350 versus t transients were well‐fit using either the Finke‐Watzky38 or Crespo et al.50 exponential equations, the latter of which is given in Eq. (4):
| (4) |
where A 0 is the initial absorbance (usually zero), ΔA is the maximum change in absorbance from time zero to infinity, k a is a scaled first order rate constant for the growth phase, and k b is a unitless ratio of the nucleation/growth rate constants.50
Above pH 7 we observed no lag time, and our data were best fit with two sequential first order processes [Eq. (5)], with the half‐time of the fast process ≈ 4 s, and τ slow ≈ 30 s (see Supporting Information Table SI; it is worth noting that the Crespo et al. equation also gave reasonably good fits).
| (5) |
where k fast and k slow are first order rate constants for the fast and slow processes, respectively, and ΔA fast and ΔA slow are the maximum amplitudes (i.e., the total absorbance change from time zero to infinity) attributed to the fast and slow processes, respectively. ΔA slow/A final is the fraction of A final contributed by the slow process, and 1 − ΔA slow/A final is the fraction of A final contributed by the fast process. Presumably the slower process represents the formation of larger light‐scattering particles, however, as this process usually contributed less than 10% of the A350 signal, and never more than 25% (see Supporting Information Table SI), we based our results on the fast process.
Supporting information
Supporting Information
Acknowledgments
The authors thank Professors Karen Holman and Andrew Duncan for their fruitful discussions on aspects of bioinorganic and bioorganic chemistry, respectively; Professor Alison Fisher for her suggestions after reading an early draft of this article; and finally, they thank Dr. John Reardon for his suggestions regarding how to distinguish between the effects of Hg2+ binding to chymotrypsin's two histidines.
References
- 1. Korbas M, MacDonald TC, Pickering IJ, George GN, Krone PH (2011) Chemical form matters: differential accumulation of mercury following inorganic and organic mercury exposures in zebrafish larvae. ACS Chem Biol 7:411–420. [DOI] [PubMed] [Google Scholar]
- 2. Park J, Zheng W (2012) Human exposure and health effects of inorganic and elemental mercury. J Prevent Med Public Health 45:344–352. [DOI] [PMC free article] [PubMed] [Google Scholar]
- 3. Carocci A, Rovito N, Sinicropi MS, Genchi G (2014) Mercury toxicity and neurodegenerative effects: reviews of environmental contamination and toxicology. Whitacre, D.M. ed., Springer, Switzerland. 229:1–18. [DOI] [PubMed] [Google Scholar]
- 4. Gochfeld M (2003) Cases of mercury exposure, bioavailability, and absorption. Ecotoxicol Environ Saf 56:174–179. [DOI] [PubMed] [Google Scholar]
- 5. Blayney M, Winn J, Nierenberg D (1997) Handling dimethylmercury. Chem Eng News 75:7. [Google Scholar]
- 6. Guzzi G, La Porta CA (2008) Molecular mechanisms triggered by mercury. Toxicology 244:1–12. [DOI] [PubMed] [Google Scholar]
- 7. Zalups RK (1993) Early aspects of the intrarenal distribution of mercury after the intravenous administration of mercuric chloride. Toxicology 79:215–228. [DOI] [PubMed] [Google Scholar]
- 8. Zalups RK (2000) Molecular interactions with mercury in the kidney. Pharmacol Rev 52:113–143. [PubMed] [Google Scholar]
- 9. Jan AT, Ali A, Haq Q (2011) Glutathione as an antioxidant in inorganic mercury induced nephrotoxicity. J Postgrad Med 57:72–77. [DOI] [PubMed] [Google Scholar]
- 10. Branco V, Canário J, Lu J, Holmgren A, Carvalho C (2012) Mercury and selenium interaction in vivo: effects on thioredoxin reductase and glutathione peroxidase. Free Radic Biol Med 52:781–793. [DOI] [PubMed] [Google Scholar]
- 11. Carvalho CM, Chew EH, Hashemy SI, Lu J, Holmgren A (2008) Inhibition of the human thioredoxin system. A molecular mechanism of mercury toxicity. J Biol Chem 283:11913–11923. [DOI] [PubMed] [Google Scholar]
- 12. Clarkson TW, Magos L (2006) The toxicology of mercury and its chemical compounds. Crit Rev Toxicol 36:609–662. [DOI] [PubMed] [Google Scholar]
- 13. Vulpis N, Giorgino R (1962) Some effects of metal cations on blood coagulation. Thromb Diathesis Haemorr 1962:121–131. [Google Scholar]
- 14. Konyaeva V, Myshkin A (1998) Effect of weak chemical actions on coagulation of oxyhemoglobin mercurated at reactive sulfur. II. Effects of the protein concentration and degree of mercuration. Russ J Gen Chem 68:637–642. [Google Scholar]
- 15. Khromova V, Myshkin A (2000) Coagulation of bovine methemoglobin mercurated at reactive sulfur in the presence of ligands with a high affinity for Hg (II). Russ J Gen Chem 70:635–639. [Google Scholar]
- 16. Khromova V, Myshkin A (2000) Coagulation of cadmium‐modified hemoglobin. Russ J Gen Chem 70:630–634. [Google Scholar]
- 17. Khromova V, Myshkin A (2002) Coagulation of zinc‐modified hemoglobin. Russ J Gen Chem 72:1645–1649. [Google Scholar]
- 18. Khromova V, Myshkin A (2003) Coagulation of nickel‐modified hemoglobin. Russ J Gen Chem 73:988–992. [Google Scholar]
- 19. Mantyh PW, Ghilardi JR, Rogers S, DeMaster E, Allen CJ, Stimson ER, Maggio JE (1993) Aluminum, iron, and zinc ions promote aggregation of physiological concentrations of β‐amyloid peptide. J Neurochem 61:1171–1174. [DOI] [PubMed] [Google Scholar]
- 20. Budavari S (1989) The merck index: an encyclopedia of chemicals, drugs, and biological S, 11th ed Rahway, NJ: Merck, pp 924. [Google Scholar]
- 21. Konyaeva V, Myshkin A (1998) Effect of weak chemical interactions on coagulation of oxyhemoglobin mercurated at reactive sulfur. I. Influence of Tris (hydroxymethyl) aminomethane. Russ J Gen Chem 68:630–636. [Google Scholar]
- 22. Myshkin AE, Khromova VS (2000) Histidin as a mercurial poisoning inhibitor. Biochem Biophys Res Commun 273:816–819. [DOI] [PubMed] [Google Scholar]
- 23. Myshkin AE, Khromova VS (2005) A new insight into mercurized hemoglobin aggregation mechanism. Biochim Biophys Acta 1749:1–6. [DOI] [PubMed] [Google Scholar]
- 24. Konyaeva V, Myshkin A (1998) Effect of weak chemical actions on coagulation of oxyhemoglobin mercurated at reactive sulfur. III. Effects of EDTA and Thiourea. Russ J Gen Chem 68:643–649. [Google Scholar]
- 25. Appel W (1986) Chymotrypsin: molecular and catalytic properties. Clin Biochem 19:317–322. [DOI] [PubMed] [Google Scholar]
- 26. Nelson DL, Lehninger AL, Cox MM (2008) Lehninger principles of biochemistry, 5th ed. NY: Macmillan; pp 522–524. [Google Scholar]
- 27. Housecroft CE, Constable EC (2012) Chemistry: an introduction to organic, inorganic and physical chemistry, 4th ed. Essex, England: Pearson education; pp 1256. [Google Scholar]
- 28. Martell AE, Smith RM (1974) Critical stability constants: amino acids, Vol. 1 NY: Springer. [Google Scholar]
- 29. Bjerrum J, Martell AE (1964) Stability constants of metal‐ion complexes, Special Publication #17th ed. London: The Chemical Society. [Google Scholar]
- 30. Ngu‐Schwemlein M, Merle JK, Healy P, Schwemlein S, Rhodes S (2009) Thermodynamics of the complexation of Hg (II) by cysteinyl peptide ligands using isothermal titration calorimetry. Thermochim Acta 496:129–135. [Google Scholar]
- 31. Kurganov B (2002) Kinetics of protein aggregation. Quantitative estimation of the chaperone‐like activity in test‐systems based on suppression of protein aggregation. Biochemistry 67:409–422. [DOI] [PubMed] [Google Scholar]
- 32. Finke JM, Roy M, Zimm BH, Jennings PA (2000) Aggregation events occur prior to stable intermediate formation during refolding of interleukin 1β. Biochemistry 39:575–583. [DOI] [PubMed] [Google Scholar]
- 33. Grabarek Z, Gergely J (1990) Zero‐length crosslinking procedure with the use of active esters. Anal Biochem 185:131–135. [DOI] [PubMed] [Google Scholar]
- 34. Staros JV, Wright RW, Swingle DM (1986) Enhancement by N‐hydroxysulfosuccinimide of water‐soluble carbodiimide‐mediated coupling reactions. Anal Biochem 156:220–222. [DOI] [PubMed] [Google Scholar]
- 35. Timkovich R (1977) Detection of the stable addition of carbodiimide to proteins. Anal Biochem 79:135–143. [DOI] [PubMed] [Google Scholar]
- 36. Sundberg RJ, Martin RB (1974) Interactions of histidine and other imidazole derivatives with transition metal ions in chemical and biological systems. Chem Rev 74:471–517. [Google Scholar]
- 37. Harper JD, Lansbury JPT (1997) Models of amyloid seeding in Alzheimer's disease and scrapie: mechanistic truths and physiological consequences of the time‐dependent solubility of amyloid proteins. Ann Rev Biochem 66:385–407. [DOI] [PubMed] [Google Scholar]
- 38. Morris AM, Watzky MA, Finke RG (2009) Protein aggregation kinetics, mechanism, and curve‐fitting: a review of the literature. Biochim Biophys Acta 1794:375–397. [DOI] [PubMed] [Google Scholar]
- 39. Roberts CJ (2007) Non‐native protein aggregation kinetics. Biotechnol Bioeng 98:927–938. [DOI] [PubMed] [Google Scholar]
- 40. Hanlon DP, Watt DS, Westhead EW (1966) The interaction of divalent metal ions with tris buffer in dilute solution. Anal Biochem 16:225–233. [DOI] [PubMed] [Google Scholar]
- 41. Bernhoft RA (2012) Mercury toxicity and treatment: a review of the literature. J Environ Public Health 2012:460508. [DOI] [PMC free article] [PubMed] [Google Scholar]
- 42. Nagaraj P, Gopalakrishna Bhat N, Chandrashekara K (2015) Indirect complexometric determination of mercury (II) using L‐cystine as a selective masking agent. Int J Chem Stud 3:27–29. [Google Scholar]
- 43. Mamun M, Ahmed O, Bakshi P, Yamauchi S, Ehsan M (2011) Synthesis and characterization of some metal complexes of cystine:[Mn (C6H10N2O4S2)]; where MII= Mn (II), Co (II), Ni (II), Cu (II), Zn (II), Cd (II), Hg (II) and Pb (II). Russ J Inorgan Chem 56:1972–1980. [Google Scholar]
- 44. Henderson R (1971) Catalytic activity of alpha‐chymotrypsin in which histidine‐57 has been methylated. Biochem J 124:13–18. [DOI] [PMC free article] [PubMed] [Google Scholar]
- 45. Zubay G (1988) Biochemistry, 2nd ed. NY: Macmillan Publishing Co; pp 288–298. [Google Scholar]
- 46. Chua KC, Pietsch M, Zhang X, Hautmann S, Chan HY, Bruning JB, Gütschow M, Abell AD (2014) Macrocyclic protease inhibitors with reduced peptide character (chymotrypsin, PDB. Angewandte Chem 126:7962–7965. [DOI] [PubMed] [Google Scholar]
- 47. Roberts DV (1977) Enzyme kinetics. Cambridge: Cambridge University Press; pp 51–63. [Google Scholar]
- 48. Garel MC, Beuzard Y, Thillet J, Domenget C, Martin J, Galacteros F, Rosa J (1982) Binding of 21 thiol reagents to human hemoglobin in solution and in intact cells. Eur J Biochem 123:513–519. [DOI] [PubMed] [Google Scholar]
- 49. Muirhead H, Greer J (1970) Three‐dimensional Fourier synthesis of human deoxyhaemoglobin at 3.5 Å resolution. Nature 228:516–519. [DOI] [PubMed] [Google Scholar]
- 50. Crespo R, Rocha FA, Damas AM, Martins PM (2012) A generic crystallization‐like model that describes the kinetics of amyloid fibril formation. J Biol Chem 287:30585–30594. [DOI] [PMC free article] [PubMed] [Google Scholar]
- 51. Andrews JM, Roberts CJ (2007) Non‐native aggregation of α‐chymotrypsinogen occurs through nucleation and growth with competing nucleus sizes and negative activation energies. Biochemistry 46:7558–7571. [DOI] [PubMed] [Google Scholar]
- 52. Andrews JM, Weiss IVWF, Roberts CJ (2008) Nucleation, growth, and activation energies for seeded and unseeded aggregation of α‐chymotrypsinogen A. Biochemistry 47:2397–2403. [DOI] [PubMed] [Google Scholar]
- 53. Weiss WF, Hodgdon TK, Kaler EW, Lenhoff AM, Roberts CJ (2007) Nonnative protein polymers: structure, morphology, and relation to nucleation and growth. Biophys J 93:4392–4403. [DOI] [PMC free article] [PubMed] [Google Scholar]
- 54. Meisl G, Kirkegaard JB, Arosio P, Michaels TC, Vendruscolo M, Dobson CM, Linse S, Knowles TP (2016) Molecular mechanisms of protein aggregation from global fitting of kinetic models. Nat Protoc 11:252–272. [DOI] [PubMed] [Google Scholar]
- 55. Zettlmeissl G, Rudolph R, Jaenicke R (1979) Reconstitution of lactic dehydrogenase. Noncovalent aggregation vs. reactivation. 1. Physical properties and kinetics of aggregation. Biochemistry 18:5567–5571. [DOI] [PubMed] [Google Scholar]
- 56. Khanam JA, Begum MF, Ara J, Jesmin M, Taher MA, Ali SM (2006) Antimicrobial activity of metal cystine complexes. Dhaka Univ J Pharmac Sci 5:29–32. [Google Scholar]
Associated Data
This section collects any data citations, data availability statements, or supplementary materials included in this article.
Supplementary Materials
Supporting Information