Abstract
Motor proteins are essential components of intracellular transport inside eukaryotic cells. These protein molecules use chemical energy obtained from hydrolysis of ATP to produce mechanical forces required for transporting cargos inside cells, from one location to another, in a directed manner. Of these motors, cytoplasmic dynein is structurally more complex than other motor proteins involved in intracellular transport, as it shows force and fuel (ATP) concentration dependent step‐size. Cytoplasmic dynein motors are known to work in a team during cargo transport and force generation. Here, we use a complete Monte‐Carlo model of single dynein constrained by in vitro experiments, which includes the effect of both force and ATP on stepping as well as detachment of motors under force. We then use our complete Monte‐Carlo model of single dynein motor to understand collective cargo transport by a team of dynein motors, such as dependence of cargo travel distance and velocity on applied force and fuel concentration. In our model, cargos pulled by a team of dynein motors do not detach rapidly under higher forces, confirming the experimental observation of longer persistence time of dynein team on microtubule under higher forces.
Keywords: motor proteins, dynein, Monte‐Carlo simulation, molecular motors
Introduction
In eukaryotic cells, cytoplasmic dynein motors are responsible for long‐range cargo transport from cell periphery to the cell interior,1, 2, 3 and also play an important role during cell division.4 These motors are mechano‐chemical enzymes which use chemical energy obtained from hydrolysis of ATP molecules to produce mechanical forces.5, 6 A cytoplasmic dynein motor has two heads, with each head having six AAA sites, among which only four sites can bind to ATP molecules. During the process of cargo transport, a single cytoplasmic dynein (referred to as dynein hereafter) motor can move against an opposing load of upto 1.25 pN by hydrolyzing ATP molecules, which is called the stall force of the motor.2, 7 Therefore, dynein can be considered as a weak motor in comparison to Kinesin whose stall forces are typically in the range of 5–7 pN.7, 8 Because the forces generated as well as the travel distances achieved via single dynein motor are usually not enough for transporting cargos over long intracellular distances, multiple dynein motors often work collectively as a team to transport various cargos inside cells.9, 10
While it is known how the opposing force (load) and fuel (ATP) concentration affect the functioning of a single dynein motor11, 12, 13, 14, 15; their effect on cargo transport properties by a team of multiple dynein motors10 is still unclear. To fill up this knowledge gap, we develop a model of cargo transport by a team of dynein motors [Fig. 1(A)]. The goal of our modeling is to understand how cargo travel distance, travel velocity and cargo persistence depend on opposing force (load) and ATP concentration. Our model of cargo transport by a team of dynein motors uses a complete Monte‐Carlo model of single dynein motor with detachment kinetics, which is obtained by refining the earlier developed Monte‐Carlo Model of Singh et al.,15 and including experimentally constrained detachment kinetics measured by Kunwar et al., 16 into their model. Our model of cargo transport includes stochastic sharing of load among engaged motors and is based on the stochastic model of Kunwar et al.17, 18 The details of the complete Monte‐Carlo model of single dynein motor with detachment kinetics are given in the next section.
Figure 1.
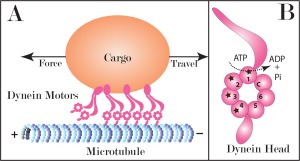
(A) Schematic diagram of cargo transport by a team of dynein motors along ‐end of a microtubule with N = 4. (B) Schematic of the various ATP binding sites of the single dynein motor head. ATP can bind to site 1, 2, 3, and 4 however it can get hydrolyzed only at site 1.
Complete Monte‐Carlo Model of Single Dynein Motor with Detachment Kinetics
Single cytoplasmic dynein motors take discrete steps of sizes 8, 16, 24, or 32 nm on microtubules while transporting cargos inside cells.14 The step‐size of a single dynein depends on the opposing load and the available ATP concentration. Shorter steps are preferred at higher ATP concentrations and higher opposing loads.14, 15 It has been observed experimentally that stall force of a single dynein motor varies with ATP concentration.14 It increases upto ∼1000 μM and remains almost constant afterwards, except for a very insignificant decrease at saturating ATP values.
Singh et al.15 proposed a detailed mechanochemical model of single dynein motor, in which the authors included the mechanochemistry of ATP hydrolysis at the dynein head [Fig. 1(B)], and its effect on the step‐size of the motor onto the microtubule. The Monte‐Carlo model of Singh et al.15 was based on a few underlying assumptions, which are outlined below:
Assumption 1: Single motor step‐size is determined by the number of ATP molecules attached to the dynein head
The step‐size in their model was assumed to be decreasing linearly with ATP as nm, where s is the number of ATP‐bound sites among the four available ATP‐binding sites on single dynein head . This assumption thus logically accounted for smaller step‐sizes at saturating ATP concentrations.
Assumption 2: The binding affinities of the secondary sites with ATP decrease as the number of ATP molecules bound to these sites increases. The highest affinity is associated with the site where primary hydrolysis occurs
Singh et al.15 used the following relation for the attachment/on‐rates of ATP binding to an ith ATP binding site:
| (1) |
and the following relations for the ATP unbinding/off‐rates from an ith site:
| (2) |
Assumption 3: The kinetics of ATP binding at the secondary sites is load‐dependent, with applied load increasing the ATP binding affinity
Therefore, the authors assumed,
| (3) |
where is the number of ATP molecules bound at secondary site j, T is the absolute temperature (kelvin), F m is the force experienced by motor, is the ATP binding rate at motor's secondary site j at zero load, k B is the Boltzmann constant and d 0 is the adjustable length parameter.
Assumption 4: The probability of ATP hydrolysis depends inversely on the applied load
Hence, Singh et al.15 assumed the following inverse exponential relation:
| (4) |
where α is the load distribution factor for ATP hydrolysis, A(s) is the load‐dependent hydrolysis factor, is the ATP hydrolysis rate by the motor at zero load, and d(s) is the linear function relating motor step‐size with the number of bound ATP molecules.
Assumption 5: ATP hydrolysis at site 1 is highly enhanced if at least one secondary site is also bound to ATP
To capture this scenario the authors introduced a parameter A(s) such that A(s) = 1 only if s > 1; otherwise .
Assumption 6: During a kinetic cycle of dynein, reversal of hydrolysis is also possible with a finite probability
Reversal of hydrolysis means conversion of ADP back to ATP i.e. ADP + P i → ATP. The reversal was assumed to occur with a finite load‐dependent probability given by the following exponential relation:
| (5) |
where β is the load distribution factor for reverse hydrolysis and is the reverse hydrolyzing probability at zero load.
The Monte‐Carlo model of single dynein developed by Singh et al.15 with the above assumptions correctly reproduced the experimentally observed single dynein's step‐size distribution and variation of stall force with ATP concentration as reported in the in vitro experiments.9, 14 However, their model of single motor was not suitable for modeling transport by a team of dynein motors due to two shortcomings which are discussed below along with the consequences:
Detachment kinetics of single dynein motor is not considered in the model
The Monte‐Carlo model of single dynein developed by Singh et al.15 did not include the detachment of motor proteins into its theoretical description. It is known that individual bound motor(s) stochastically detach from the microtubule, and unbound motor(s) reattach to the microtubule, while transporting a cargo. In addition, this stochastic detachment of individual bound motors may often result in a situation where the remaining bound motors experience a force beyond the single motor stall force. Therefore, detachment kinetics of individual motors both in sub‐stall (F < F s) and super‐stall regimes ( ) must be included in the model of single dynein motor.
Complete reversal of ATP hydrolysis at higher force
Singh et al.15 assumed the probability of reverse hydrolysis to be exponentially dependent on force experienced by the motor [Eq. (5)]. As a result, at very high loads, the probability of reversal becomes which results in complete stalling of the motor. Since their model correctly predicts the single dynein stall force and step‐size distribution, this problem of reverse‐hydrolysis probability becoming went undetected in their model. However, consequences of this error were observed during simulation of cargo transport by a team of multiple dynein motors with the load experienced by a motor becoming greater than single motor stall force.
In the model of cargo transport by a team of dynein motors, individual engaged motors can feel forces greater than a single motor stall force. This happens when some of the bound motors detach resulting in the remaining bound motors to share the applied force. Because we use a computational model with stochastic sharing of load by individual bound motors, a leading motor may experience a load greater than its stall force, while a trailing motor may not experience any load, or may experience only a little load. Such scenarios of unequal load sharing would happen more frequently at higher loads resulting in leading motor not taking any step, due to its reverse hydrolysis probability getting extremely high (even due to its exponential dependence on load). Because a leading motor under such scenarios would not take any step, and would eventually detach, this would result in a net backward movement of the cargo, and hence it would not contribute to cargo travel distance. Therefore, all non‐zero contributions to cargo travel distance would be coming from the trailing motors, which again cannot be much, as they have to first compensate for backward travel of the cargo due to detachment of leading motor(s). As a result, the predicted cargo travel distance by a team of dynein motors under moderate load using Monte‐Carlo model of Singh et al.15 turns out to be very small, which is not true for a cargo driven by a team of dynein motors as observed experimentally.12
We further observed that load‐sharing by motors in super‐stall regime happens with a very negligible probability and it does not lead to any improvement in the team's collective function due to the following reason: In our model, we observed that under backward loads in super‐stall regime, all of the externally applied load is borne by only one forward motor. Any one of the trailing motors can come up to the forward load bearing motor at full unloaded speed to share the load successfully. However, motors start to detach more rapidly as soon as load sharing happens, because force per motor decreases, and they enter into the sub‐stall regime where detachment rates are higher. If one of the load sharing motors detaches, then the cargo moves back a little and all the load is again borne by the remaining bound forward motor(s) (which enter into catch‐bond state again).
Therefore, the model of Singh et al.15 required refinement to address the above mentioned shortcomings. To include the detachment of individual dynein motors in the model of cargo transport, we have incorporated the in vitro detachment kinetics of single dynein motors measured by Kunwar et al.16 Experimentally, the detachment rates of individual dynein motors depend on the amount of load experienced by them. When a motor experiences loads smaller than single motor stall force, the detachment rate increases exponentially with increasing load. Beyond single motor stall force, the detachment rate slowly decreases with load.16 Thus, dynein shows a catch‐bond type of behavior under high backward load i.e. it detaches slowly under high backward load.
The exact mechanism of the origin of catch‐bond in dynein motor is still unclear, which is the cause of discontinuity in detachment kinetics of a single motor near the stall force. One recent hypothesis suggests that there may be allosteric structural changes in both the dynein head and the microtubule binding site under high opposing loads. These structural changes may lead to “locking” or tight coupling between the motor head and the microtubule binding site leading to a decreased detachment of motor head from the microtubule.9 The strength of such catch‐bond systems increases with increasing opposing loads due to more tight inter‐locking of the involved protein domains. A number of models have been proposed to explain the biophysical mechanism of catch‐bond.19 To the best of our knowledge, detachment rate of mammalian dynein under forward load either under in vitro or in vivo conditions has not been measured explicitly. Therefore, the detachment rate of single dynein was assumed to be the same for loads acting in either forward or backward direction in our Monte‐Carlo model. The detachment rates of motor heads under forward and backward loads have been measured only for yeast dynein.20 A recent paper by Takshak et al.21 has explored the effect of anisotropic detachment rates of motors on cargo transport under physiological conditions.
The detachment rates used in our model for single dynein motors were taken from the experiments of Kunwar et al.16
| (6) |
where F d is the detachment force.
| (7) |
where s and pN.16
To correct the problem of reverse hydrolysis probability becoming and consequently predicting a very small cargo travel distance at forces greater than single motor stall force, we tuned the ATP hydrolysis rate and corrected the reverse hydrolysis rate. These were done such that the prediction of step‐size distribution and the variation of stall force with ATP concentration match with the in vitro experimental data14 similar to that of Singh et al.15 A comparison of predictions from our complete Monte‐Carlo model of single dynein is shown with those from the Monte‐Carlo model of Singh et al.15 as well as experimental data14 in the Appendix (Figs. A1 and A2).
The new relations for hydrolysis and reverse hydrolysis probabilities which we employed in our model are given below.
| (8) |
| (9) |
Here, and are the refined load distribution factors for ATP hydrolysis and reverse hydrolysis respectively. It is worth noting that the sum of these load distribution factors is equal to unity only for ideal motors.22
Stochastic Model of Cargo Transport by a Team of Dynein Motors
To develop a stochastic model of cargo transport by a team of dynein motors, we used the stochastic model of cargo transport developed by Kunwar et al.17, 18 The complete Monte‐Carlo model of single dynein motor with detachment kinetics (discussed in the previous section) was used to model the individual motors bound to the cargo.
In our stochastic model of cargo transport, N dynein motors are put on the cargo such that the motor tails are attached to the cargo via the linkage of the rest length l. Each linkage exerts a restoring force (according to Hooke's law) when attached to the microtubule and stretched beyond its rest length. The linkages exert no force when compressed i.e. linkages have no compressional rigidity. Initially, cargo's center of mass is kept at the origin and all motors are allowed to attach on the microtubule within a distance l on either side of the cargo's center of mass. Once the motors get attached to the microtubule, the initial position of the cargo is determined using force balance i.e. net force on the cargo to be equal to zero. At each time step of Monte‐Carlo simulation, each of the N motors are visited to determine their tentative states (attached or detached) and respective positions on the microtubule. If the motor is currently unattached, it is allowed to reattach with a probability determined by the reattachment rate, to the microtubule track within a distance l on either side of the cargo's center of mass. The instantaneous load felt by a currently attached motor is obtained by multiplying the extension of its linkage by the linkage stiffness k. The value of k used in our model was the same as the one used in earlier works16, 17, 23 for stiffness of dynein. To the best of our knowledge, stiffness of cytoplasmic dynein has not been explicitly measured under in vitro or in vivo conditions. Therefore, we also explored the effect of dynein stiffness on our results by increasing and decreasing the stiffness of dynein by a factor of 4. The effect of dynein stiffness on our results is discussed in the Appendix.
In our model, an attached motor has three possibilities at each time step‐it can remain stationary, step, or detach. The probabilities of the events of motor stepping and detachment for individual motors were determined by the current load on the motor which are calculated using complete Monte‐Carlo model of single dynein with detachment kinetics. The motor reattachment probability was assumed to be independent of the load felt by the motor. It was further assumed that stepping of dynein motors happens at a rate similar to that at zero load when pulled forward.16, 18 We also considered the scenario where dynein stepping was assumed to increase under forward load. The effect of this assumption on our results is discussed in the Appendix.
In our model, the detachment rate for backward load was assumed to be same as that for forward load. If a motor stepped, its position was incremented by the corresponding step‐size. When tentative states and positions of all N motors had been determined, the states and positions of all motors were updated simultaneously. Finally, the cargo position at that time step was updated using force balance. The above procedure was repeated till all of the motors eventually detach from the microtubule.
The data points were obtained from 5000 configurations, where each configuration was started with the initial condition that all N motors are attached to the microtubule. The simulation for each configuration was stopped when all motors had detached from the microtubule.
Results and Discussion
Cargo velocity increases with ATP concentration upto ∼2mM and decreases thereafter
Our simulations show that cargo velocity starts increasing with an increase in ATP concentration at both zero and nonzero loads (Fig. 2) upto . At zero load, increasing motor number N does not show much effect on cargo velocities as the engaged motors mostly travel with their unloaded velocities. However, at nonzero loads, the velocities of individual engaged motors are greatly reduced by the applied load. Thus, having more motors in the team helps the cargo to move with higher velocities.
Figure 2.
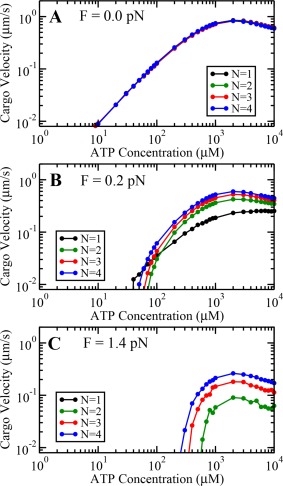
Variation of cargo velocity with ATP concentration at load values (A) 0.0 pN, (B) 0.2 pN, and (C) 1.4 pN.
It is important to note that the travel velocity for N = 1 exhibits a maxima at followed by a decrease similar to the one observed in the original model of Singh et al., 15 which was not prominent due to the truncation of ATP concentration axis at 4 mM. We found that this decrease is due to the fact that as ATP concentration becomes higher than , the average stepping rate becomes constant and average step size starts to decrease and approaches 8 nm at all values of external loads (A3 in Appendix). This reduces the average velocity of a single motor at very high ATP concentrations which in turn reduces the velocity of a team of dynein motors.
Cargo travel velocity reduces with increasing load at all ATP concentrations
Our complete Monte‐Carlo model of single dynein motor reproduces the results of Singh et al.15 In addition, single motor velocity obtained from our model is qualitatively similar to the experimental results of Rai et al., 14 that velocity reduces sub‐linearly with increasing load (Fig. 3) for a single motor. We find that the extent of sublinearity reduces with an increase in motor number N, i.e. the travel velocity reduces more gradually when there are more motors on the cargo to share the load. However, the nature of the force–velocity curve remains concave‐up for all N.
Figure 3.
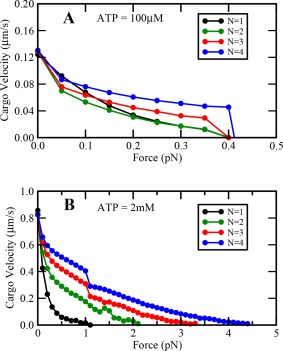
Variation of cargo velocity with load at (A) low and (B) saturating ATP concentrations.
Cargo travel distance shows non‐monotonic variation with ATP concentration
Our simulations show that the cargo travel distance increases almost exponentially with the total number of motors N available on the cargo (Fig. 4). The probability of all bound motors detaching from microtubule reduces as N increases, hence the cargo remains bound to the microtubule for a longer time. Consequently, the cargo keeps moving due to stepping of bound motors until all of them eventually detach from the microtubule, resulting in longer travel distances.
Figure 4.
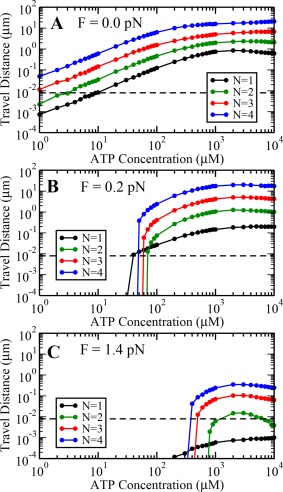
Variation of cargo travel distance with ATP concentration at load values (A) 0.0 pN, (B) 0.2 pN, and (C) 1.4 pN. Dashed line represents travel distance of 8 nm that is minimum possible step‐size of individual engaged motors.
Our simulations further show that the cargo travel distance increases with increasing ATP concentration upto and decreases thereafter for nonzero loads for all N. The decrease is significant for a very small team of motors i.e. up to three motors. However, this observed decrease disappears for a larger team of motors at zero load (Fig. 4). In this case, the reduction in velocity at high ATP concentrations is compensated by an increased persistence of a larger team of motors.
Cargo travel distance reduces with increasing load at all ATP concentrations
At nonzero loads, the travel distance reduces sharply when ATP concentration is lowered below 1000 μM. This is a consequence of the ATP‐dependent stall force of single dynein motors, which is lower at lower ATP concentrations. Hence, the load on individual motors can approach or exceed the single motor stall force very frequently at low ATP concentrations if the external load is non‐zero, resulting in higher detachment rates of motors. This higher detachment of motors at non‐zero loads and low ATP concentrations leads to a sharp decrease in travel distance as shown in Figure 4(B,C).
Our simulations show that the cargo travel distance at saturating ATP is higher than that at limiting ATP concentrations (Fig. 5). As discussed in the previous section, a sharp decrease in travel distance is expected when externally applied force approaches the value of stall force. The reason for this sharp decrease is the sharp discontinuity in the experimentally measured single motor detachment rate at stall force. This sharp decrease in cargo travel distance is observed at both high and low ATP. Because the value of single motor stall force in our model depends on ATP concentration, the magnitudes of externally applied loads at which these sharp decreases are observed are different for low and high ATP concentrations (Fig. 5).
Figure 5.
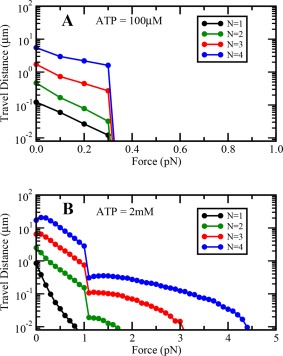
Variation of cargo travel distance with load at (A) low and (B) saturating ATP concentrations.
Further, the load at which the cargo travel distance sharply reduces does not depend very significantly on N (Fig. 5). For any N, as load on any single motor approaches the corresponding ATP dependent stall force, its detachment rate jumps up suddenly leading to its detachment with greater probability. The detachment of such engaged motors results in increased load on remaining engaged motors, leading to a catastrophic detachment of the remaining engaged motors. These catastrophic detachments result in a sharp drop in the travel distance of the cargo.
The force at which the travel distance of the cargo becomes equal to the single motor step‐size i.e. 8 nm can be taken as a measure of the collective stall force of a team of motors. If the externally applied load is greater than this collective stall force, then the cargo would stop moving forward. Our simulations show that this collective stall force increases almost linearly with N at saturating ATP concentrations, while it does not change much with N at limiting ATP concentrations.
Cargo persistence time becomes constant at very high loads
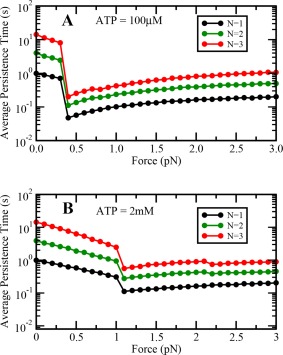
We define cargo persistence time as the total time spent by a cargo bound on the microtubule, and therefore it is a measure of the tenacity of the motor team engaged on the cargo. Cargo persistence time depends very strongly on load (Fig. 6). At low ATP concentrations (100 μM) [Fig. 6(A)], the cargo persistence time sharply reduces at the single motor stall force and then starts increasing slowly with the applied load. However, at higher ATP concentrations, the cargo persistence time sharply decreases at the single motor stall force and becomes almost constant thereafter. The catch‐bond state of multiple dynein motors engaged on the cargo at very high loads is responsible for almost constant cargo persistence time, as individual dynein motors have a constant load independent detachment rate at very high loads24 (see Fig. A4‐B in Appendix).
Figure 6.
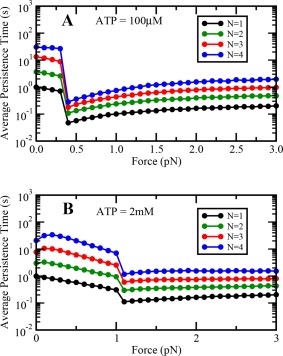
Variation of cargo persistence time with load at (A) low and (B) saturating ATP concentrations.
We find that the persistence time of cargo increases with the number of motors in the team. Thus, our results are qualitatively similar to the results of Rai et al., 25 where an increase in tenacity of the motor team was observed with an increase in motor number for both in vitro and in vivo dynein motors. However, our results are still different from the results on persistence time of a team of dynein motors in vivo by Leidel et al., 26 where an increase in persistence time with increasing load has been reported. We propose that the observed difference between our simulation results and experimental results of Leidel et al.26 could be due to a difference in the cargo dynamics in simulations and experiments. In our simulations, although cargos are subjected to a constant superstall force throughout yet they undergo small excursions, while in experiments cargos remained stationary under the influence of superstall loads until all motors detached from the microtubule.
Conclusion
Transport by a team of dynein motors plays a crucial role in generating large forces in diverse cellular processes, such as the movement of nuclei in migrating neurons, migration of fibroblast cells in wounded monolayers, transport of large nuclei in multinucleate muscle fibers9 and proper assembly of Golgi complex.27 Single molecule experiments have revealed that the function of single dynein motor depends on both the applied force and the fuel (ATP) concentration.
In this article, we have developed a stochastic model of cargo transport by a team of dynein motors which incorporates the effect of both applied load and ATP concentration. Our complete Monte‐Carlo model of single dynein uses a finite ATP hydrolysis probability at high forces and experimentally measured detachment kinetics of single dynein motors under load. We have quantified the variations in travel distance, travel velocity and persistence time of a cargo driven by a team of dynein motors over a wide range of ATP concentration and load values.
Because our model of single motor is mostly constrained by experimental data, it should be possible to test some of the important predictions of our model in in vitro experiments for its validation. For example, we find that a team of dynein motors will not be able to transport cargos under moderate load and limiting ATP concentrations. We also predict that a team of motor proteins would show persistence on microtubule at high loads and limiting ATP concentrations. One of our important predictions is that the velocity of a team of motor proteins would decrease at very high ATP concentrations. It should be possible to extend our model to include the effect of temperature on transport by a team of dynein motors. This can be done by first using the available experimental data28 to constrain the Monte‐Carlo model of single dynein and then using the model to understand how transport by a team of dynein motors can be regulated by changing the temperature.
A Persistence Time of Single Dynein Motor as a Function of Load at Different ATP Concentrations
The persistence time for a single dynein motor, at low and saturating ATP concentrations i.e. 100 μM and 2 mM, respectively, as a function of force are shown in Figure A4. Single dynein motors enter catch‐bond state at an ATP‐dependent stall force, where the persistence time of the motors increases with increasing load.
B Comparison of Results Obtained from Monte‐Carlo Models with In Vitro Results
The results from complete Monte‐Carlo model of single dynein with detachment kinetics are in excellent agreement with the previous Monte‐Carlo model of Singh et al.15 Variations in stall force with ATP concentration observed in in vitro experiments are compared with predictions from complete Monte‐Carlo model of dynein with detachment kinetics and Monte‐Carlo model of Singh et al.15 The results from both Monte‐Carlo models of single dynein do not vary significantly from the experimental values if the error bars are taken into account (Fig. A1). Similarly, the predicted step‐size distributions from complete Monte‐Carlo model of dynein with detachment kinetics and Monte‐Carlo model of Singh et al.15 are compared with in vitro experiments in Figure A2.
Figure A1.
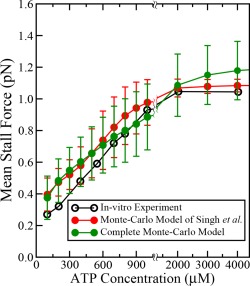
Comparison of results obtained from complete Monte‐Carlo model of single dynein and Monte‐Carlo model of Singh et al.15 with in vitro experiments 14 for variation of stall force with ATP concentration. The error bars shown are standard deviation calculated from 5000 configurations.
Figure A2.
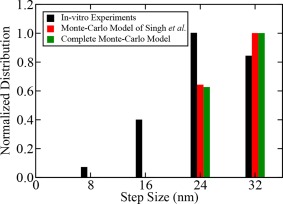
Comparison of results obtained from complete Monte‐Carlo model of single dynein and Monte‐Carlo model of Singh et al.15 with in vitro experiments14 for step‐size distribution.
Figure A3.
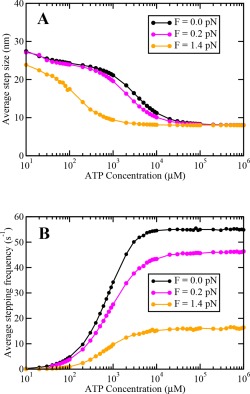
(A) Average step size and (B) average stepping frequency of a single dynein motor as a function of ATP concentration at different loads.
Figure A4.
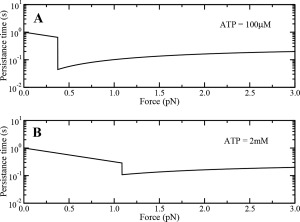
Variation of persistence time of single dynein motor as a function of load at (A) low and (B) saturating ATP concentrations.
C Effect of Increased Stepping Rate of Single Dynein under Forward Load
We explored the effect of increased stepping rate of single dynein under forward loads by increasing the ATP hydrolysis probability of dynein motor under forward load. To do this, we did not assume the load experienced by the motor to be zero when the motor was pulled forward i.e. value of load was substituted in Eqs. (8) and (9) with a negative sign. We found that at saturating ATP concentrations, there was a significant improvement in the travel distance and persistence time of a team of dynein motors at low backward loads. We further found that our results remain qualitatively similar at both high and low ATP concentrations (Figs. A5, A6, and A7).
Figure A5.
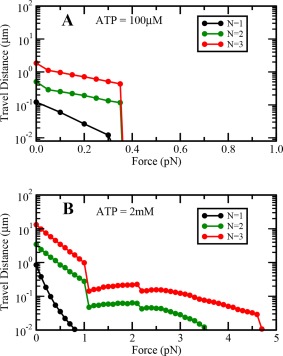
Variation of cargo travel distance with load at (A) low and (B) saturating ATP concentrations with increased stepping rate under forward loads.
Figure A6.
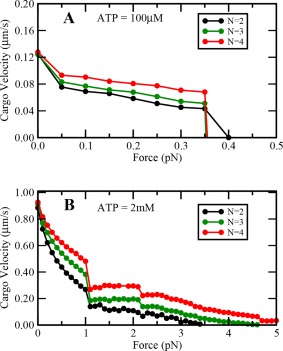
Variation of cargo travel velocity with load at (A) low and (B) saturating ATP concentrations with increased stepping rate under forward loads.
Figure A7.
Variation of cargo persistence time with load at (A) low and (B) saturating ATP concentrations with increased stepping rate under forward loads.
D Effect of Dynein Stiffness
To explore the effect of the stiffness of the motor on the cargo dynamics under load, we performed our simulations by increasing the value of stiffness by a factor of 4 and decreasing the value of stiffness by a factor of 4. We find that load‐dependent variation of travel distance, travel velocity, and persistence time remain qualitatively similar at saturating ATP concentrations under sub‐stall loads. We also find that differences in travel distance, travel velocity and persistence time increase with the number of motors in the team (Figs. A8, A9, and A10). When the motor stiffness is low, the values of travel distance, travel velocity and persistence time are higher at low backward loads. On the other hand, when the motor stiffness is high, the values of travel distance, travel velocity and persistence time are lower at low backward loads (Figs. A8, A9, and A10). This happens because more stiff motors can exert a higher amount of force for the same amount of motor stretch, and hence motors can detach faster. This results in reduced travel distance, travel velocity and persistence time of the dynein team.
Figure A8.
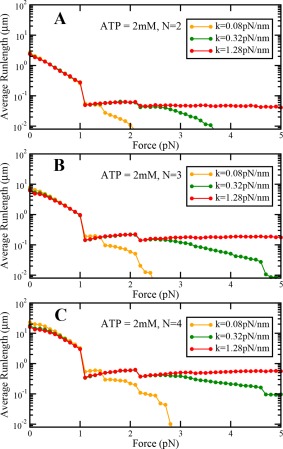
Variation of cargo travel distance with load at saturating ATP concentrations at different values of motor stiffness for (A) N = 2, (B) N = 3 and (C) N = 4.
Figure A9.
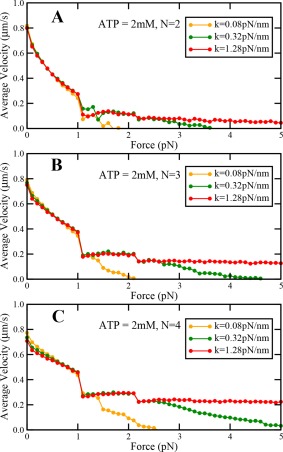
Variation of cargo travel velocity with load at saturating ATP concentrations at different values of motor stiffness for (A) N = 2, (B), N = 3 and (C) N = 4.
Figure A10.
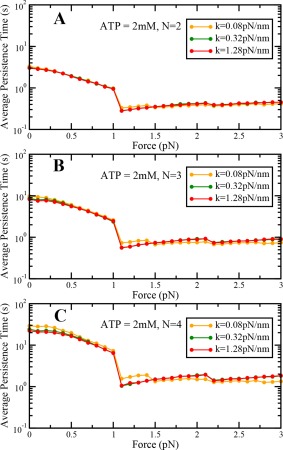
Variation of cargo persistence time with load at saturating ATP concentrations at different values of motor stiffness for (A) N = 2, (B) N = 3, and (C) N = 4.
However, at super‐stall loads, variation of travel distance, travel velocity and persistence time with stiffness is significantly different. We find that a team of stiff motors exhibits more persistent catch‐bond behavior, as demonstrated by their increased travel distances and persistence times at saturating ATP concentrations. The velocity of more stiff motors reduces more slowly with increasing load as compared to the less stiff motors in the super‐stall regime. Thus, cargo transport is more sustained in the super‐stall regime for a team of stiff motors. This is because more stiff motors have a greater chance of entering into catch‐bond state in comparison to the less stiff motors leading to more sustained transport.
The motors were allowed to attach to any discrete binding site (which were 8‐nm apart) on the microtubule within a distance l on either side of the cargo's center of mass in the simulations where we studied the effect of dynein stiffness and the effect of increased stepping rate of single dynein motor under forward load.
The list of parameters and their values used in our simulations are listed in Table 1.
Table 1.
Type, Name, and Values of Parameters Used in Our Stochastic Model of Cargo Transport by a Team of Dynein Motors
| Type of parameter | Name of parameter | Symbol | Value [source(s)] | ||
|---|---|---|---|---|---|
| Experimental | Step size of dynein motor | d | 8,16,24,32 nm14, 15 | ||
| Experimental | Rest length of dynein motor | l | 50 nm15 | ||
| Assumed | Stiffness of dynein motor | k | 0.32 pN 16, 17 | ||
| Experimental | Detachment force for dynein motor | F d | 0.87 pN16 | ||
| Fitting | Characteristic distance associated with on‐rates | d 0 | 6 nm15 | ||
| Fitting | First ATP binding on‐rate on dynein head at zero load |
|
|
||
| Fitting | Second ATP binding on‐rate on dynein head at zero load |
|
|
||
| Fitting | Third ATP binding on‐rate on dynein head at zero load |
|
|
||
| Fitting | Fourth ATP binding on‐rate on dynein head at zero load |
|
|
||
| Fitting | First ATP binding off‐rate on dynein head |
|
10 15 | ||
| Fitting | Second ATP binding off‐rate on dynein head |
|
250 15 | ||
| Fitting | Third ATP binding off‐rate on dynein head |
|
250 15 | ||
| Fitting | Fourth ATP binding off‐rate on dynein head |
|
250 15 | ||
| Fitting | Rate of ATP hydrolysis at zero load |
|
55 15 | ||
| Fitting | Rate of ATP reverse hydrolysis at zero load |
|
0.23 15 | ||
| Fitting | Dynein detachment rate under zero load | r detach | 1 16, 18 | ||
| Fitting | Dynein reattachment rate | r attach | 5 16, 18 | ||
| Fitting | Load‐dependent Hydrolysis Factor | A(s) | 1, 0.0115 | ||
| Assumed | Load distribution factors for ATP hydrolysis |
|
0.3,15 | ||
| Assumed | Load distribution factors for ATP reverse hydrolysis |
|
0.7,15 | ||
| – | Time step used in simulations |
|
s |
References
- 1. King SM (2011) Dyneins: structure, biology and disease. London: Elsevier. [Google Scholar]
- 2. Vale RD (2003) The molecular motor toolbox for intracellular transport. Cell 112:467. [DOI] [PubMed] [Google Scholar]
- 3. Pavin N, Tolić‐Nørrelykke IM (2013) Dynein, microtubule and cargo: a mnage trois. Biochem Soc Trans 41:1731. [DOI] [PMC free article] [PubMed] [Google Scholar]
- 4. Gable A, Qiu M, Titus J, Balchand S, Ferenz NP, Ma N, Collins ES, Fagerstrom C, Ross JL, Yang G, Wadsworth P (2012) Dynamic reorganization of Eg5 in the mammalian spindle throughout mitosis requires dynein and TPX2. Mol Biol Cell 23:1254. [DOI] [PMC free article] [PubMed] [Google Scholar]
- 5. Chowdhury D (2013) Stochastic mechano‐chemical kinetics of molecular motors: A multidisciplinary enterprise from a physicists perspective. Phys Rep 529:1. [Google Scholar]
- 6. Chowdhury D (2013) Modeling stochastic kinetics of molecular machines at multiple levels: from molecules to modules. Biophys J 104:2331. [DOI] [PMC free article] [PubMed] [Google Scholar]
- 7. Howard J (2001) Mechanics of motor proteins and the cytoskeleton. Sunderland, MA: Sinauer. [Google Scholar]
- 8. Zheng W, Fan D, Feng M, Wang Z (2009) The intrinsic load‐resisting capacity of kinesin. Phys Biol 6:036002. [DOI] [PubMed] [Google Scholar]
- 9. Mallik R, Rai AK, Barak P, Rai A, Kunwar A (2013) Teamwork in microtubule motors. Trends Cell Biol 23:575. [DOI] [PubMed] [Google Scholar]
- 10. Gross SP, Vershinin M, Shubeita GT (2007) Cargo transport: two motors are sometimes better than one. Curr Biol 17:R478. [DOI] [PubMed] [Google Scholar]
- 11. Carter AP (2013) Crystal clear insights into how the dynein motor moves. J Cell Sci 126:705. [DOI] [PubMed] [Google Scholar]
- 12. McKenney RJ, Vershinin M, Kunwar A, Vallee RB, Gross SP (2010) LIS1 and NudE induce a persistent dynein force‐producing state. Cell 141:304. [DOI] [PMC free article] [PubMed] [Google Scholar]
- 13. Kikkawa M (2013) Big steps toward understanding dynein. J Cell Biol 202:15. [DOI] [PMC free article] [PubMed] [Google Scholar]
- 14. Mallik R, Carter BC, Lex SA, King SJ, Gross SP (2004) Cytoplasmic dynein functions as a gear in response to load. Nature 427:649. [DOI] [PubMed] [Google Scholar]
- 15. Singh MP, Mallik R, Gross SP, Yu CC (2005) Monte Carlo modeling of single‐molecule cytoplasmic dynein. Proc Natl Acad Sci USA 102:12059. [DOI] [PMC free article] [PubMed] [Google Scholar]
- 16. Kunwar A, Tripathy SK, Xu J, Mattson MK, Anand P, Sigua R, Vershinin M, McKenney RJ, Yu CC, Mogilner A, Gross SP (2011) Mechanical stochastic tug‐of‐war models cannot explain bidirectional lipid‐droplet transport. Proc Natl Acad Sci USA 108:18960. [DOI] [PMC free article] [PubMed] [Google Scholar]
- 17. Kunwar A, Mogilner A (2010) Robust transport by multiple motors with nonlinear force‐velocity relations and stochastic load sharing. Phys Biol 7:16012. [DOI] [PMC free article] [PubMed] [Google Scholar]
- 18. Kunwar A, Vershinin M, Xu J, Gross SP (2008) Stepping, strain gating, and an unexpected force‐velocity curve for multiple‐motor‐based transport. Curr Biol 18:1173. [DOI] [PMC free article] [PubMed] [Google Scholar]
- 19. Thomas W (2008) Catch bonds in adhesion. Annu Rev Biomed Eng 10:39. [DOI] [PubMed] [Google Scholar]
- 20. Nicholas MP, Berger F, Rao L, Brenner S, Cho C, Gennerich A (2015) Cytoplasmic dynein regulates its attachment to microtubules via nucleotide state‐switched mechanosensing at multiple AAA domains. Proc Natl Acad Sci USA 112:6371. [DOI] [PMC free article] [PubMed] [Google Scholar]
- 21. Takshak A, Kunwar A (2016) Importance of anisotropy in detachment rates for force production and cargo transport by a team of motor proteins. Protein Sci 25:1075. [DOI] [PMC free article] [PubMed] [Google Scholar]
- 22. Fisher ME, Kolomeisky AB (1999) The force exerted by a molecular motor. Proc Natl Acad Sci USA 96:6597. [DOI] [PMC free article] [PubMed] [Google Scholar]
- 23. Reddy BJ, Mattson M, Wynne CL, Vadpey O, Durra A, Chapman D, Vallee RB, Gross SP (2016) Load‐induced enhancement of Dynein force production by LIS1‐NudE in vivo and in vitro. Nat Commun 7:12259. [DOI] [PMC free article] [PubMed] [Google Scholar]
- 24. Bhat D, Gopalakrishnan M (2012) Effectiveness of a dynein team in a tug of war helped by reduced load sensitivity of detachment: evidence from the study of bidirectional endosome transport in D. discoideum. Phys Biol 9:046003. [DOI] [PubMed] [Google Scholar]
- 25. Rai AK, Rai A, Ramaiya AJ, Jha R, Mallik R (2013) Molecular adaptations allow dynein to generate large collective forces inside cells. Cell 152:172. [DOI] [PubMed] [Google Scholar]
- 26. Leidel C, Longoria RA, Gutierrez FM, Shubeita GT (2012) Measuring molecular motor forces in vivo: implications for tug‐of‐war models of bidirectional transport. Biophys J 103:492. [DOI] [PMC free article] [PubMed] [Google Scholar]
- 27. Vinogradova T, Paul R, Grimaldi AD, Loncarek J, Miller PM, Yampolsky D, Magidson V, Khodjakov A, Mogilner A, Kaverina I (2012) Concerted effort of centrosomal and Golgi‐derived microtubules is required for proper Golgi complex assembly but not for maintenance. Mol Biol Cell 23:820. [DOI] [PMC free article] [PubMed] [Google Scholar]
- 28. Hong W, Takshak A, Osunbayo O, Kunwar A, Vershinin M (2016) The Effect of Temperature on Microtubule‐Based Transport by Cytoplasmic Dynein and Kinesin‐1 Motors. Biophys J 111:1287. [DOI] [PMC free article] [PubMed] [Google Scholar]


