

Abstract
Systems cell biology understanding of development requires characterization of all the molecules produced in the biological system. Decades of research and new-generation sequencing provided functional information on key genes and transcripts. However, there is less information available on how differential gene expression translates into the domains of functionally important proteins, peptides, and metabolites, and how changes in these molecules impact development. Mass spectrometry (MS) is the current technology of choice for the detection and quantification of large numbers of proteins and metabolites, because it requires no use of antibodies, functional probes, or a priori knowledge of molecules produced in the system. This review focuses on recent technologies that have improved MS sensitivity for proteins and metabolites and enabled new functionalities to assess their temporal and spatial changes during vertebrate embryonic development. This review highlights case studies, in which new-generation MS tools have enabled the study of hundreds-to-thousands of proteins and metabolites in tissues, cell populations, and single cells in model systems of vertebrate development, particularly the frog (Xenopus), zebrafish, and mouse. New-generation MS expands the toolbox of cell and developmental studies, raising exciting potentials to advance basic and translational research in the life sciences.
Keywords: Xenopus, mass spectrometry, proteins, metabolites, genes, single cell
Systems cell biological understanding of development requires characterization of the comprehensive suite of molecules that are produced as the single-cell zygote differentiates into all the different types of tissues and organs. Our view of developmental processes has been largely shaped by four decades of innovative embryological manipulations, functional evaluation of genes and gene products, usually one molecule at a time, and recently, by sequencing of the transcriptomes. However, processes of gene transcription, translation, and metabolism give rise to a vast molecular complexity that is yet to be uncovered. The human genome contains ~20,300 protein-coding genes (Dunham et al., 2012), which produce ~30,000 proteins spanning 7–10 log-order concentration range (Kim et al., 2014). The Human Metabolome Database currently contains ~42,000 small molecules with concentrations covering a similarly broad dynamic range (Wishart et al., 2013). How gene expression correlates with the spatiotemporal production of proteins and small molecules (called metabolites) or molecular activity states are controlled by post-translational modifications (PTMs) is less known. There is emerging information that metabolic reactions can have important impacts on development (Kaneko, 2016; Moussaieff et al., 2015; Onjiko et al., 2015), which suggests that our knowledge of proteomic and metabolomic effects on gene expression and the underlying molecular reactions are yet to be fully understood. Without molecular amplification, it has been technologically challenging to characterize molecular events downstream of gene transcription in sufficient depth (molecular coverage), sensitivity, or scalability to address proteomic-metabolomic processes across broad spatial (e.g., micrometers to centimeters) and temporal domains (e.g., seconds to days) during development.
Mass spectrometry (MS) is the analytical technology of choice for detecting and quantifying proteins and metabolites. MS is adoptable to virtually any type of “sample,” ranging from whole embryos and tissues, populations of cells and neurons, and sorted cells to even single cells and subcellular organelles. Mass spectrometers are able to directly detect (sequence) intact proteins, protein-related peptides, post-translational modifications (PTMs), or metabolites with exceptional, usually sub-mDa (sub-ppm) mass accuracy and capability for both discovery (untargeted) and targeted studies. Additionally, MS workflows can be streamlined to high reproducibility (e.g., quantitative error < 5% relative standard deviation), allowing for both absolute and relative quantification. With superior data quality, MS has become the technology of choice over traditional Western blotting (Aebersold et al., 2013). With MS, it is possible to detect hundreds of metabolites and thousands of proteins without necessitating functional probes or antibodies for each of these molecules. By analyzing ~1–50 μg of proteins, recent-generation MS enables the near complete coverage of the encoded proteomes (Hebert et al., 2014; Nagaraj et al., 2012; Picotti et al., 2013), providing powerful new types of data complementing Next Generation Sequencing. While these protein amounts can be readily harvested from embryos, tissues, or cell cultures, a challenge for cell/developmental studies has been the detection of low-abundance molecules and dynamic changes in the developing system, particularly when samples are limited, such as in small populations of cells, neurons, or single cells.
This review highlights recent MS technologies that have addressed these technological and knowledge gaps in MS sensitivity and cell/developmental biology. We focus on innovations in various fields of MS, including: (i) advanced sample collection enabling in situ/vivo and two- or three-dimensional molecular imaging; (ii) applications studying the correlation of the transcriptome and proteome; and (iii) improvements in detection sensitivity enabling single-cell measurements. We take this opportunity to apologize to the many researchers whose contributions could not be included here due to space limitation. To help readers cover additional topics, we provide references to excellent reviews in MS basics or applications. As shown in Figure 1, detection and quantification of proteins and metabolites employ dissimilar approaches to extract, separate, sequence, and identify these molecules by MS. In what follows, we discuss advances in these analytical steps that now provide exciting new capabilities and opportunities to better understand proteomic and metabolomics processes during embryonic development.
Figure 1.

General MS strategy to detect proteins (left column) and small molecules (right column) in Xenopus laevis embryos. Proteins and metabolites are extracted, processed, separated, and identified. Quantitative approaches are used to determine relative or absolute levels of hundreds-to-thousands of these molecules. (Figures adapted with permission from references (Lombard-Banek et al., 2016b; Onjiko et al., 2015; Onjiko et al., 2016b)).
Assessing Proteomic Processes
Because in developing systems not all genes are translated into proteins and protein activity can be altered by PTMs, such as phosphorylation, direct measurement of the proteome provides a direct window into the regulation of developmental processes. By enabling the simultaneous identification of hundreds-to-thousands of proteins, their PTMs, and their relative or absolute quantification, MS provides complementary information to the transcriptome (Guerrera and Kleiner, 2005; Walther and Mann, 2010). For example, liquid chromatography (LC) MS has identified clusters of proteins with different temporal translation patterns in developing Xenopus embryos, including declining levels for maternal and increasing concentrations for adult histone proteins (Sun et al., 2014). Furthermore, deep sequencing of transcripts and LC-MS-based quantification of ~5,000–10,000 proteins has revealed that these molecules exhibited moderate-to-poor global correlation in the developing zebrafish (Danio rerio) (Shaik et al., 2014) and Xenopus laevis (Peshkin et al., 2015; Smits et al., 2014) embryos. For example, Figure 2A compares temporal changes between transcription and translation from Xenopus laevis. Intriguingly, a mass action kinetics model has been able to account for protein dynamics based on RNA expression data (Peshkin et al., 2015), highlighting that development requires a complex interplay of biomolecules between the levels of the transcriptome and proteome with each providing unique insights to vertebrate development.
Figure 2.

Quantification of protein production in the developing Xenopus laevis embryo by MS. (A) Comparison of gene transcription and translation in the developing embryo using Next-Generation Sequencing and liquid chromatography MS. (B) Liquid chromatography MS detection of proteins in cells isolated from the embryo at different developmental stages. (C) Our single-cell capillary electrophoresis MS approach enabled the discovery characterization of protein differences between identified single cells in the 16-cell embryo (top panel). This technology found proteomic differences between neural-fated D11, epidermal-fated V11, and hindgut-fated V21 cells (bottom left panel). The analysis also revealed detectable proteomic heterogeneity between D11 cells that were isolated from different embryos (bottom right panel). (Figures adapted with permission from references (Lombard-Banek et al., 2016c; Lombard-Banek et al., 2016d; Peshkin et al., 2015; Sun et al., 2016).)
Various strategies have been developed to identify proteins by MS. In the “top-down” approach, entire proteins are directly detected using ultrahigh-resolution mass spectrometry. Advanced sequencing strategies (e.g., electron transfer dissociation) enable deep sequencing of proteins, which combined with exquisite resolution afforded by Fourier transform ion cyclotron resonance (FTICR) mass spectrometers is able to resolve protein isoforms and PTMs (reviewed in references (Catherman et al., 2014; Toby et al., 2016; Yates and Kelleher, 2013)). The “middle-down” approach uses enzymes to partially digest proteins into middle-sized protein fragments that are more readily analyzable with bench-top high-resolution mass spectrometers, typically equipped with Orbitrap- or time-of-flight (TOF)-type mass analyzers (reviewed in references (Sidoli et al., 2015; Wu et al., 2012)). As shown in Figure 1 (left panel), the most common, “bottom-up,” approach, proteolytic enzymes (e.g., trypsin) are used to convert proteins into small-to-middle-sized peptides (e.g., 5–25 amino acids), which are subsequently separated (e.g., by nano-flow LC, or nanoLC), ionized by nano-flow electrospray ionization (nanoESI), and sequenced by tandem MS (reviewed in references (Yates, 2013; Zhang et al., 2013)). Identification of proteins and PTMs are facilitated by advanced bioinformatics software tools capable of processing and displaying complex MS data through user-friendly interfaces (reviewed in references (Kumar and Mann, 2009; Yates, 2013; Zhang et al., 2013)).
Additionally, quantitative strategies have been diversified to quantify hundreds-to-thousands of proteins with high-fidelity across multiple samples; these samples correspond to different experimental conditions (e.g., wild type vs. knock out/down), types of tissues, stages of development (temporal progression), etc. For relative quantification, the two popular workflows rely on differentially barcoding proteins or peptides from the samples, followed by mixing of the barcoded samples to allow for the simultaneous quantification of these molecules. Stable-isotope labeling in cell cultures (SILAC) metabolically incorporates isotopically labeled (heavy) amino acids in vivo (Ong et al., 2002; Rose et al., 2013). Alternatively, designer mass tags have been developed to bar-code proteins or peptides via chemical reactions: tandem-mass tags (TMTs) (Thompson et al., 2006) and isobaric tags for relative and absolute quantification (iTRAQ) (Ross et al., 2004) have been commercialized, whereas diLeucine (DiLeu) (Frost and Li, 2016) have been synthetized in house. The alternative is label-free quantification (LFQ), which quantifies proteins based on spectral counting or ion signal abundance. LFQ combined with known concentrations of protein standards makes absolute quantification possible via intensity-based absolute quantification (iBAQ) (Cox et al., 2014).
These and other MS based technologies have enabled the identification and quantification of hundreds-to-thousands of proteins in developing systems. Representative studies are summarized in Table 1. Protein production has been analyzed in pooled oocytes and embryos from popular models of vertebrate development, including Xenopus laevis (Wuhr et al., 2014; Zhang et al., 2016) and the zebrafish (Lucitt et al., 2008; Shaik et al., 2014), and mammalian systems, such as the mouse (Wang et al., 2010), pig (Kim et al., 2011), cow (Deutsch et al., 2014), and buffalo (Chen et al., 2016); the list has even extended recently to human embryos (Virant-Klun et al., 2016). For example, more than ~1,000 proteins were identified and quantified by iTRAQ in pooled bovine embryos using nanoLC-ESI-MS, revealing striking differences in protein expression as the zygotes developed to the 2- and 4-cell stage embryos (Deutsch et al., 2014). In the developing Xenopus embryo, more than 11,000 proteins were identified by LC-MS (Wuhr et al., 2014). Surprisingly, many of these proteins lacked mRNA evidence in the egg, but are found in adult blood and liver, suggesting that certain proteins are accumulated from the mother’s blood plasma during oocyte growth and maturation. Furthermore, quantitative proteomics has tracked dynamic remodeling of the Xenopus laevis proteome as the egg (NF 0) developed into the nearly-hatched tadpole (NF 33) (Peshkin et al., 2015). Quantification of ~4,000 proteins between stages 1 and 22 using 2-dimensional nanoLC-MS and iTRAQ found dramatic changes in protein profiles during the mid-blastula transition in Xenopus laevis (Sun et al., 2014). Most recently, new-generation nanoLC and MS enabled the identification of ~450 proteins in single human oocytes (~100 ng of protein material), uncovering maturation-specific proteins between the germinal vesicle and the metaphase II stages (Virant-Klun et al., 2016).
Table 1.
Representative MS strategies to identify/quantify proteins or metabolites in models of vertebrate embryonic development. Key: n/a, not applicable.
| Size | Specimen | Molecules | MS Technology | Quant. | Remarks | Refs. |
|---|---|---|---|---|---|---|
| Pooled oocytes/embryos | Pig | Proteins | 2D-PAGE with MALDI and LC | Gel-based | Identified 28 proteins differentially expressed between germinal vesicle and metaphase II stages | (Kim et al., 2011) |
| Bovine | Proteins | LC | iTRAQ, SRM | Identified ~1,000 proteins and found proteomic differences between oocytes, zygotes, 2- and 4-cell embryo | (Deutsch et al., 2014) | |
| Buffalo | Proteins | LC | Label-free | Found important proteins involved in maturation of mammalian oocytes | (Chen et al., 2016) | |
| Zebrafish | Proteins | LC | n/a | Identified different proteins in embryos 72 and 120 dpf | (Lucitt et al., 2008) | |
| LC | Label-free | Compared mRNA expression with production of ~5,000 proteins | (Shaik et al., 2014) | |||
| Metabolites/Lipids | LC | n/a | Observed metabolic changes during embryogenesis | (Huang et al., 2013) | ||
| Mouse | Proteins | LC | Label-free | Found differently represented pathways in germinal vesicle and metaphase II stages | (Wang et al., 2010) | |
| X. laevis | Proteins | LC | Label-free; iBAQ | Performed deep quantitative analysis of the proteome and transcriptome and modeled mRNA-protein dynamics during embryonic development | (Peshkin et al., 2015; Wuhr et al., 2014) | |
| CE | Relative; absolute | Demonstrated fast analysis of proteins | (Zhang et al., 2016) | |||
| Metabolites | LC | n/a | Detected metabolites during cell cycles | (Vastag et al., 2011) | ||
| Single oocytes/embryos | X. laevis/tropicalis | Proteins | 2D-LC | iTRAQ | Found protein differences as the embryo develops | (Sun et al., 2014) |
| CE, LC | Label-free | Detected proteins in single fertilized eggs | (Smits et al., 2014) | |||
| Metabolites/Lipids | ToF-SIMS | n/a | Spatial imaging of lipids during fertilization and early embryonic development | (Tian et al., 2014) | ||
| MALDI | n/a | Found molecular markers of various tissues in the tadpole | (Goto-Inoue et al., 2016) | |||
| H. sapiens | Proteins | LC | Label-free | Found important proteins involved in maturation of human oocytes | (Virant-Klun et al., 2016) | |
| Bovine | Metabolites/Lipids | DESI | n/a | In-depth analysis of individual oocytes and blastocyst cultured in vitro | (Gonzalez-Serrano et al., 2013) | |
| MALDI | n/a | Lipid fingerprinting in tissue sections | (Ferreira et al., 2010; Tata et al., 2013) | |||
| Mouse | Proteins | MALDI | n/a | Imaged protein distributions in the pre-implantation embryo; validated MS results by in situ hybridization | (Burnum et al., 2008) | |
| Metabolites/Lipids | DESI | n/a | Identified lipids dysregulation during embryonic development | (Ferreira et al., 2012b) | ||
| Nano-DESI | n/a | 2D and 3D imaging of metabolic and lipid heterogeneity in mouse uterine decidual cells and embryo | (Lanekoff et al., 2015; Lanekoff et al., 2013) | |||
| MALDI | n/a | Imaged lipid differences between the implantation and inter-implantation sites of the uterus; detected lipid changes upon gene knock down | (Burnum et al., 2009; Ferreira et al., 2012b) | |||
| MALDI | n/a | Detected organ-specific LysoPtdCho and TAG distribution in the embryo and mouse tissues | (Hayasaka et al., 2008; Hayasaka et al., 2009) | |||
| NIMS | n/a | Found lipids/metabolites with heterogeneous distribution in vertebra | (Northen et al., 2007) | |||
| Zebrafish | Metabolites/Lipids | DESI | n/a | Imaged lipids in the embryo | (Pirro et al., 2016) | |
| Single Embryonic Cells | X. laevis | Proteins | CE | TMTs | Found proteomic differences between single blastomeres that have different tissue fates | (Sun et al., 2016) |
| CE-MS | Label-free | Demonstrated the first example of deep proteomic analysis of single cells in the cleavage-stage (16-cell) embryo; found proteomic differences between blastomeres of identical phenotype | (Lombard-Banek et al., 2016d) | |||
| LC-MS | Label-free | Found proteomic differences between progressively smaller blastomeres isolated from the 2- to 50-cell embryo | (Sun et al., 2016) | |||
| Metabolites | CE-MS | Label-free; absolute | Demonstrated the first example of deep metabolomic analysis of single cells in the cleavage-stage (16-cell) embryo; found metabolic cell heterogeneity along the dorsal-ventral, animal-vegetal, and left-right developmental axes; discovered small molecules capable of altering cell fates | (Onjiko et al., 2015; Onjiko et al., 2016b) | ||
| Subcellular Organelles | X. laevis | Proteins | LC-MS | Label-free | Quantified the distribution of ~9,000 proteins between the nucleus and cytoplasm in the oocyte; found passive retention to maintain the nuclear proteome | (Wuhr et al., 2015) |
| CE-MS | Label-free | Enabled in situ proteomic analysis in single blastomeres; identified proteomic differences between single blastomeres in the 16-to-128-cell embryo | (Lombard-Banek et al., 2016a) | |||
| Metabolites Lipids | LAESI | n/a | Enabled in situ profiling of metabolic differences between the vitelline membrane, cytoplasm, and animal-vegetal sides of the embryo | (Shrestha et al., 2014) | ||
| CE-MS | n/a | Enabled in situ analysis of metabolites in multiple cells in the 16-to-32-cell embryo | (Onjiko et al., 2016a; Portero et al., 2016) |
Over the last couple of years, MS sensitivity and quantification has been advanced to enable the characterization of gene translation in progressively smaller tissues and single cells by us (Choi et al., 2016; Lombard-Banek et al., 2016a; Lombard-Banek et al., 2016b; Lombard-Banek et al., 2016c; Lombard-Banek et al., 2016d) and others (Smits et al., 2014; Sun et al., 2014; Sun et al., 2016; Virant-Klun et al., 2016; Wuhr et al., 2015). Xenopus laevis has been a particularly powerful model to facilitate these technological advances by providing substantial amounts of proteins and considerably large cells with stereotyped tissue fates (Dale and Slack, 1987; Moody, 1987a, 1987b). For example, protein production has been measured in single eggs, small tissues, and small populations of cells that were isolated from the frog (Smits et al., 2014; Sun et al., 2014; Sun et al., 2016; Wuhr et al., 2015) or human (Virant-Klun et al., 2016) embryo.
In 2015, we developed a single-cell analysis pipeline, which enabled MS, for the first time, to characterize the production of hundreds of small molecules and thousands of proteins in single blastomeres (single cells) that were dissected from the cleavage-stage Xenopus laevis embryo (Lombard-Banek et al., 2016c; Onjiko et al., 2015). To analyze the miniscule amounts of proteins contained in these single cells, we have custom-built unique single-cell capillary electrophoresis (CE) instruments (Choi et al., 2016; Lombard-Banek et al., 2016c) that have advanced high resolution MS sensitivity to enable the detection of ~100–1,000-times smaller protein amounts than typical of traditional LC-MS (reviewed in reference (Lombard-Banek et al., 2016b)). Most recently, our single-cell CE-MS technology made it possible to detect 260-zmol, viz. 156,000 copies of peptides (Choi et al., 2016). This sensitivity is sufficient to measure key regulatory morphogens in the developing Xenopus embryo; for example, Chordin is found at ~6–12 nM in the extracellular space in the marginal ventral zone (Piccolo et al., 1996) and the Bone Morphogenic Proteins (BMPs) are present at the picomolar range (De Robertis and Kuroda, 2004). Using single-cell CE-MS, we have identified 1,709 different proteins between single blastomeres (Lombard-Banek et al., 2016c), while analyzing <0.2% of the total protein content of each cell. This approach has recently been adapted for LC-MS to quantify ~800 proteins in whole single dissected cells as the Xenopus laevis embryo developed from the 2- to the 50-cell stage (Sun et al., 2016). Despite progressively smaller amounts of proteins contained in the cells with each division (Fig. 2B), this study found increasing proteomic cell heterogeneity, likely as a result of commitment to different tissue fates. We have used single-cell CE-ESI-MS to compare proteins between different cell types in the 16-cell Xenopus laevis embryo (Lombard-Banek et al., 2016c). Our approach, shown in Figure 2C, begins with the dissection of identified single blastomeres, such as the D11, V11, and V21 cells from the embryo, followed by processing of the single-cell proteome before MS analysis takes place. Surprisingly, the D11, V11, and V21 blastomeres, which give rise to neural, epidermal, and hindgut tissues in Xenopus laevis (Moody, 1987a), exhibited different proteomic states in the 16-cell embryo (Fig. 2A, left panel). The list of identified proteins contained 900 gene products that have been detected at the level of transcripts. Additionally, these quantitative proteomic data uncovered gene translational heterogeneity between cells that occupy the animal-vegetal and dorsal-ventral axis of the embryo, which complements transcriptional cell heterogeneity only known along the animal-vegetal axis (Flachsova et al., 2013). Furthermore, we have also adapted LFQ for single-cell CE-MS to find proteins that are produced at comparable and variable levels between neural-fated blastomeres from different 16-cell embryos (Lombard-Banek et al., 2016b). Single-cell CE-ESI-MS has also allowed the detection of ~250–350 different proteins in protein digests that estimate the protein content of a handful-to-single neurons in the mouse cerebral cortex (Choi et al., 2016; Nemes et al., 2016), raising a potential to study the formation of cell heterogeneity in the nervous system.
MS can be utilized to probe protein expression with subcellular resolution, and Xenopus has been particularly helpful in these studies. In a recent work, the nucleus was dissected free from cytoplasm in ~40–50 Xenopus laevis embryos, and quantitative MS was used to determine the relative concentration of ~9,000 proteins between these subcellular domains (Wuhr et al., 2015). This study found most proteins to be enriched in either the nucleus or the cytoplasm, whereas ~20% of the identified proteins partitioned equally between these subcellular domains. Surprisingly, subcellular localization was governed by the native size of the protein above 100 kDa, whereas smaller proteins were co-localized between the nucleus and cytoplams. Most recently, we have utilized capillary microsampling to directly aspirate the cytoplasm of identified blastomeres in 16- to 128-cell live Xenopus laevis embryos and used single-cell CE-MS to identify ~450 proteins in these miniscule samples (Lombard-Banek et al., 2016a). As microsampling CE-MS is scalable to smaller cells and subcellular organelles, this new technology raises the possibility of investigating how differential translation of the genome orchestrates cell heterogeneity in the developing vertebrate embryo.
Furthermore, MS has been used to image the spatial localization of proteins in tissue sections from embryos. As illustrated in Figure 3, the most common form of MS imaging performs microprobe MS analysis of sectioned tissues pixel by pixel, usually by translating the tissue in two- or three dimensions (see X-Y-Z) and co-registering the absolute coordinate of analysis. Focused projectiles by laser light, mono- or polyatomic ions, or charged droplets or particles allow for desorbing/ablating proteins and metabolites with a broad imaging resolution, ranging from tens of nanometers to hundreds of micrometers. These molecules are subsequently ionized and mass-analyzed by a mass spectrometer. For any detected molecular signal, the spatial distribution is reconstructed post-data acquisition (reviewed in references (Bodzon-Kulakowska and Suder, 2016; Chaurand, 2012; Nemes and Vertes, 2012; Stauber et al., 2010)). For example, focused ultraviolet (UV) light by matrix-assisted laser desorption/ionization (UV MALDI) allowed for mapping the spatial distribution of various proteins in the implantation and interimplantation sites of the mouse uterus on different days of pregnancy (Burnum et al., 2008). In this work, the tissue distribution of many proteins found by MALDI MS imaging agreed with the localization of corresponding mRNA, which validated MALDI MS results. With scalable imaging resolution and requirement for no functional probes, MS imaging serves as a powerful alternative to in situ hybridization or immunohistochemistry to map the spatial heterogeneity of gene products in small regions of interest, such as tissues, organs, cells, or subcellular domains, which are difficult to dissect for analysis using GC-, LC-, or CE-MS.
Figure 3.
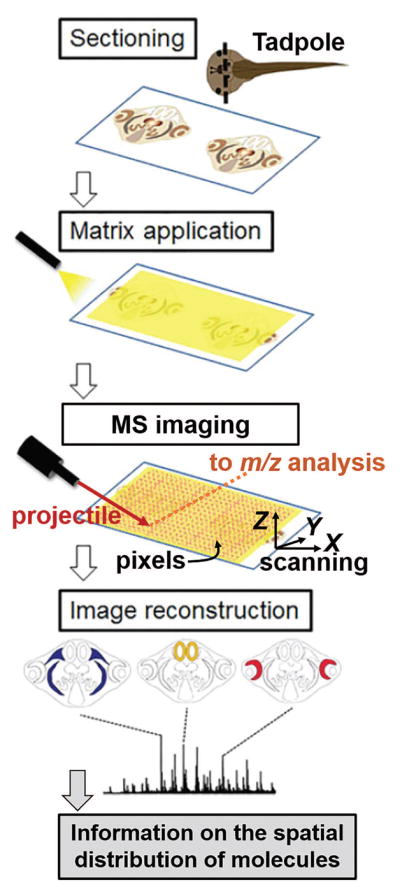
General strategy of mass spectrometry (MS) imaging. Focused projectiles (e.g., laser light, ions, charged particles or droplets) are used to desorb proteins and metabolites pixel by pixel on a sectioned sample (e.g., tadpole shown), usually by scanning the tissue section in three dimensions with an X-Y-Z translation stage. These molecules are ionized and detected by a mass spectrometer. The spatial distribution of the detected signal is reconstructed by mapping the ion signal abundance to the pre-recorded X-Y-Z coordinates. (Figure adapted with permission from reference (Goto-Inoue et al., 2016).)
Assessing Metabolomic Processes
The metabolome provides a powerful descriptor of a system’s phenotype for several reasons (Johnson et al., 2016). As these small molecules are downstream products of transcriptomic and proteomic events, the metabolome is influence by both intrinsic and extrinsic factors. Additionally, metabolite changes occur rapidly (e.g., minutes to seconds) and span broad concentration ranges (e.g., millimolar to nanomolar) and spatial dimensions (e.g., from cells to tissues). MS enables unbiased characterization of metabolic events with high specificity (confidence to identify metabolites) and quantitative accuracy (low error of quantification). Additionally, multiple MS strategies have enabled the acquisition of metabolic snapshots of developmental processes with high sensitivity, rapid execution, and capability for in situ/in vivo operation. As also exemplified in Table 1, these MS technologies have facilitated the assessment of transient molecular events, metabolic pathways, and spatially heterogeneous processes in developing systems. Investigating how metabolites are regulated raises a potential to better understand molecular pathways underlying cell and developmental processes (Johnson et al., 2016; Pirro et al., 2016), which are not necessarily detectable on the levels of the transcriptome or proteome.
Classical MS-based detection of metabolites relies on a number of sequential analytical steps to achieve a deep coverage of the metabolome. As shown in Figure 1 (right panel), the workflow starts with the extraction of metabolites from the sample using mixtures of organic solvents (methanol, acetonitrile, chloroform), and these molecules are subsequently separated by gas-chromatography (GC) (Huang et al., 2013), LC (Vastag et al., 2011), or CE (Onjiko et al., 2015) and ionized by electron impact ionization or ESI. Metabolite signals are identified by accurate mass measurements (<5 mDa accuracy), tandem MS, and comparison of these data to those measured for chemical standards or published in MS spectral repositories (reviewed in reference (Prasad et al., 2011)). For example, quantification of metabolites by LC-ESI-MS has revealed major metabolic changes during development of Xenopus laevis (Vastag et al., 2011) and zebrafish embryos (Huang et al., 2013). Figure 4A shows the clustering of 48 metabolites with different temporal production patterns in Xenopus (Vastag et al., 2011). This study found reproducible metabolic differences across multiple clutches, albeit with detectable variability for select metabolites. Furthermore, neutron-enriched (heavy) metabolites allowed the tracking of central metabolic pathways, such as the citric acid (Krebbs or TCA) cycle, suggesting that alanine and aspartate pools serve as energy sources of the developing embryo. Characterization of small-molecule networks, including the metabolism of glucose, lactate, pyruvate, or amino acids, can help quantify the energy state of developing systems and has been suggested as a means to evaluate the reproductive potential of pre-implantation mouse embryos (Botros et al., 2008).
Figure 4.

Uncovering metabolic processes during early development of the Xenopus laevis embryo. (A) By quantifying 48 different metabolites, LC-MS uncovered metabolomic remodeling during early embryonic development between stages 0 and 9. (B) Our single-cell analysis pipeline uncovered metabolic differences between single embryonic cells (blastomeres) in the 16-cell embryo (top panel). Metabolite network reconstruction based on the Kyoto Encyclopedia of Genes and Genomes (KEGG) (bottom left panel). Single-cell CE-ESI-MS revealed different metabolic activities between D11 and V11 cells; threonine and histidine were enriched in the V11 blastomere. Tracking cell fates by micro-injection of mRNA encoding the green fluorescent protein (GFP) (bottom right panels). D11 blastomeres, which normally give rise to neural tissues (see “Control”), alter their cell fate upon microinjection of histidine and threonine in a concentration endogenous to V11 cells (see “Altered Cell Fate”). Scale = 275 μm. (Figures adapted with permission from references (Onjiko et al., 2015; Vastag et al., 2011).)
Single-cell MS provides unprecedented molecular insights into cell fate differentiation. Although the traditional metabolomics approach by MS measures multiple cells to enhance detection sensitivity, averaging across cells risks losing important information characteristic of single cells, such as molecular mechanisms responsible for cell-specific tissue fates. To overcome sensitivity limitations in MS, we have recently developed an ultrasensitive single-cell CE-ESI-MS system capable of detecting 10 nM (or 60 amol) of metabolites and quantifying them across a 4–5 log-order concentration range (Onjiko et al., 2015). Figure 4B (top panel) shows our single-cell analysis workflow, which for the first time, enabled the discovery characterization of metabolite production in single blastomeres in the cleavage-stage Xenopus laevis embryo. It starts with the dissection of identified blastomeres from the 16-cell Xenopus laevis embryo that have distinct tissue fates: the midline dorsal-animal cell (named D11) is precursor to the retina and brain, the midline ventral-animal cell (named V11) gives rise primarily to the head and the trunk epidermis, and the midline ventral-vegetal cell (named V21) is precursor to the hindgut (Moody, 1987a). Next, we downscaled the typical metabolomics workflow (see Fig. 1, right panel) to efficiently extract metabolites from the dissected cells and used our single-cell CE-ESI-MS instrument to analyze the extracts. More than 300 metabolite signals were detected between these cells, about 60 of which were identified as small amino acids, energy carriers, classical neurotransmitters, and osmolites. Figure 4B (bottom left panel) shows the metabolic network reconstructed based on data from the Kyoto Encyclopedia of Genes and Genomes (KEGG). The quantitative MS data revealed surprising metabolic activity differences between the D11, V11, and V21 blastomeres. For example, D11 blastomeres were found to contain higher amounts of histidine, serine, threonine, and glycine than V11 cells, which suggests that the Ser-Gly-Thr pathway is more active in D11 compared to V11 cells. Furthermore, we tested the developmental significance for some of these metabolite differences. As expected, microinjection of the D11 blastomere with mRNA encoding the green fluorescent protein (GFP) revealed primary neural fates for this cell type (see central somite, lens, brain structures visible in “Control”). However, when the D11 blastomere in the 16-cell embryo was co-injected with a mixture of standard threonine and histidine in amounts that are naturally contained in the V11 cell, the cell fate was altered: the metabolite-injected D11 blastomeres gave rise primarily to epidermal tissue, which is the normal fate of the V11 blastomeres, as well as olfactory and cement gland tissues. Furthermore, single-cell CE-ESI-MS has recently uncovered metabolic differences between D1 blastomeres that are precursors to the left and right neural tissues in the 8-cell Xenopus laevis embryo (Onjiko et al., 2016b). Most recently, we have combined single-cell MS with capillary microsampling to determine metabolite production in single cells and cell clones in the 8-to-32-cell embryo (Onjiko et al., 2016a). Single-cell MS opens exciting new directions in cell and developmental biological studies, and Xenopus has been an ideal source of material for these technologies.
Other MS developments enable direct and rapid analysis of temporal or spatial metabolite profiles under ordinary experimental conditions. Over the last decade, more than 30 different MS technologies have been developed with a capability to work under ordinary experimental conditions, viz. ambient temperature and pressure (reviewed in references (Cooks et al., 2006; Harris et al., 2008; Nemes and Vertes, 2012)). These tools referred to as “ambient ionization MS” are uniquely suited to study small-molecules, including primary and secondary metabolites, acids, and lipids during developmental processes in situ and/or in vivo. Representative technologies are highlighted in Table 1. For example, by projecting fast-moving charged droplets to extract and ionize lipids in mouse (Ferreira et al., 2012a; Ferreira et al., 2012b), bovine (Ferreira et al., 2012a; Gonzalez-Serrano et al., 2013), porcine (Kim et al., 2011), sheep (McEvoy et al., 2000), and fish (Pirro et al., 2016) oocytes/embryos, desorption electrospray ionization (DESI) MS has exposed lipid differences across embryonic developmental stages, environmental growth conditions, or upon cryopreservation with imaging resolutions between ~50 and 150 μm (Pirro et al., 2016). For example, Figure 5A shows how DESI-MS has been used with principal component (PC) analysis as a discovery tool to find metabolic markers of unfertilized oocytes, blastocysts, and 2- and 4-cell mouse embryos (Ferreira et al., 2012a; Ferreira et al., 2012b). Similarly, using a focused mid-infrared laser beam, laser ablation electrospray ionization (LAESI) MS (Nemes and Vertes, 2007) profiled differences in the metabolic (e.g., lipidomic) composition of the vitelline membrane and egg cytoplasm as well as the animal and vegetal pole of the Xenopus laevis embryo with essentially no sample processing (Shrestha et al., 2014). These and other ambient ionization sources also enable the MS profiling and spatial imaging of broad types of metabolites with ~50–200 μm resolution (reviewed in reference (Nemes and Vertes, 2012)). Although optical microscopy certainly provides superior spatial resolution, ambient MS offers the advantage of detecting literally hundreds of metabolites and processing multiple oocytes/embryos within seconds-to-minutes, allowing one to study known but also to discover molecules with developmental significance. These include but are not limited to various lipids, signaling molecules, and metabolites that emerge with critical impact on normal implantation and embryonic development (Ferreira et al., 2012a). Alternatively, nano-DESI MS, which uses miniaturized microcapillaries for microprobe imaging with ~15–150–μm resolution, has captured the spatial distribution of ~300 metabolites in mouse uterine sections of implantation sites (Lanekoff et al., 2013). This study has found heterogeneous accumulation for many small molecules, including glutamine, acetyolcholine, and spermidine, with distinct molecular roles during development.
Figure 5.

Spatial mapping of metabolites in embryos and tadpoles with scalable imaging resolution. (A) Desorption electrospray ionization (DESI) MS for profiling lipid signatures at different developmental stages of the mouse embryo. (B) MALDI MS imaging of metabolites with tissue-specific accumulation in the Xenopus tropicalis tadpole (imaging resolution: 75 μm). (C) Nanostructure-initiator MS (NIMS) imaging of glycerophosphatidylcholine in the vertebra and the heart of the developing mouse embryo (imaging resolution: ~150 nm). (D) Time-of-flight secondary ion MS imaging (ToF-SIMS) of glycerophosphocholine/sphingomyelin fragment (m/z 125.0), sphingomyelin fragment (m/z 265.2), and monoacylglycerol fragment (m/z 313.3) in the animal side of the 2-, 8-, and 32-cell Xenopus laevis embryos. (Figures adapted with permission from references (Ferreira et al., 2012b; Goto-Inoue et al., 2016; Northen et al., 2007; Tian et al., 2014)).
Operation in vacuum allows many MS imaging technologies to track metabolite distributions in higher spatial resolution. As shown in Figure 5B, histological preparation of Xenopus tropicalis tadpoles into ~12 μm thick sections with MALDI MS imaging has found tissue-specific markers with 75-μm lateral resolution: carnosine and inosine monophosphate were enriched in muscle tissue, sphingomyelin (d18:1/16:0) was abundant in the notochord, and valine accumulated in the stomach region. UV MALDI has also profiled various phospholipids, including phosphatidylcholines, sphingomyelins, phosphatidylserines, phosphatidylinositols, and phosphoethanolamines, triacylglycerides, etc. in tissue sections from various organs of bovine (Ferreira et al., 2010; Tata et al., 2013) and mouse embryos (Hayasaka et al., 2008; Hayasaka et al., 2009). Similarly, using focused-UV light, nanostructure initiator MS (NIMS) has imaged various metabolites and lipids in the mouse embryo with ~150 nm resolution (Northen et al., 2007). For example, Figure 5C shows the detection of multiple metabolites in the heart and the imaging of glycerophosphatidylcholine in the developing vertebra of the mouse embryo. By utilizing tightly focused beams of electrons or monoatomic or polyatomic ions (e.g. C60+ or Au3+) to sputter metabolites in 10–100 nm resolution, time-of-flight secondary ionization MS (TOF-SIMS) has uncovered heterogeneous lipid distribution in zygotes and embryos of Xenopus laevis (Tian et al., 2014). For example, Figure 5D shows diverse lipid distributions between blastomere junctions in the animal side of the 2-to-32-cell embryos. The high-resolution molecular images by SIMS have captured potential egg-sperm lipid fusion sites and reorganization of the membrane in the cleavage-stage embryo.
MS imaging has also been made possible in three dimensions (3D). By serially sectioning the tissue of interest and performing 2D imaging on each section, MS techniques capable of lateral imaging can be used to determine the 3D metabolic and proteomic architecture of tissues. The other strategy to 3D imaging combines 2D imaging with progressive depth profiling at each pixel or sequential erosion of entire tissue layers using laser pulses or focused ion beams. For example, three-dimensional MS imaging has been demonstrated by MALDI (Seeley and Caprioli, 2012), DESI (Eberlin et al., 2010), nano-DESI (Lanekoff et al., 2015), LAESI (Nemes et al., 2009), and extreme ultraviolet laser ablation MS (Kuznetsov et al., 2015) (reviewed in references (Fletcher, 2015; Nemes and Vertes, 2012; Palmer and Alexandrov, 2015; Seeley and Caprioli, 2012)). Nano-DESI has recently been used to map the 3-dimensional metabolic architecture of the decidualizing mouse uterine tissue by imaging hundreds of small molecules in ~20 serial sections with ~150 μm resolution, revealing heterogeneous distributions for various metabolites, including choline, acetylcholine, and fatty acids as well as lipids, including lysophosphatidylcholines (Lanekoff et al., 2015).
Conclusions
Over the last decade, MS technologies have undergone rapid advancement in sensitivity and functionality to now enable the analysis of important molecular mechanisms in previously unavailable details. Xenopus has been an ideal model to facilitate the development and validation of ultrasensitive MS technologies by providing ample amounts of proteins and metabolites in large embryonic cells that have stereotyped tissue fates and can be readily isolated. Contemporary MS enables the characterization of hundreds-to-thousands of metabolites and proteins without requiring antibodies, functional probes, or prior knowledge of molecules that are present in the sample. Single-cell and imaging MS provide sufficient spatial and temporal resolution to uncover cell molecular mechanisms in developing vertebrate systems. This powerful bioanalytical tool is adaptable to many technologies currently used in basic and translational research, including optical imaging, molecular manipulations, and sequencing of genomes and transcriptomes. Interdisciplinary collaborations between physical and life scientists are key to developing next-generation MS tools. By enabling the detection of minute amounts of samples, dynamic metabolism, complex signaling pathways, and cellular heterogeneity in confined environments, MS is able to help answer important questions in basic cell and developmental biology, which in turn have important impacts in medicine, including but not limited to cancer, stem cell research, and tissue regeneration on demand. In combination with powerful cell and developmental models, such as Xenopus, zebrafish, and mouse, contemporary MS expands the bioanalytical toolbox of cell and developmental biology to raise exciting new potentials for understanding molecular mechanisms governing cell and developmental processes.
Acknowledgments
Grant Support:
National Institutes of Health: GM114854
National Science Foundation: MCB-1121711
Arnold and Mabel Beckman Foundation: Young Investigator Grant
The George Washington University: Start-up Funds
The George Washington University: Columbian College of Arts University Facilitating Funds
COSMOS Club Foundation Fellowship
This work was supported by the National Institutes of Health Grant GM114854 (to P.N.), the National Science Foundation Grant MCB-1121711 (to P.N.), the Arnold and Mabel Beckman Foundation Young Investigator Grant (to P.N.), the George Washington University Start-up Funds (to P.N.) and the Columbian College of Arts Facilitating Funds (to P.N.), and the COSMOS Club Foundation Fellowship (to R.M.O). The opinions and conclusions expressed in this publication are solely those of the authors and do not necessarily represent the official views of the funding sources. We thank Christina R. Ferreira (Purdue University, West Lafayette, IN) for helpful comments provided during the preparation of this manuscript.
Footnotes
CONFLICT OF INTEREST DISCLOSURE.
The author has no conflicts of interest.
References
- Aebersold R, Burlingame AL, Bradshaw RA. Western blots versus selected reaction monitoring assays: Time to turn the tables? Mol Cell Proteomics. 2013;12:2381–2382. doi: 10.1074/mcp.E113.031658. [DOI] [PMC free article] [PubMed] [Google Scholar]
- Bodzon-Kulakowska A, Suder P. Imaging mass spectrometry: Instrumentation, applications, and combination with other visualization techniques. Mass Spectrom Rev. 2016;35:147–169. doi: 10.1002/mas.21468. [DOI] [PubMed] [Google Scholar]
- Botros L, Sakkas D, Seli E. Metabolomics and its application for non-invasive embryo assessment in IVF. Mol Hum Reprod. 2008;14:679–690. doi: 10.1093/molehr/gan066. [DOI] [PMC free article] [PubMed] [Google Scholar]
- Burnum KE, Cornett DS, Puolitaival SM, Milne SB, Myers DS, Tranguch S, … Caprioli RM. Spatial and temporal alterations of phospholipids determined by mass spectrometry during mouse embryo implantation. J Lipid Res. 2009;50:2290–2298. doi: 10.1194/jlr.M900100-JLR200. [DOI] [PMC free article] [PubMed] [Google Scholar]
- Burnum KE, Tranguch S, Mi D, Daikoku T, Dey SK, Caprioli RM. Imaging mass spectrometry reveals unique protein profiles during embryo implantation. Endocrinology. 2008;149:3274–3278. doi: 10.1210/en.2008-0309. [DOI] [PMC free article] [PubMed] [Google Scholar]
- Catherman AD, Skinner OS, Kelleher NL. Top down proteomics: Facts and perspectives. Biochem Biophys Res Commun. 2014;445:683–693. doi: 10.1016/j.bbrc.2014.02.041. [DOI] [PMC free article] [PubMed] [Google Scholar]
- Chaurand P. Imaging mass spectrometry of thin tissue sections: A decade of collective efforts. J Proteomics. 2012;75:4883–4892. doi: 10.1016/j.jprot.2012.04.005. [DOI] [PubMed] [Google Scholar]
- Chen LS, Zhai LH, Qu CF, Zhang CP, Li S, Wu FL, … Shi DS. Comparative proteomic analysis of buffalo oocytes matured in vitro using iTRAQ technique. Sci Rep. 2016;6:31795. doi: 10.1038/srep31795. [DOI] [PMC free article] [PubMed] [Google Scholar]
- Choi SB, Zamarbide M, Manzini MC, Nemes P. Tapered-tip capillary electrophoresis nanoelectrospray ionization for ultrasensitive proteomics: The mouse cortex. J Am Soc Mass Spectrom. 2016 doi: 10.1007/s13361-016-1532-8. in print. [DOI] [PubMed] [Google Scholar]
- Cooks RG, Ouyang Z, Takats Z, Wiseman JM. Ambient mass spectrometry. Science. 2006;311:1566–1570. doi: 10.1126/science.1119426. [DOI] [PubMed] [Google Scholar]
- Cox J, Hein MY, Luber CA, Paron I, Nagaraj N, Mann M. Accurate proteome-wide label-free quantification by delayed normalization and maximal peptide ratio extraction, termed MaxLFQ. Mol Cell Proteomics. 2014;13:2513–2526. doi: 10.1074/mcp.M113.031591. [DOI] [PMC free article] [PubMed] [Google Scholar]
- Dale L, Slack JMW. Fate map for the 32-cell stage of Xenopus laevis. Development. 1987;99:527–551. doi: 10.1242/dev.99.4.527. [DOI] [PubMed] [Google Scholar]
- De Robertis EM, Kuroda H. Dorsal-ventral patterning and neural induction in Xenopus embryos. Annu Rev Cell Dev Biol. 2004;20:285–308. doi: 10.1146/annurev.cellbio.20.011403.154124. [DOI] [PMC free article] [PubMed] [Google Scholar]
- Deutsch DR, Frohlich T, Otte KA, Beck A, Habermann FA, Wolf E, Arnold GJ. Stage-specific proteome signatures in early bovine embryo development. J Proteome Res. 2014;13:4363–4376. doi: 10.1021/pr500550t. [DOI] [PubMed] [Google Scholar]
- Dunham I, Kundaje A, Aldred SF, Collins PJ, Davis CA, Doyle F, … Consortium EP. An integrated encyclopedia of DNA elements in the human genome. Nature. 2012;489:57–74. doi: 10.1038/nature11247. [DOI] [PMC free article] [PubMed] [Google Scholar]
- Eberlin LS, Ifa DR, Wu C, Cooks RG. Three-dimensional vizualization of mouse brain by lipid analysis using ambient ionization mass spectrometry. Angew Chem Int Ed. 2010;49:873–876. doi: 10.1002/anie.200906283. [DOI] [PMC free article] [PubMed] [Google Scholar]
- Ferreira CR, Eberlin LS, Hallett JE, Cooks RG. Single oocyte and single embryo lipid analysis by desorption electrospray ionization mass spectrometry. J Mass Spectrom. 2012a;47:29–33. doi: 10.1002/jms.2022. [DOI] [PubMed] [Google Scholar]
- Ferreira CR, Pirro V, Eberlin LS, Hallett JE, Cooks RG. Developmental phases of individual mouse preimplantation embryos characterized by lipid signatures using desorption electrospray ionization mass spectrometry. Anal Bioanal Chem. 2012b;404:2915–2926. doi: 10.1007/s00216-012-6426-4. [DOI] [PubMed] [Google Scholar]
- Ferreira CR, Saraiva SA, Catharino RR, Garcia JS, Gozzo FC, Sanvido GB, … Eberlin MN. Single embryo and oocyte lipid fingerprinting by mass spectrometry. J Lipid Res. 2010;51:1218–1227. doi: 10.1194/jlr.D001768. [DOI] [PMC free article] [PubMed] [Google Scholar]
- Flachsova M, Sindelka R, Kubista M. Single blastomere expression profiling of Xenopus laevis embryos of 8 to 32-cells reveals developmental asymmetry. Sci Rep. 2013;3:2278. doi: 10.1038/srep02278. [DOI] [PMC free article] [PubMed] [Google Scholar]
- Fletcher JS. 3D imaging of biological specimen using MS. Bioanalysis. 2015;7:2657–2666. doi: 10.4155/bio.15.158. [DOI] [PubMed] [Google Scholar]
- Frost DC, Li LJ. High-throughput quantitative proteomics enabled by mass defect-based 12-plex DiLeu isobaric tags. In: Sechi S, editor. Quantitative Proteomics by Mass Spectrometry. 2. Totowa: Humana Press Inc; 2016. pp. 169–194. [DOI] [PubMed] [Google Scholar]
- Gonzalez-Serrano AF, Pirro V, Ferreira CR, Oliveri P, Eberlin LS, Heinzmann J, … Cooks RG. Desorption electrospray ionization mass spectrometry reveals lipid metabolism of individual oocytes and embryos. PLoS One. 2013;8:e74981. doi: 10.1371/journal.pone.0074981. [DOI] [PMC free article] [PubMed] [Google Scholar]
- Goto-Inoue N, Kashiwagi A, Kashiwagi K, Mori T. Metabolomic approach for identifying and visualizing molecular tissue markers in tadpoles of Xenopus tropicalis by mass spectrometry imaging. Biology Open. 2016;5:1252–1259. doi: 10.1242/bio.019646. [DOI] [PMC free article] [PubMed] [Google Scholar]
- Guerrera IC, Kleiner O. Application of mass spectrometry in proteomics. Biosci Rep. 2005;25:71–93. doi: 10.1007/s10540-005-2849-x. [DOI] [PubMed] [Google Scholar]
- Harris GA, Nyadong L, Fernandez FM. Recent developments in ambient ionization techniques for analytical mass spectrometry. Analyst. 2008;133:1297–1301. doi: 10.1039/b806810k. [DOI] [PubMed] [Google Scholar]
- Hayasaka T, Goto-Inoue N, Sugiura Y, Zaima N, Nakanish H, Ohishi K, … Setou M. Matrix-assisted laser desorption/ionization quadrupole ion trap time-of-flight (MALDI-QIT-TOF)-based imaging mass spectrometry reveals a layered distribution of phospholipid molecular species in the mouse retina. Rapid Commun Mass Spectrom. 2008;22:3415–3426. doi: 10.1002/rcm.3751. [DOI] [PubMed] [Google Scholar]
- Hayasaka T, Goto-Inoue N, Zaima N, Kimura Y, Setou M. Organ-specific distributions of lysophosphatidylcholine and triacylglycerol in mouse embryo. Lipids. 2009;44:837–848. doi: 10.1007/s11745-009-3331-5. [DOI] [PubMed] [Google Scholar]
- Hebert AS, Richards AL, Bailey DJ, Ulbrich A, Coughlin EE, Westphall MS, Coon JJ. The one hour yeast proteome. Mol Cell Proteomics. 2014;13:339–347. doi: 10.1074/mcp.M113.034769. [DOI] [PMC free article] [PubMed] [Google Scholar]
- Huang SM, Xu F, Lam SH, Gong Z, Ong CN. Metabolomics of developing zebrafish embryos using gas chromatography- and liquid chromatography-mass spectrometry. Mol BioSyst. 2013;9:1372–1380. doi: 10.1039/c3mb25450j. [DOI] [PubMed] [Google Scholar]
- Johnson CH, Ivanisevic J, Siuzdak G. Metabolomics: beyond biomarkers and towards mechanisms. Nat Rev Mol Cell Biol. 2016;17:451–459. doi: 10.1038/nrm.2016.25. [DOI] [PMC free article] [PubMed] [Google Scholar]
- Kaneko KJ. Metabolism of preimplantation embryo development: A bystander or an active participant? In: DePamphilis ML, editor. Mammalian Preimplantation Development. San Diego: Elsevier Academic Press Inc; 2016. pp. 259–310. [DOI] [PubMed] [Google Scholar]
- Kim J, Kim JS, Jeon YJ, Kim DW, Yang TH, Soh Y, … Chae JI. Identification of maturation and protein synthesis related proteins from porcine oocytes during in vitro maturation. Proteome Sci. 2011;9:28. doi: 10.1186/1477-5956-9-28. [DOI] [PMC free article] [PubMed] [Google Scholar]
- Kim MS, Pinto SM, Getnet D, Nirujogi RS, Manda SS, Chaerkady R, … Pandey A. A draft map of the human proteome. Nature. 2014;509:575–581. doi: 10.1038/nature13302. [DOI] [PMC free article] [PubMed] [Google Scholar]
- Kumar C, Mann M. Bioinformatics analysis of mass spectrometry-based proteomics data sets. FEBS Lett. 2009;583:1703–1712. doi: 10.1016/j.febslet.2009.03.035. [DOI] [PubMed] [Google Scholar]
- Kuznetsov I, Filevich J, Dong F, Woolston M, Chao WL, Anderson EH, … Menoni CS. Three-dimensional nanoscale molecular imaging by extreme ultraviolet laser ablation mass spectrometry. Nat Commun. 2015;6:6944. doi: 10.1038/ncomms7944. [DOI] [PMC free article] [PubMed] [Google Scholar]
- Lanekoff I, Burnum-Johnson K, Thomas M, Cha J, Dey SK, Yang PX, … Laskin J. Three-dimensional imaging of lipids and metabolites in tissues by nanospray desorption electrospray ionization mass spectrometry. Anal Bioanal Chem. 2015;407:2063–2071. doi: 10.1007/s00216-014-8174-0. [DOI] [PMC free article] [PubMed] [Google Scholar]
- Lanekoff I, Burnum-Johnson K, Thomas M, Short J, Carson JP, Cha J, … Laskin J. High-speed tandem mass spectrometric in situ imaging by nanospray desorption electrosprayiIonization mass spectrometry. Anal Chem. 2013;85:9596–9603. doi: 10.1021/ac401760s. [DOI] [PMC free article] [PubMed] [Google Scholar]
- Lombard-Banek C, Moody SA, Nemes P. High-sensitivity mass spectrometry for probing gene translation in single embryonic cells in the early frog (Xenopus) embryo. Front Cell Dev Biol. 2016b;4:100. doi: 10.3389/fcell.2016.00100. [DOI] [PMC free article] [PubMed] [Google Scholar]
- Lombard-Banek C, Moody SA, Nemes P. Single-cell mass spectrometry for discovery proteomics: quantifying translational cell heterogeneity in the 16-cell frog (Xenopus) embryo. Angew Chem Int Ed. 2016c;55:2454–2458. doi: 10.1002/anie.201510411. [DOI] [PMC free article] [PubMed] [Google Scholar]
- Lombard-Banek C, Reddy S, Moody SA, Nemes P. Label-free quantification of proteins in single embryonic cells with neural fate in the cleavage-stage frog (Xenopus laevis) embryo using capillary electrophoresis electrospray ionization high-resolution mass spectrometry (CE-ESI-HRMS) Mol Cell Proteomics. 2016d;15:2756–2768. doi: 10.1074/mcp.M115.057760. [DOI] [PMC free article] [PubMed] [Google Scholar]
- Lucitt MB, Price TS, Pizarro A, Wu W, Yocum AK, Seiler C, … Grosser T. Analysis of the zebrafish proteome during embryonic development. Mol Cell Proteomics. 2008;7:981–994. doi: 10.1074/mcp.M700382-MCP200. [DOI] [PMC free article] [PubMed] [Google Scholar]
- McEvoy TG, Coull GD, Broadbent PJ, Hutchinson JS, Speake BK. Fatty acid composition of lipids in immature cattle, pig and sheep oocytes with intact zona pellucida. J Reprod Fertil. 2000;118:163–170. [PubMed] [Google Scholar]
- Moody SA. Fates of the blastomeres of the 16-cell Xenopus embryo. Dev Biol. 1987a;119:560–578. doi: 10.1016/0012-1606(87)90059-5. [DOI] [PubMed] [Google Scholar]
- Moody SA. Fates of the blastomeres of the 32-cell-stage Xenopus embryo. Dev Biol. 1987b;122:300–319. doi: 10.1016/0012-1606(87)90296-x. [DOI] [PubMed] [Google Scholar]
- Moussaieff A, Rouleau M, Kitsberg D, Cohen M, Levy G, Barasch D, … Nahmias Y. Glycolysis-mediated changes in acetyl-CoA and histone acetylation control the early differentiation of embryonic stem cells. Cell Metab. 2015;21:392–402. doi: 10.1016/j.cmet.2015.02.002. [DOI] [PubMed] [Google Scholar]
- Nagaraj N, Kulak NA, Cox J, Neuhauser N, Mayr K, Hoerning O, … Mann M. System-wide perturbation analysis with nearly complete coverage of the yeast proteome by single-shot ultra HPLC runs on a bench top orbitrap. Mol Cell Proteomics. 2012;11 doi: 10.1074/mcp.M111.013722. M111 013722. [DOI] [PMC free article] [PubMed] [Google Scholar]
- Nemes P, Barton AA, Vertes A. Three-dimensional imaging of metabolites in tissues under ambient conditions by laser ablation electrospray ionization mass spectrometry. Anal Chem. 2009;81:6668–6675. doi: 10.1021/ac900745e. [DOI] [PubMed] [Google Scholar]
- Nemes P, Vertes A. Laser ablation electrospray ionization for atmospheric pressure, in vivo, and imaging mass spectrometry. Anal Chem. 2007;79:8098–8106. doi: 10.1021/ac071181r. [DOI] [PubMed] [Google Scholar]
- Nemes P, Vertes A. Ambient mass spectrometry for in vivo local analysis and in situ molecular tissue imaging. Trends Anal Chem. 2012;34:22–34. [Google Scholar]
- Northen TR, Yanes O, Northen MT, Marrinucci D, Uritboonthai W, Apon J, … Siuzdak G. Clathrate nanostructures for mass spectrometry. Nature. 2007;449:1033–1036. doi: 10.1038/nature06195. [DOI] [PubMed] [Google Scholar]
- Ong SE, Blagoev B, Kratchmarova I, Kristensen DB, Steen H, Pandey A, Mann M. Stable isotope labeling by amino acids in cell culture, SILAC, as a simple and accurate approach to expression proteomics. Mol Cell Proteomics. 2002;1:376–386. doi: 10.1074/mcp.m200025-mcp200. [DOI] [PubMed] [Google Scholar]
- Onjiko RM, Moody SA, Nemes P. Single-cell mass spectrometry reveals small molecules that affect cell fates in the 16-cell embryo. Proc Natl Acad Sci U S A. 2015;112:6545–6550. doi: 10.1073/pnas.1423682112. [DOI] [PMC free article] [PubMed] [Google Scholar]
- Onjiko RM, Morris SE, Moody SA, Nemes P. Single-cell mass spectrometry with multi-solvent extraction identifies metabolic differences between left and right blastomeres in the 8-cell frog (Xenopus) embryo. Analyst. 2016b;141:3648–3656. doi: 10.1039/c6an00200e. [DOI] [PMC free article] [PubMed] [Google Scholar]
- Palmer AD, Alexandrov T. Serial 3D imaging mass spectrometry at its tipping point. Anal Chem. 2015;87:4055–4062. doi: 10.1021/ac504604g. [DOI] [PubMed] [Google Scholar]
- Peshkin L, Wuhr M, Pearl E, Haas W, Freeman RM, Gerhart JC, … Kirschner MW. On the relationship of protein and mRNA dynamics in vertebrate embryonic development. Dev Cell. 2015;35:383–394. doi: 10.1016/j.devcel.2015.10.010. [DOI] [PMC free article] [PubMed] [Google Scholar]
- Piccolo S, Sasai Y, Lu B, DeRobertis EM. Dorsoventral patterning in Xenopus: Inhibition of ventral signals by direct binding of Chordin to BMP-4. Cell. 1996;86:589–598. doi: 10.1016/s0092-8674(00)80132-4. [DOI] [PMC free article] [PubMed] [Google Scholar]
- Picotti P, Clement-Ziza M, Lam H, Campbell DS, Schmidt A, Deutsch EW, … Aebersold R. A complete mass-spectrometric map of the yeast proteome applied to quantitative trait analysis. Nature. 2013;494:266–270. doi: 10.1038/nature11835. [DOI] [PMC free article] [PubMed] [Google Scholar]
- Pirro V, Guffey SC, Sepulveda MS, Mahapatra CT, Ferreira CR, Jarmusch AK, Cooks RG. Lipid dynamics in zebrafish embryonic development observed by DESI-MS imaging and nanoelectrospray-MS. Mol BioSyst. 2016;12:2069–2079. doi: 10.1039/c6mb00168h. [DOI] [PMC free article] [PubMed] [Google Scholar]
- Prasad B, Garg A, Takwani H, Singh S. Metabolite identification by liquid chromatography-mass spectrometry. Trends Anal Chem. 2011;30:360–387. [Google Scholar]
- Rose CM, Merrill AE, Bailey DJ, Hebert AS, Westphall MS, Coon JJ. Neutron encoded labeling for peptide identification. Anal Chem. 2013;85:5129–5137. doi: 10.1021/ac400476w. [DOI] [PMC free article] [PubMed] [Google Scholar]
- Ross PL, Huang YLN, Marchese JN, Williamson B, Parker K, Hattan S, … Pappin DJ. Multiplexed protein quantitation in Saccharomyces cerevisiae using amine-reactive isobaric tagging reagents. Mol Cell Proteomics. 2004;3:1154–1169. doi: 10.1074/mcp.M400129-MCP200. [DOI] [PubMed] [Google Scholar]
- Seeley EH, Caprioli RM. 3D Imaging by mass spectrometry: A new frontier. Anal Chem. 2012;84:2105–2110. doi: 10.1021/ac2032707. [DOI] [PMC free article] [PubMed] [Google Scholar]
- Shaik AA, Wee S, Li RHX, Li Z, Carney TJ, Mathavan S, Gunaratne J. Functional mapping of the zebrafish early embryo proteome and transcriptome. J Proteome Res. 2014;13:5536–5550. doi: 10.1021/pr5005136. [DOI] [PubMed] [Google Scholar]
- Shrestha B, Sripadi P, Reschke BR, Henderson HD, Powell MJ, Moody SA, Vertes A. Subcellular metabolite and lipid analysis of Xenopus laevis eggs by LAESI mass spectrometry. PLoS One. 2014;9:e115173. doi: 10.1371/journal.pone.0115173. [DOI] [PMC free article] [PubMed] [Google Scholar]
- Sidoli S, Lin S, Karch KR, Garcia BA. Bottom-up and middle-down proteomics have comparable accuracies in defining histone post-translational modification relative abundance and stoichiometry. Anal Chem. 2015;87:3129–3133. doi: 10.1021/acs.analchem.5b00072. [DOI] [PMC free article] [PubMed] [Google Scholar]
- Smits AH, Lindeboom RGH, Perino M, van Heeringen SJ, Veenstra GJC, Vermeulen M. Global absolute quantification reveals tight regulation of protein expression in single Xenopus eggs. Nucleic Acids Res. 2014;42:9880–9891. doi: 10.1093/nar/gku661. [DOI] [PMC free article] [PubMed] [Google Scholar]
- Stauber J, El Ayed M, Wisztorski M, Salzet M, Fournier I. Specific MALDI-MSI: TAG-MASS. In: Rubakhin SS, Sweedler JV, editors. Mass Spectrometry Imaging: Principles and Protocols. Totowa: Humana Press Inc; 2010. pp. 339–361. [DOI] [PubMed] [Google Scholar]
- Sun LL, Bertke MM, Champion MM, Zhu GJ, Huber PW, Dovichi NJ. Quantitative proteomics of Xenopus laevis embryos: expression kinetics of nearly 4000 proteins during early development. Sci Rep. 2014;4:4365. doi: 10.1038/srep04365. [DOI] [PMC free article] [PubMed] [Google Scholar]
- Sun LL, Dubiak KM, Peuchen EH, Zhang ZB, Zhu GJ, Huber PW, Dovichi NJ. Single cell proteomics using frog (Xenopus laevis) blastomeres isolated from early stage embryos, which form a geometric progression in protein content. Anal Chem. 2016;88:6653–6657. doi: 10.1021/acs.analchem.6b01921. [DOI] [PMC free article] [PubMed] [Google Scholar]
- Tata A, Sudano MJ, Santos VG, Landim-Alvarenga FD, Ferreira CR, Eberlin MN. Optimal single-embryo mass spectrometry fingerprinting. J Mass Spectrom. 2013;48:844–849. doi: 10.1002/jms.3231. [DOI] [PubMed] [Google Scholar]
- Thompson A, Schaefer J, Kuhn K, Kienle S, Schwarz J, Schmidt G, … Hamon C. Tandem mass tags: A novel quantification strategy for comparative analysis of complex protein mixtures by MS/MS. Anal Chem. 2006;78:1895–1904. doi: 10.1021/ac0262560. [DOI] [PubMed] [Google Scholar]
- Tian H, Fletcher JS, Thuret R, Henderson A, Papalopulu N, Vickerman JC, Lockyer NP. Spatiotemporal lipid profiling during early embryo development of Xenopus laevis using dynamic ToF-SIMS imaging. J Lipid Res. 2014;55:1970–1980. doi: 10.1194/jlr.D048660. [DOI] [PMC free article] [PubMed] [Google Scholar]
- Toby TK, Fornelli L, Kelleher NL. Progress in top-down proteomics and the analysis of proteoforms. In: Bohn PW, Pemberton JE, editors. Annual Review of Analytical Chemistry. Vol. 9. Palo Alto: Annual Reviews; 2016. pp. 499–519. [DOI] [PMC free article] [PubMed] [Google Scholar]
- Vastag L, Jorgensen P, Peshkin L, Wei R, Rabinowitz JD, Kirschner MW. Remodeling of the metabolome during early frog development. PLoS One. 2011;6:e16881. doi: 10.1371/journal.pone.0016881. [DOI] [PMC free article] [PubMed] [Google Scholar]
- Virant-Klun I, Leicht S, Hughes C, Krijgsveld J. Identification of maturation-specific proteins by single-cell proteomics of Human oocytes. Mol Cell Proteomics. 2016;15:2616–2627. doi: 10.1074/mcp.M115.056887. [DOI] [PMC free article] [PubMed] [Google Scholar]
- Walther TC, Mann M. Mass spectrometry-based proteomics in cell biology. J Cell Biol. 2010;190:491–500. doi: 10.1083/jcb.201004052. [DOI] [PMC free article] [PubMed] [Google Scholar]
- Wang SF, Kou ZH, Jing ZY, Zhang Y, Guo XZ, Dong MQ, … Gao SR. Proteome of mouse oocytes at different developmental stages. Proc Natl Acad Sci U S A. 2010;107:17639–17644. doi: 10.1073/pnas.1013185107. [DOI] [PMC free article] [PubMed] [Google Scholar]
- Wishart DS, Jewison T, Guo AC, Wilson M, Knox C, Liu YF, … Scalbert A. HMDB 3.0-The human metabolome database in 2013. Nucleic Acids Res. 2013;41:D801–D807. doi: 10.1093/nar/gks1065. [DOI] [PMC free article] [PubMed] [Google Scholar]
- Wu C, Tran JC, Zamdborg L, Durbin KR, Li MX, Ahlf DR, … Kelleher NL. A protease for ‘middle-down’ proteomics. Nat Methods. 2012;9:822–824. doi: 10.1038/nmeth.2074. [DOI] [PMC free article] [PubMed] [Google Scholar]
- Wuhr M, Freeman RM, Presler M, Horb ME, Peshkin L, Gygi SP, Kirschner MW. Deep proteomics of the Xenopus laevis egg using an mRNA-derived reference database. Curr Biol. 2014;24:1467–1475. doi: 10.1016/j.cub.2014.05.044. [DOI] [PMC free article] [PubMed] [Google Scholar]
- Wuhr M, Guttler T, Peshkin L, McAlister GC, Sonnett M, Ishihara K, … Gygi SP. The nuclear proteome of a vertebrate. Curr Biol. 2015;25:2663–2671. doi: 10.1016/j.cub.2015.08.047. [DOI] [PMC free article] [PubMed] [Google Scholar]
- Yates JR. The revolution and evolution of shotgun proteomics for large-scale proteome analysis. J Am Chem Soc. 2013;135:1629–1640. doi: 10.1021/ja3094313. [DOI] [PMC free article] [PubMed] [Google Scholar]
- Yates JR, Kelleher NL. Top down proteomics. Anal Chem. 2013;85:6151–6151. doi: 10.1021/ac401484r. [DOI] [PMC free article] [PubMed] [Google Scholar]
- Zhang YY, Fonslow BR, Shan B, Baek MC, Yates JR. Protein analysis by shotgun/bottom-up proteomics. Chem Rev. 2013;113:2343–2394. doi: 10.1021/cr3003533. [DOI] [PMC free article] [PubMed] [Google Scholar]
- Zhang ZB, Sun LL, Zhu GJ, Cox OF, Huber PW, Dovichi NJ. Nearly 1000 protein identifications from 50 ng of Xenopus laevis zygote homogenate using online sample preparation on a strong cation exchange monolith based microreactor coupled with capillary zone electrophoresis. Anal Chem. 2016;88:877–882. doi: 10.1021/acs.analchem.5b03496. [DOI] [PMC free article] [PubMed] [Google Scholar]