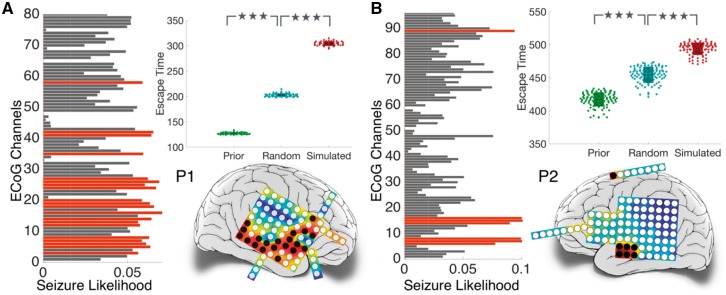
Figure 6.
Illustrating in silico approach for exploring surgical options. The seizure likelihood for each ECoG channel is shown in the bar plot. Higher seizure likelihood indicates more propensity to seize. Nodes with significantly higher seizure likelihood after FDR correction are indicated in red in the bar plot and their spatial locations are mapped on the electrode grids in black. Nodes are removed in the model brain to simulate surgical resection. The box plots show escape time for (i) original network (in green); (ii) resection of nodes with the highest seizure likelihood (in red); and (iii) resection of same number of random nodes, averaged over 100 instances (in blue). ***P < 0.0005.

