Traumatic brain injury (TBI) can lead to the neurodegenerative disease chronic traumatic encephalopathy (CTE). Using a computational TBI model, Ghajari et al. show that mechanical strain during head injury is greatest in sulci — the principal sites of CTE pathology — paving the way for improvements to areas such as helmet design.
Keywords: computational modelling, diffusion imaging, traumatic brain injury
Abstract
Traumatic brain injury can lead to the neurodegenerative disease chronic traumatic encephalopathy. This condition has a clear neuropathological definition but the relationship between the initial head impact and the pattern of progressive brain pathology is poorly understood. We test the hypothesis that mechanical strain and strain rate are greatest in sulci, where neuropathology is prominently seen in chronic traumatic encephalopathy, and whether human neuroimaging observations converge with computational predictions. Three distinct types of injury were simulated. Chronic traumatic encephalopathy can occur after sporting injuries, so we studied a helmet-to-helmet impact in an American football game. In addition, we investigated an occipital head impact due to a fall from ground level and a helmeted head impact in a road traffic accident involving a motorcycle and a car. A high fidelity 3D computational model of brain injury biomechanics was developed and the contours of strain and strain rate at the grey matter–white matter boundary were mapped. Diffusion tensor imaging abnormalities in a cohort of 97 traumatic brain injury patients were also mapped at the grey matter–white matter boundary. Fifty-one healthy subjects served as controls. The computational models predicted large strain most prominent at the depths of sulci. The volume fraction of sulcal regions exceeding brain injury thresholds were significantly larger than that of gyral regions. Strain and strain rates were highest for the road traffic accident and sporting injury. Strain was greater in the sulci for all injury types, but strain rate was greater only in the road traffic and sporting injuries. Diffusion tensor imaging showed converging imaging abnormalities within sulcal regions with a significant decrease in fractional anisotropy in the patient group compared to controls within the sulci. Our results show that brain tissue deformation induced by head impact loading is greatest in sulcal locations, where pathology in cases of chronic traumatic encephalopathy is observed. In addition, the nature of initial head loading can have a significant influence on the magnitude and pattern of injury. Clarifying this relationship is key to understanding the long-term effects of head impacts and improving protective strategies, such as helmet design.
Introduction
Traumatic brain injury (TBI) can lead to the neurodegenerative condition chronic traumatic encephalopathy (CTE). This is characterized by intracellular deposits of hyperphosphorylated tau, which have a distribution that is distinct from other neurodegenerative conditions such as Alzheimer’s disease (McKee et al., 2013). Tau pathology in CTE is seen in a perivascular location, particularly observed in the depths of sulci (Fig. 1). Subclinical head injuries sustained through sporting activities such as boxing and American football can produce CTE (McKee et al., 2009; Gavett et al., 2011), but a single TBI also results in abnormal tau pathology in the depths of sulci in a large proportion of long-term survivors of TBI (Johnson et al., 2012). A key question is how does the variable biomechanics of injuries relate to the development of long-lasting neuropathology. This is important, as an improved understanding would guide the development of more effective strategies to mitigate the long-term effects of TBI, such as new helmet designs.
Figure 1.
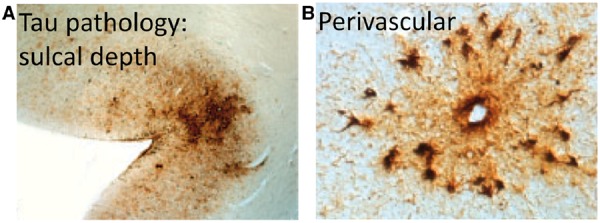
Chronic traumatic encephalopathy. (A) Distribution of tau pathology at the depths of sulci and (B) in a perivascular location in a post-mortem case of CTE. Courtesy of McKee et al. (2013).
An elegant approach to understanding the relationship between biomechanics and pathology is to study whether the mechanical responses of the brain at the time of an injury are maximal in areas where neuropathology is subsequently seen (Ommaya and Gennarelli, 1974; Margulies et al., 1990). Physical models of skull/brain and animal models of TBI have been used in the past to study this (Margulies et al., 1990; Meaney et al., 1995; Bayly et al., 2006), but their predictions have been limited by the instrumentation required to make observations during head loading. In addition, there are fundamental differences between these models and human brain, such as different structures, restricting their applicability to understanding the relationship between biomechanics and pathology in humans. Recent advances in computational capabilities and mechanics of biological tissues have enabled studying this relationship by using detailed computational models of head structure that incorporate mechanical tissue properties (Zhang et al., 2001). The finite element computational method is particularly useful as it enables the brain’s complex geometry and its non-linear time-dependent material response to be modelled, allowing the effects of different types of head impacts on brain deformation to be predicted.
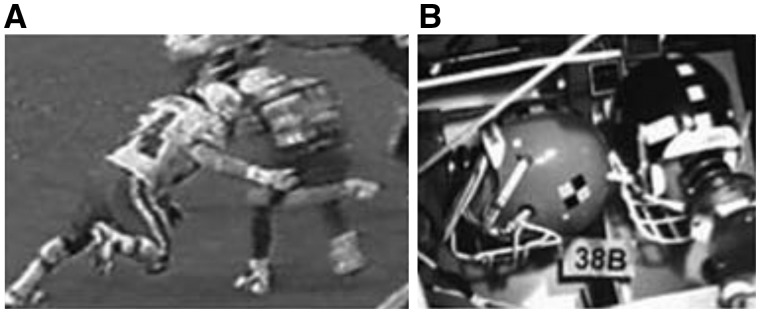
A limitation of previous finite element models is that they have neglected key anatomical features of the brain structure such as the sulci (Zhang et al., 2001; Willinger and Baumgartner, 2003; Kleiven, 2007; Post et al., 2014). As these are likely to be critical to understanding the distribution of brain injury after TBI we developed a high fidelity 3D finite element model of the human head that allowed a detailed investigation of brain deformation during impact loading (Fig. 2). We modelled three distinct types of injury, a helmet-to-helmet impact in an American football game (Fig. 3) (Viano et al., 2007); an occipital head impact due to a fall from ground level; and a road traffic accident involving a helmeted motorcyclist. The biomechanical properties of the sporting injury and the road traffic accident were more complex and we predicted that brain deformations would be more pronounced following these types of injury. The model predicted strain and strain rate, which are measures of local deformation and rate of deformation and have been shown to be linked to neurodegeneration in in vivo and in vitro models of TBI (Smith et al., 1999; Morrison et al., 2003; Elkin and Morrison, 2007; Tang-Schomer et al., 2010). The model’s predictions are of general theoretical interest in relation to the way in which biomechanical forces produce pathology after TBI, but here we tested the specific hypothesis that deformation would be greater in sulci than gyri as would be predicted by the location of neuropathology seen in CTE. To investigate further whether the predictions of the model mapped to real world outcomes, we used diffusion imaging techniques to map the brain abnormalities in a cohort of 97 patients following TBI. Diffusion tensor imaging has been widely used to estimate the long-term effects of TBI (Kinnunen et al., 2011; Sharp and Ham, 2011) and in a complementary analysis to the computational modelling, we tested whether diffusion tensor imaging (DTI) abnormalities were also greater in the sulci.
Figure 2.
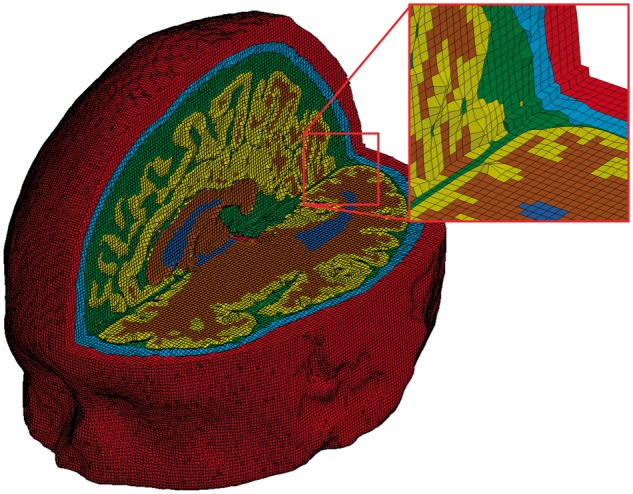
The finite element mesh of the high fidelity 3D model of traumatic brain injury. The colours indicate skin (red), skull (light blue), CSF (green), grey matter (yellow), white matter (brown) and ventricles (dark blue).
Figure 3.
A helmet-to-helmet impact in an American football game. (A) Video footage still, and (B) laboratory reconstruction. Courtesy of Viano et al. (2007).
Materials and methods
Injury modelling
The American football case involved a helmet-to-helmet collision (Fig. 3A), with the striking player hitting the left side of the struck player’s head resulting in ‘concussion’. The velocity of the striking player was estimated by analysing the video footage of the game (Fig. 3A) (Pellman et al., 2003). Then, the collision was reconstructed in the lab by representing the players with dummies (Fig. 3B), launching one dummy towards the other at the estimated impact velocity and measuring the accelerations of the struck dummy’s head. The second injury involved a fall from ground level to a marble floor leading to an occipital impact. We made an in silico reconstruction of this case by simulating the fall of a dummy (Ghajari et al., 2011) onto a rigid surface and recording the head accelerations. The third injury was a road traffic accident involving a collision between a motorcycle and a passenger car. The Transport Research Laboratory (TRL, UK) reconstructed the motorcyclist’s injury using a purpose-built helmet drop test facility (COST327, 2001). An instrumented headform was fitted inside a helmet identical to the accident helmet and its accelerations were measured during the impact. The location and velocity of the impact were adjusted to closely replicate the damage seen on the shell and liner of the accident helmet.
Finite element model of the human head
We developed a high fidelity 3D finite element model of the human head using high-resolution magnetic resonance images (1.75 × 1.75 × 2mm3 voxel size) of a healthy 34-year-old male subject. The images were segmented using the FMRIB and Freesurfer software (Smith et al., 2004; Fischl, 2012) and an in-house code was developed to generate the finite element mesh. The model consists of nearly one million hexahedral elements and a quarter of a million quadrilateral elements, representing 11 tissues, including the scalp, skull, brain, meninges, subarachnoid space and ventricles, as well as anatomical features such as sulci. A highly non-linear transient dynamic code, LS-DYNA (Hallquist, 2013), was used to set up the model and solve the equations using 20 cores of a high performance computer and 16 GB RAM.
The high fidelity head model was loaded by the translational and rotational accelerations obtained from the reconstruction of the impacts, simulating the first 30 ms after the loading initiation, except from the motorcycle accident where data were available for the first 20 ms of the head impact. For each element of the model, we determined the maximum principal value of the Green-Lagrange strain tensor () and the maximum principal value of the total time derivative of the Green-Lagrange strain tensor (Ė) (Holzapfel, 2000) that the element experienced during the simulation. is a measure of how much the element has been deformed with respect to its shape in the undeformed configuration and its maximum principal value, called strain here, is a measure of maximum stretch within the element. Ė is a measure of the time rate of deformation of the element and its maximum principal value, called strain rate here, is a measure of the maximum time rate of stretch within the element.
Material models and properties
Previous experimental work on the mechanics of brain tissue has shown that brain tissue deformation has a non-linear relationship with force and that brain tissue stiffens as the rate of deformation increases (Donnelly and Medige, 1997; Franceschini et al., 2006). We implemented these two important properties in our computational model by using a hyper-viscoelastic material model combining hyperelasticity and viscoelasticity. The non-linear isochoric (volume preserving) response of brain tissue was modelled with the Ogden hyperelastic model (Holzapfel, 2000), with a strain energy function of the form:
| (1) |
where , and are principal stretches of the brain tissue. and are material constants (Supplementary Table 1), which have been determined for brain tissue through curve fitting to experimental data obtained from stretching brain tissue (Franceschini et al., 2006; Kleiven, 2007). The rate-dependent behaviour of brain tissue was modelled with a convolution integral:
| (2) |
where is the long-term (or the equilibrium state) second Piola-Krichhoff stress tensor, obtained from the Ogden strain energy function given in Equation 1. is the relaxation function represented with a Prony series of the form:
| (3) |
where and are material constants (Supplementary Table 1), which have been determined through fitting the material model to the results of transient experiments on brain tissue (Nicolle et al., 2004; Kleiven, 2007).
The subarachnoid space, between the arachnoid and pia membranes, is occupied by delicate connective tissue filaments and intercommunicating channels containing the CSF. The non-linear mechanical behaviour of the subarachnoid space and ventricles were modelled with the hyperelastic model (n = 1) and the major extensions of the dura mater, i.e. falx and tentorium, and the pia mater, which envelopes the brain, were modelled with the hyper-viscoelastic material model. Material properties (Supplementary Table 2) were obtained from previous work (Aimedieu and Grebe, 2004; Maikos et al., 2008; Moore et al., 2009).
Neuroimaging participants
We next used neuroimaging to investigate whether abnormalities were found in areas predicted by the computational model. Data from 97 patients with TBI (30 females, mean age ± SD: 38.01 ± 12.45 years) and 51 healthy control subjects (30 females, mean age ± SD: 35.52 ± 17.65 years) were used. Patients and controls were matched for age [t(146) = − 0.99, P = 0.32] and gender. All TBI patients were investigated in the chronic phase after injury (>2 months, mean 28.6 months post-injury). The injury severity of TBI patients was classified according to the Mayo system (Malec et al., 2007): ‘Moderate-severe’ (n = 81 patients); ‘Mild (probable)’ (n = 9); and ‘Symptomatic (possible)’ (n = 7). Where the mechanism of injury was known, the mechanism was: road traffic accident (n = 41 patients); assault (n = 21); fall/syncope (n = 22); sports injury/concussion (n = 4); unknown (n = 9). All participants gave written consent, were checked for contraindications to MRI scanning and had no history of significant neurological or psychiatric illness prior to TBI. The Hammersmith, Queen Charlotte’s and Chelsea research ethics committee awarded ethical approval for the study.
Image acquisition
Standard protocols were used to acquire T1 structural and diffusion tensor MRI data using a Phillips Intera 3.0 T MRI scanner, an 8-array head coil, and sensitivity encoding (SENSE) with an under sampling factor of 2. For each participant, diffusion-weighted volumes with gradients applied in 64 non-collinear directions were collected. The following parameters were used: 73 contiguous slices, slice thickness = 2 mm, field of view 224 mm, matrix 128 × 128 (voxel size = 1.75 × 1.75 × 2 mm3), b value = 1000 and four images with no diffusion weighting (b = 0 s/mm2). Earplugs and padded headphones were used to protect participants’ hearing during the scanning procedure. We additionally collected a standard high-resolution T1 image for segmentation and image co-registration.
The DTI data included in these analyses substantially overlap with that used in two previous papers (Hellyer et al., 2013; Fagerholm et al., 2015). This previous work did not report any analyses of diffusion MRI abnormalities at the grey/white matter interface, which is the focus of this paper.
Structural imaging preprocessing
T1-weighted images were segmented using Freesurfer (Fischl et al., 2004b). This process resulted in an accurate reconstruction of the pial surface and white matter–grey matter boundary as a 3D surface for each of the left and right hemispheres within a conformed Freesurfer space. The Freesurfer surface was then subdivided into regions of interest according to the Destrieux Atlas (Fischl et al., 2004b), resulting in 152 regions across the cortex representing major sulci and gyri of the brain. We further classified each of these standard regions of interest as ‘gyrus’ or ‘sulcus’ according to their anatomical label. Where the anatomical label was unclear, or the region contained a mixture of both gyral and sulcal anatomy, we excluded this region of interest from further analysis. This resulted in regions of interest for 30 gyri and 33 sulci in each hemisphere (Supplementary Table 3).
Diffusion-weighted imaging preprocessing
Diffusion-weighted images were registered using a standard affine transformation to the b = 0 image to minimize distortion due to motion and eddy currents and then brain-extracted using Brain Extraction Tool from the FMRIB Software Library image processing toolbox (Smith et al., 2006). Fractional anisotropy maps were next generated from the diffusion-weighted images using the tensor-fitting algorithm in the FSL Diffusion Toolbox (Behrens et al., 2003). To assess fractional anisotropy in each subject at the interface between grey and white matter, individual b = 0 images were registered to the individuals Freesurfer surface extracted from the T1 image (see ‘Structural imaging preprocessing’ section) using boundary-based registration (Greve and Fischl, 2009). This b0-T1 surface registration was then applied to the individual’s fractional anisotropy map and data were sampled at each vertex in the Freesurfer white-matter surface model (Fig. 4), resulting in vertex-wise estimate of fractional anisotropy along the grey matter–white matter boundary in each subject. Repeated measures ANOVA was performed using custom MATLAB code (Natick, MA) across the group of TBI patients and healthy controls using age as a covariate of no interest to explore group-wise differences in fractional anisotropy at the white matter–grey matter boundary on a vertex-wise basis. Full-brain statistics were corrected for false discovery rate (FDR), where Q = 0.1.
Figure 4.
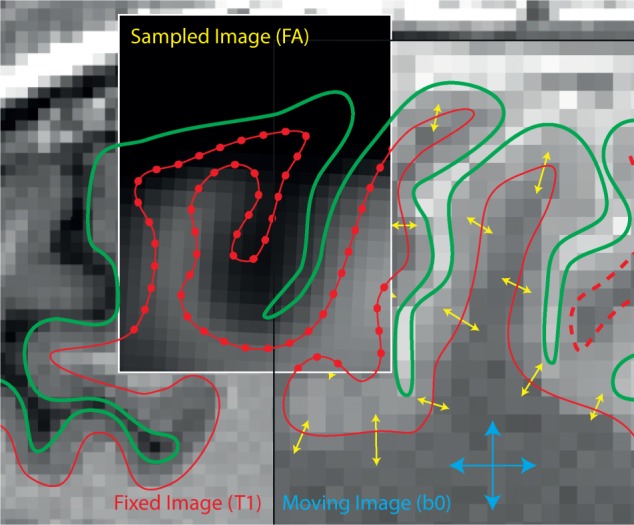
Boundary-based registration of diffusion data to the Freesurfer surface. The movable b0 image is registered to the T1 surface represented by the pial (green lines) and white matter surface (red lines), by maximizing contrast between grey matter and white matter in the movable (b0) image (Greve and Fischl, 2009). This registration is then applied to fractional anisotropy (FA) data and sampled at each vertex of the white matter surface (red dots).
Results
Computational modelling
American football case: maximal strain and strain rate in sites of tau pathology deposition
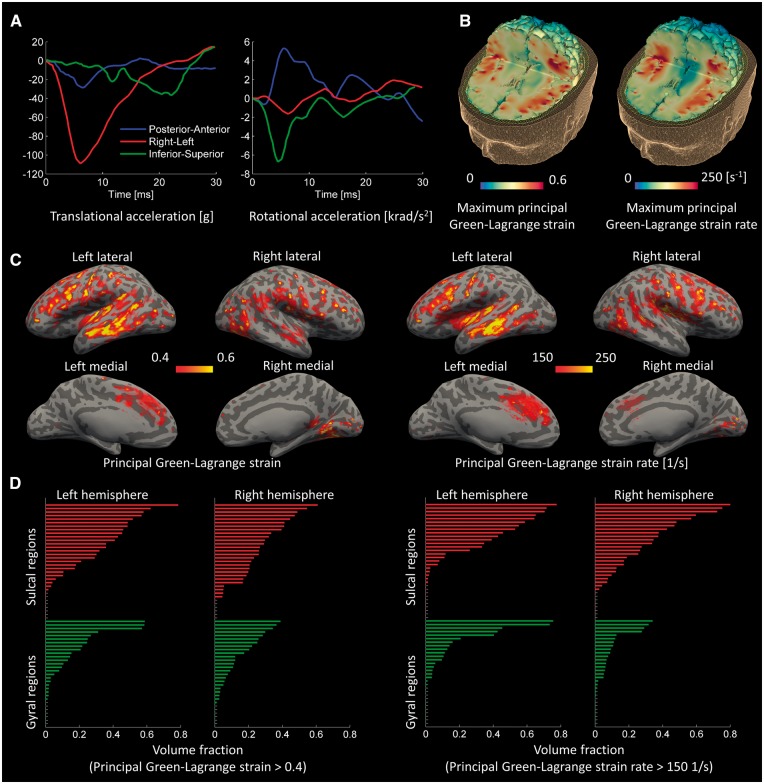
The head kinematics during this helmet-to-helmet impact showed an extended time course of accelerations with a large translational acceleration in left-right direction and large rotational accelerations about the posterior-anterior and inferior-superior axes (Fig. 5A). The finite element model predicted a patchy distribution of strain and strain rate within the brain, with both strain and strain rate being greatest in the sulci (Fig. 5B). We confirmed the distinction between the maximal strain and strain rate in the sulci and gyri by mapping out these fields at the grey–white matter interface (Fischl et al., 2004a; Fischl, 2012). Large strain and strain rate were seen quite symmetrically in the depths of sulci, as can be appreciated by predictions overlaid on an ‘inflated’ brain, where dark grey represents the sulci and light grey the gyri (Fig. 5C).
Figure 5.
Computational results for the American football case. (A) Time history of head accelerations; (B) strain and strain rate contours within the brain; (C) the predicted strain and strain rate measured at the grey-white matter interface and overlaid onto an ‘inflated’ brain image (gyral regions light grey and sulcal dark grey); (D) the volume fraction of sulcal and gyral regions exceeding strain and strain rate thresholds; the green bars indicate gyral regions and the red bars indicate sulcal regions (the sulcal and gyral regions are specified in Supplementary Figs 1 and 2).
We also showed the distinction between mechanical fields in the sulcal and gyral regions by performing a region of interest analysis within the 126 regions described above. We determined the volume fraction of the sulcal and gyral regions exceeding a strain value of 0.4 and a strain rate value of 150/s (Fig. 5D; for the name of the regions see Supplementary Figs 1, 2 and Supplementary Table 3). Strains and strain rates above these values, called thresholds here, are shown to lead to permanent brain tissue damage (Bain and Meaney, 2000; Morrison et al., 2003; Elkin and Morrison, 2007). The volume fraction of sulcal regions exceeding the strain and strain rate thresholds was significantly larger than that of gyral regions. Analysis of variance including hemisphere as a factor showed a main effect of cortical location [F(117) = 9.56, P = 0.002], the result of greater strain in the sulci than gyri. There was no interaction between hemisphere and cortical location, and no main effect of hemisphere. A similar analysis was performed for strain rate. There was a significant main effect of cortical location [F(117) = 9.92, P = 0.002], but no interaction between hemisphere and cortical location, and no main effect of hemisphere.
Fall case: maximal strain in sites of tau pathology deposition
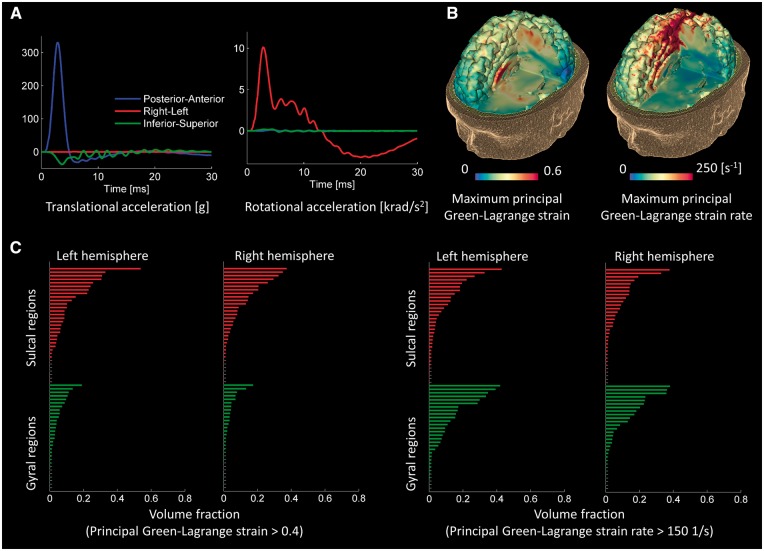
The fall to the ground had very different kinematics from the American football impact. The fall showed larger head accelerations, with the peak translational acceleration being three times larger. However, the accelerations were less temporally extended, with the majority of the acceleration pulses seen within the first 5 ms (Fig. 6A). Large strains were seen in some of the sulci and corpus callosum (Fig. 6B). Parts of the brain were also predicted to be exposed to high strain rates (Fig. 6B), but these were less clearly concentrated in the sulcal regions. To explore these effects in more detail, we used the region of interest analysis (Fig. 6C; for the name of the regions see Supplementary Figs 3, 4 and Supplementary Table 3). As in the case of the American football injury, analysis of variance showed a main effect of cortical location [F(117) = 19.48, P < 0.001], the result of greater strain in the sulci than gyri. There was no interaction between hemisphere and cortical location, and no main effect of hemisphere. For strain rate, there were no significant main effects and no interaction between hemisphere and cortical location.
Figure 6.
Computational results for the fall case. (A) Time history of head accelerations; (B) strain and strain rate contours within the brain; (C) the volume fraction of sulcal and gyral regions exceeding strain and strain rate thresholds. Green bars indicate gyral regions and the red bars indicate sulcal regions (the sulcal and gyral regions are specified in Supplementary Figs 3 and 4).
Road traffic accident: maximal strain and strain rate in sites of tau pathology deposition
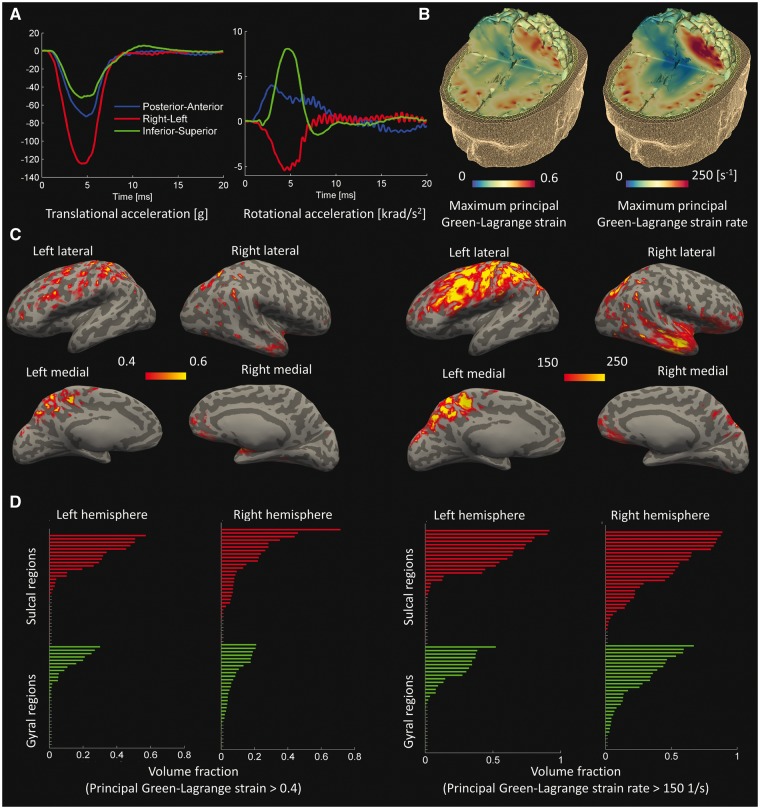
The head accelerations in the motorcycle accident were extended for longer than the fall case but were shorter than the American football case (Fig. 7A). The side impact to the helmet caused a large left-right translational acceleration and a large rotational acceleration about the inferior–superior axis, both comparable to the accelerations seen in the American football case. The model predicted patchy distributions for both strain and strain rate, with large values concentrated in the depths of sulci (Fig. 7B). The contours of strain and strain rate mapped at the grey-white matter interface also showed large values focused more in sulcal regions (Fig. 7C). This was confirmed by the region of interest analysis, which showed that in both hemispheres a greater volume of sulci exceeded the strain and strain rate thresholds (Fig. 7D; for the name of the regions see Supplementary Figs 5, 6 and Supplementary Table 3). Analysis of variance showed a main effect of cortical location [F(117) = 9.76, P = 0.002], again the result of greater strain in the sulci than gyri. There was no interaction between hemisphere and cortical location, and no main effect of hemisphere. For strain rate there was a significant main effect of cortical location [F(117) = 7.60, P = 0.007], but again no interaction between hemisphere and cortical location, and no main effect of hemisphere.
Figure 7.
Computational results for the road traffic accident case. (A) Time history of head accelerations; (B) strain and strain rate contours within the brain; (C) the predicted strain and strain rate measured at the grey-white matter interface and overlaid onto an ‘inflated’ brain image (gyral regions light grey and sulcal dark grey); (D) the volume fraction of sulcal and gyral regions exceeding strain and strain rate thresholds. Green bars indicate gyral regions and the red bars indicate sulcal regions (the sulcal and gyral regions are specified in Supplementary Figs 5 and 6).
Distinct patterns of sulcal strain and strain rate in different injury mechanisms
We then compared the magnitude of predicted injury between the American football case, the fall case and the road traffic accident case. A repeated measures ANOVA with three factors was performed: cortical location (gyral/sulcal), injury mechanism (road traffic accident, American football injury and fall), and hemisphere. For strain, there were main effects of cortical location [F(117) = 26.2, P < 0.001] and injury mechanism [F(238) = 20.69, P < 0.001], but no interaction between cortical location and injury mechanism i.e. all three types of injury produced similarly increased strain in the sulci (Supplementary Fig. 7A). There was no effect of hemisphere and no other significant interactions. For strain rate, there were main effects of cortical location [F(117) = 14.14, P < 0.001] and injury mechanism [F(238) = 13.95, P < 0.001], but not hemisphere. Additionally, there was an interaction between cortical location and injury mechanism [F(236) = 5.04, P = 0.007]. This interaction is explained by the presence of an effect of cortical location in the American football and road traffic accident cases, compared to the fall case (Supplementary Fig. 7B). Strain rate was higher in the sulci than the gyri for American football [F(117) = 9.92, P = 0.002] and road traffic accident [F(117) = 7.60, P = 0.007], but not the fall model. The effect of injury on strain was significantly different for all three injury types (pairwise comparisons P < 0.05). The strongest effect was seen in American football (0.184 ± 0.188), followed by road traffic accident (0.107 ± 0.148), then fall (0.075 ± 0.100). The effect of injury on strain rate was also significantly different for all three injury types (pairwise comparisons P < 0.05). However, the strongest effect was seen in road traffic accident (0.246 ± 0.273), followed by American football (0.166 ± 0.217), then fall (0.099 ± 0.114).
Neuroimaging
Evidence for damage at the grey–white matter interface in patients with traumatic brain injury
A similar difference between sulcal and gyral changes was seen when DTI data were examined from a group of TBI patients. Fractional anisotropy was used to quantify white matter integrity (Kinnunen et al., 2011), at the grey–white matter boundary, which is commonly disrupted after diffuse axonal injury (Sharp et al., 2014). To compare with the predictions made by our computational model we specifically focused on fractional anisotropy at the interface between white matter and the cortex. Similar to the predictions of the computational model, this approach demonstrated a patchy distribution of white matter reductions in tissue integrity in the TBI patients compared to healthy control subjects (Fig. 8). Significant reductions in fractional anisotropy in the patients relative to controls were seen in sulcal regions (dark grey areas).
Figure 8.
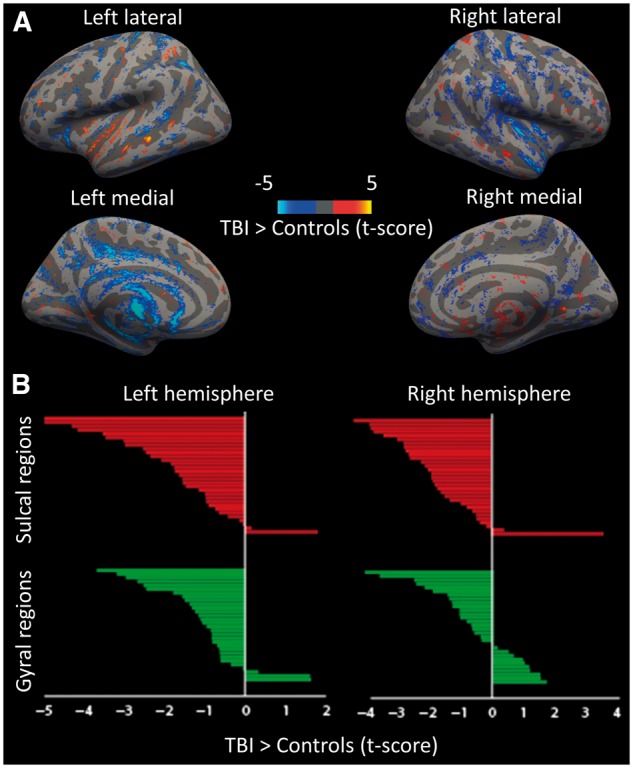
Empirical neuroimaging results from 97 patients with TBI and 51 healthy control subjects. (A) Whole brain multiple regression of fractional anisotropy at the white matter–grey matter boundary. Contrast of TBI > Control, threshold at t > 1.6. (B) The region of interest analysis; the green bars indicate gyral regions and the red bars indicate sulcal regions.
To explore this effect in more detail, we used a region of interest-based approach within the 126 regions described above in a repeated measures ANOVA analysis with group (TBI/controls) as a between subjects’ factor and region (sulci/gyri) as a within subjects factor. In addition, we included age and hemisphere as covariates. There was a significant main effect of group [F(1,145) = 8.963, P < 0.01], as well as a significant overall effect of region [F(1,145) = 32.362, P < 0.001]. Crucially, there was also a significant interaction between group and region [F(1,145) = 6.365, P = 0.02], driven by an increase in the difference between gyral and sulcal fractional anisotropy in the patient group compared to the controls. Unexpectedly, there was also an interaction between group, region and hemisphere [F(1,145) = 16.425, P < 0.001]. To explore these interactions in more detail, we performed post hoc t-tests, which demonstrated that the pairwise interactions were driven by a significant decrease in fractional anisotropy in the patient group compared to controls within the sulci [left t(145) = − 3.37, P < 0.001; right t(145) = − 3.18 P < 0.005], which was not statistically significant in the gyri.
Discussion
We show that the predicted pattern of brain tissue deformation during head impact corresponds with the distribution of neuropathology reported in cases of CTE. Our high fidelity computational model of the human head included accurate sulcal anatomy, which provided a more accurate approach to modelling TBI and allowed this analysis to be performed. The computational predictions provide a link between the pattern of mechanical loading of brain tissue and the development of neurodegeneration after TBI. Converging evidence for the relevance of this observation is provided by the presence of diffusion MRI abnormalities at the same sulcal location in a large group of TBI patients.
High strain and strain rate is seen within the sulci, which is a prominent location for tau pathology in cases of CTE and also in long-term survivors of single TBI (Johnson et al., 2012). These measures of tissue deformation have been shown in in vivo and in vitro models of TBI to have a clear relationship to neurodegeneration (Smith et al., 1999; Bain and Meaney, 2000; Morrison et al., 2003; Cater et al., 2006; Singh et al., 2006; Elkin and Morrison, 2007; Tang-Schomer et al., 2010). For example, biaxial stretching of brain tissue slices produced cell death that strongly correlated with strain and strain rate (Morrison et al., 2003; Elkin and Morrison, 2007). Importantly, neurodegeneration is mainly seen when strain and strain rate cross particular thresholds (Morrison et al., 2003), and our model predicted that large amounts of sulcal tissue are exposed to strains and strain rates above these thresholds following relatively minor head injuries. The predictions of our model provide an explanation for the gross anatomical distribution of tau pathology seen in CTE. At the microscopic level, the perivascular deposition of tau in these areas might be explained by blood–brain barrier injury, which has been shown to be related to high strain but not strain rate (Shreiber et al., 1997, 1999), or perhaps the effects of inhomogeneity in the displacement field across a region produced by the presence of a blood vessel (Cloots et al., 2011).
We simulated three brain injury cases. These had very different head kinematics. Distinct patterns of brain deformation were predicted. The American football case involved a helmet-to-helmet impact. This resulted in acceleration pulses with smaller magnitudes but longer duration due to the compliance properties of both players. In contrast, the fall case involved head impact onto a rigid surface, resulting in head accelerations with larger magnitudes over a much shorter time. In the motorcycle accident, the helmeted head impact onto a rigid surface resulted in head accelerations with magnitudes similar to the American football impact but durations shorter than the American football impact and longer than the fall. The strains produced by head impact were largest in the American football case, which is consistent with previous studies demonstrating that acceleration pulses with longer duration generate larger strains within the brain (Margulies and Thibault, 1992; Kleiven, 2006). In contrast, strain rates were larger in the road traffic accident case and intermediate in the American football case. This might be related to the differences between the magnitude and duration of the acceleration pulse in these cases leading to variable responses of the brain due to its viscoelastic nature (Donnelly and Medige, 1997). The viscoelastic characteristic of neurons makes them more brittle when the rate of deformation increases, leading to their lower damage threshold to strain at higher strain rates (Elkin and Morrison, 2007; Tang-Schomer et al., 2010). Hence, high strain rates might produce more injury, and so our model results would predict that the road traffic and American football cases would be more likely to produce pathology in the sulci. This comparison indicates that nature of the initial head impact can have a significant influence on the pattern of brain injury parameters, which is likely to influence the likelihood of the development of long-term brain damage.
DTI provided converging evidence about the presence of persisting sulcal damage following TBI. DTI provides an estimate of axonal injury after TBI (Mac Donald et al., 2007) of the type that can be produced by strain applied to individual nerves. For example, strains applied dynamically to the optic nerve caused accumulation of neurofilament proteins in axons 3 days post-injury leading to the formation of axonal swellings and retraction bulbs, which are hallmarks of axonal injury produced after TBI (Bain and Meaney, 2000). Significant changes in white-matter integrity were observed at the boundary of the grey–white matter within the sulci but not the gyri relative to controls. Hence, the locations were tau pathology accumulates are both exposed to large strain and strain rate and also show persisting evidence of structural damage. Further work is needed to explore the specificity and sensitivity of this imaging approach in predicting outcome following TBI, but our results suggest that diffusion imaging might be used to assess structural abnormalities at the grey–white matter interface in possible cases of CTE. Advances in the diffusion imaging, including improved spatial resolution, should make it easier to assess the impact of TBI on small white matter tracts and improve the assessment of abnormalities present at the grey-white matter boundary.
We compared computational modelling predictions from a single fall, road traffic accident or sporting injury with neuroimaging results from a mix of different injury mechanisms. This is an informative comparison because CTE-type pathology is seen after injuries of different mechanisms and this is likely to reflect the underlying biomechanical forces produced at the time of injury, rather than distinct features specific to distinct injury mechanisms. CTE has most commonly been described in relation to repeated mild TBI, and has often been seen in a sporting context (McKee et al., 2009). However, there is little consensus about the frequency or severity of injuries that are required to produce CTE-type pathology. Smith et al. (2013) highlight that CTE-type pathology can be found years after just a single moderate-to-severe TBI. For example, in one neuropathological study 39 long-term survivors of single TBI were investigated (Johnson et al., 2012). Neurofibrillary tangles were exceptionally rare in the controls of this study, but were abundant and widespread in the around a third of TBI patients being commonly found in the depths of the sulci. This demonstrates that tau pathology is common after single TBI and is not confined to repetitive TBI. In addition, we have recently shown persistent amyloid pathology after a single TBI, which would be in keeping with CTE-type pathology present after single injuries (Scott et al., 2016). Therefore, understanding how the biomechanics of all types of TBI relate to CTE-type pathology is an important goal for TBI research broadly and not only repeated mild TBI.
Future work will be necessary to clarify the links between distinct biomechanical patterns of injury, brain pathology and clinical features of post-traumatic dementia. We have demonstrated that various types of injury can produce high mechanical strains in brain regions that show tau pathology in cases of CTE defined at post-mortem. However, it is currently not possible to define CTE clinically with confidence. Hence, it is unclear whether cognitive impairment in our TBI group is due to post-traumatic neurodegeneration or other factors such as the direct effects of the initial injury. This uncertainty limits our ability to determine whether the type of injuries we have modelled are likely to lead to clinical problems as a result of the neurodegenerative pathology. Relatedly, although the neuropathological literature suggests that a significant proportion of survivors of single TBI will develop tau pathology (Johnson et al., 2012), it is unclear how pathology at these locations relates to clinical features or to the chance of developing overt dementia. Some of these issues are likely to be clarified in the near future by the use of molecular PET imaging of tau and amyloid pathology that will allow the presence and location of neurodegenerative pathology to be defined (Scott et al., 2016).
Our results hold the promise of guiding improvements in protection from head injury, such as the development of novel helmet designs. Currently most TBI mitigation strategies are designed to reduce head translational acceleration. However, it is not clear that this is the optimal strategy for reducing the mechanical forces that lead to neurodegeneration following TBI (King et al., 2003). By using high fidelity computational models of brain injury, we have shown it is possible to map out the brain tissue response to head loading and this information could be used to focus the design of mitigation strategies on reducing the level of maximal strain and strain rate within the brain with particular attention to areas where pathology is observed.
Funding
This work was supported by an Imperial College London Junior Research Fellowship (M.G.) and the Medical Research Council (UK). D.J.S. has a National Institute of Health Research Professorship - RP-011-048. The work was also supported by the Imperial College NIHR Biomedical Research Centre. P.J.H is funded by a Sir Henry Wellcome Postdoctoral Fellowship (Wellcome Trust).
Supplementary material
Supplementary material is available at Brain online.
Supplementary Material
Glossary
Abbreviations
- CTE
chronic traumatic encephalopathy
- DTI
diffusion tensor imaging
- TBI
traumatic brain injury
References
- Aimedieu P, Grebe R. Tensile strength of cranial pia mater: preliminary results. J Neurosurg 2004; 100: 111–14. [DOI] [PubMed] [Google Scholar]
- Bain AC, Meaney DF. Tissue-level thresholds for axonal damage in an experimental model of central nervous system white matter injury. J Biomech Eng 2000; 122: 615–22. [DOI] [PubMed] [Google Scholar]
- Bayly PV, Black EE, Pedersen RC, Leister EP, Genin GM. In vivo imaging of rapid deformation and strain in an animal model of traumatic brain injury. J Biomech 2006; 39: 1086–95. [DOI] [PMC free article] [PubMed] [Google Scholar]
- Behrens T, Woolrich M, Jenkinson M, Johansen-Berg H, Nunes R, Clare S, et al. Characterization and propagation of uncertainty in diffusion-weighted MR imaging. Magn Reson Med 2003; 50: 1077–88. [DOI] [PubMed] [Google Scholar]
- Cater HL, Sundstrom LE, Morrison B. Temporal development of hippocampal cell death is dependent on tissue strain but not strain rate. J Biomech 2006; 39: 2810–18. [DOI] [PubMed] [Google Scholar]
- Cloots R, Van Dommelen J, Nyberg T, Kleiven S, Geers M. Micromechanics of diffuse axonal injury: influence of axonal orientation and anisotropy. Biomech Model Mechanobiol 2011; 10: 413–22. [DOI] [PubMed] [Google Scholar]
- COST327. Motorcycle safety helmets - final report of the action. Belgium: European Communities; 2001. [Google Scholar]
- Donnelly B, Medige J. Shear properties of human brain tissue. J Biomechan Eng 1997; 119: 423–32. [DOI] [PubMed] [Google Scholar]
- Elkin BS, Morrison B III. Region-specific tolerance criteria for the living brain. Stapp Car Crash J 2007; 51: 127–38. [DOI] [PubMed] [Google Scholar]
- Fagerholm ED, Hellyer PJ, Scott G, Leech R, Sharp DJ. Disconnection of network hubs and cognitive impairment after traumatic brain injury. Brain 2015; 138: 1696–709. [DOI] [PMC free article] [PubMed] [Google Scholar]
- Fischl B. FreeSurfer. Neuroimage 2012; 62: 774–81. [DOI] [PMC free article] [PubMed] [Google Scholar]
- Fischl B, Salat DH, van der Kouwe AJ, Makris N, Ségonne F, Quinn BT, et al. Sequence-independent segmentation of magnetic resonance images. Neuroimage 2004a; 23: S69–84. [DOI] [PubMed] [Google Scholar]
- Fischl B, van der Kouwe A, Destrieux C, Halgren E, Segonne F, Salat DH, et al. Automatically parcellating the human cerebral cortex. Cereb Cortex 2004b; 14: 11–22. [DOI] [PubMed] [Google Scholar]
- Franceschini G, Bigoni D, Regitnig P, Holzapfel GA. Brain tissue deforms similarly to filled elastomers and follows consolidation theory. J Mechan Phys Solids 2006; 54: 2592–620. [Google Scholar]
- Gavett BE, Stern RA, McKee AC. Chronic traumatic encephalopathy: a potential late effect of sport-related concussive and subconcussive head trauma. Clin Sports Med 2011; 30: 179–88. [DOI] [PMC free article] [PubMed] [Google Scholar]
- Ghajari M, Galvanetto U, Iannucci L, Willinger R. Influence of the body on the response of the helmeted head during impact. Int J Crashworth 2011; 16: 285–95. [Google Scholar]
- Greve DN, Fischl B. Accurate and robust brain image alignment using boundary-based registration. Neuroimage 2009; 48: 63–72. [DOI] [PMC free article] [PubMed] [Google Scholar]
- Hallquist JO. LS-DYNA keyword user’s manual. California: Livermore Software Technology Corporation, R7.0; 2013. [Google Scholar]
- Hellyer PJ, Leech R, Ham TE, Bonnelle V, Sharp DJ. Individual prediction of white matter injury following traumatic brain injury. Ann Neurol 2013; 73: 489–99. [DOI] [PubMed] [Google Scholar]
- Holzapfel GA. Nonlinear solid mechanics. West Sussex, England: Wiley Chichester; 2000. [Google Scholar]
- Johnson VE, Stewart W, Smith DH. Widespread tau and amyloid-beta pathology many years after a single traumatic brain injury in humans. Brain Pathol 2012; 22: 142–9. [DOI] [PMC free article] [PubMed] [Google Scholar]
- King AI, Yang K, Zhang L, Hardy W. Is head injury caused by linear or angular acceleration? Lisbon: IRCOBI; 2003. p. 1–12. [Google Scholar]
- Kinnunen KM, Greenwood R, Powell JH, Leech R, Hawkins PC, Bonnelle V, et al. White matter damage and cognitive impairment after traumatic brain injury. Brain 2011; 134 (Pt 2): 449–63. [DOI] [PMC free article] [PubMed] [Google Scholar]
- Kleiven S. Evaluation of head injury criteria using a finite element model validated against experiments on localized brain motion, intracerebral acceleration, and intracranial pressure. Int J Crashworth 2006; 11: 65–79. [Google Scholar]
- Kleiven S. Predictors for traumatic brain injuries evaluated through accident reconstructions. Stapp Car Crash J 2007; 51: 81–114. [DOI] [PubMed] [Google Scholar]
- Mac Donald CL, Dikranian K, Bayly P, Holtzman D, Brody D. Diffusion tensor imaging reliably detects experimental traumatic axonal injury and indicates approximate time of injury. J Neurosci 2007; 27: 11869–76. [DOI] [PMC free article] [PubMed] [Google Scholar]
- Maikos JT, Elias RA, Shreiber DI. Mechanical properties of dura mater from the rat brain and spinal cord. J Neurotrauma 2008; 25: 38–51. [DOI] [PubMed] [Google Scholar]
- Malec JF, Brown AW, Leibson CL, Flaada JT, Mandrekar JN, Diehl NN, et al. The mayo classification system for traumatic brain injury severity. J Neurotrauma 2007; 24: 1417–24. [DOI] [PubMed] [Google Scholar]
- Margulies SS, Thibault LE. A proposed tolerance criterion for diffuse axonal injury in man. J Biomech 1992; 25: 917–23. [DOI] [PubMed] [Google Scholar]
- Margulies SS, Thibault LE, Gennarelli TA. Physical model simulations of brain injury in the primate. J Biomech 1990; 23: 823–36. [DOI] [PubMed] [Google Scholar]
- McKee AC, Cantu RC, Nowinski CJ, Hedley-Whyte ET, Gavett BE, Budson AE, et al. Chronic traumatic encephalopathy in athletes: progressive tauopathy following repetitive head injury. J Neuropathol Exp Neurol 2009; 68: 709–35. [DOI] [PMC free article] [PubMed] [Google Scholar]
- McKee AC, Stein TD, Nowinski CJ, Stern RA, Daneshvar DH, Alvarez VE, et al. The spectrum of disease in chronic traumatic encephalopathy. Brain 2013; 136: 43–64. [DOI] [PMC free article] [PubMed] [Google Scholar]
- Meaney DF, Smith DH, Shreiber DI, Bain AC, Miller RT, Ross DT, et al. Biomechanical analysis of experimental diffuse axonal injury. J Neurotrauma 1995; 12: 689–94. [DOI] [PubMed] [Google Scholar]
- Moore DF, Jérusalem A, Nyein M, Noels L, Jaffee MS, Radovitzky RA. Computational biology—modeling of primary blast effects on the central nervous system. Neuroimage 2009; 47: T10–20. [DOI] [PubMed] [Google Scholar]
- Morrison B III Cater HL, Wang CC, Thomas FC. A tissue level tolerance criterion for living brain developed with an in vitro model of traumatic mechanical loading. Stapp Car Crash J 2003; 47: 93–105. [DOI] [PubMed] [Google Scholar]
- Nicolle S, Lounis M, Willinger R, Palierne J. Shear linear behavior of brain tissue over a large frequency range. Biorheology 2004; 42: 209–23. [PubMed] [Google Scholar]
- Ommaya AK, Gennarelli T. Cerebral concussion and traumatic unconsciousness. Brain 1974; 97: 633–54. [DOI] [PubMed] [Google Scholar]
- Post A, Oeur A, Walsh E, Hoshizaki B, Gilchrist MD. A centric/non-centric impact protocol and finite element model methodology for the evaluation of American football helmets to evaluate risk of concussion. Comput Methods Biomech Biomed Engin 2014; 17: 1785–800. [DOI] [PubMed] [Google Scholar]
- Scott G, Ramlackhansingh AF, Edison P, Hellyer P, Cole J, Veronese M, et al. Amyloid pathology and axonal injury after brain trauma. Neurology 2016; 86: 821–8. [DOI] [PMC free article] [PubMed] [Google Scholar]
- Sharp DJ, Ham TE. Investigating white matter injury after mild traumatic brain injury. Curr Opin Neurol 2011; 24: 558–63. [DOI] [PubMed] [Google Scholar]
- Sharp DJ, Scott G, Leech R. Network dysfunction after traumatic brain injury. Nat Rev Neurol 2014; 10: 156–66. [DOI] [PubMed] [Google Scholar]
- Shreiber DI, Bain AC, Meaney DF. In vivo thresholds for mechanical injury to the blood-brain barrier. Stapp Car Crash J 1997; 41: 277–91. [Google Scholar]
- Shreiber DI, Smith DH, Meaney DF. Immediate in vivo response of the cortex and the blood–brain barrier following dynamic cortical deformation in the rat. Neurosci Lett 1999; 259: 5–8. [DOI] [PubMed] [Google Scholar]
- Singh A, Lu Y, Chen C, Kallakuri S, Cavanaugh JM. A new model of traumatic axonal injury to determine the effects of strain and displacement rates. Stapp Car Crash J 2006; 50: 601–23. [DOI] [PubMed] [Google Scholar]
- Smith DH, Johnson VE, Stewart W. Chronic neuropathologies of single and repetitive TBI: substrates of dementia?. Nat Rev Neurol 2013; 9: 211–21. [DOI] [PMC free article] [PubMed] [Google Scholar]
- Smith DH, Wolf JA, Lusardi TA, Lee VMY, Meaney DF. High tolerance and delayed elastic response of cultured axons to dynamic stretch injury. J Neurosci 1999; 19: 4263–9. [DOI] [PMC free article] [PubMed] [Google Scholar]
- Smith SM, Jenkinson M, Johansen-Berg H, Rueckert D, Nichols TE, Mackay CE, et al. Tract-based spatial statistics: voxelwise analysis of multi-subject diffusion data. Neuroimage 2006; 31: 1487–505. [DOI] [PubMed] [Google Scholar]
- Smith SM, Jenkinson M, Woolrich MW, Beckmann CF, Behrens TE, Johansen-Berg H, et al. Advances in functional and structural MR image analysis and implementation as FSL. Neuroimage 2004; 23: S208–19. [DOI] [PubMed] [Google Scholar]
- Tang-Schomer MD, Patel AR, Baas PW, Smith DH. Mechanical breaking of microtubules in axons during dynamic stretch injury underlies delayed elasticity, microtubule disassembly, and axon degeneration. FASEB J 2010; 24: 1401–10. [DOI] [PMC free article] [PubMed] [Google Scholar]
- Viano DC, Ira RC, Elliot JP. Concussion in professional football: biomechanics of the struck player—part 14. Neurosurgery 2007; 61: 313–28. [DOI] [PubMed] [Google Scholar]
- Willinger R, Baumgartner D. Human head tolerance limits to specific injury mechanisms. Int J Crashworth 2003; 8: 605–17. [Google Scholar]
- Zhang L, Yang KH, King AI. Comparison of brain responses between frontal and lateral impacts by finite element modeling. J Neurotrauma 2001; 18: 21–30. [DOI] [PubMed] [Google Scholar]
Associated Data
This section collects any data citations, data availability statements, or supplementary materials included in this article.


