

At best only 30–40% of patients with major depressive disorder experience remission with any given treatment. Crane et al. evaluate neural network and behavioural performance predictors of treatment response, and report that individuals with poorer and less efficient cognitive control benefit more from treatment with antidepressants.
Keywords: duloxetine, escitalopram, functional MRI, independent components analysis, major depressive disorder
Abstract
Predicting treatment response for major depressive disorder can provide a tremendous benefit for our overstretched health care system by reducing number of treatments and time to remission, thereby decreasing morbidity. The present study used neural and performance predictors during a cognitive control task to predict treatment response (% change in Hamilton Depression Rating Scale pre- to post-treatment). Forty-nine individuals diagnosed with major depressive disorder were enrolled with intent to treat in the open-label study; 36 completed treatment, had useable data, and were included in most data analyses. Participants included in the data analysis sample received treatment with escitalopram (n = 22) or duloxetine (n = 14) for 10 weeks. Functional MRI and performance during a Parametric Go/No-go test were used to predict per cent reduction in Hamilton Depression Rating Scale scores after treatment. Haemodynamic response function-based contrasts and task-related independent components analysis (subset of sample: n = 29) were predictors. Independent components analysis component beta weights and haemodynamic response function modelling activation during Commission errors in the rostral and dorsal anterior cingulate, mid-cingulate, dorsomedial prefrontal cortex, and lateral orbital frontal cortex predicted treatment response. In addition, more commission errors on the task predicted better treatment response. Together in a regression model, independent component analysis, haemodynamic response function-modelled, and performance measures predicted treatment response with 90% accuracy (compared to 74% accuracy with clinical features alone), with 84% accuracy in 5-fold, leave-one-out cross-validation. Convergence between performance markers and functional magnetic resonance imaging, including novel independent component analysis techniques, achieved high accuracy in prediction of treatment response for major depressive disorder. The strong link to a task paradigm provided by use of independent component analysis is a potential breakthrough that can inform ways in which prediction models can be integrated for use in clinical and experimental medicine studies.
Introduction
Numerous treatment studies suggest that at best only 30–40% of individuals with major depressive disorder (MDD) will experience remission with any given treatment (Trivedi et al., 2006; Gaynes et al., 2009; Holtzheimer and Mayberg, 2011). On average, it takes up to 8–12 weeks to evaluate the effectiveness of a given treatment for a given person (Trivedi et al., 2006). Furthermore, the additive costs of untreated and ineffectively treated depression are estimated at a half a billion dollars per year (Greenberg et al., 2003). Therefore, predicting treatment response has the potential to provide a tremendous benefit for our overstretched health care system by reducing the number of treatments used, the time to remission and decreasing many educational, occupational and interpersonal difficulties, including unemployment, worsening of other medical conditions, and suicide (Kessler et al., 2006; Dunlop et al., 2011).
Convergent reports of neuroimaging markers as prospective, predictive markers in treatment response may help us to understand the mechanisms of treatment response in depression (McGrath et al., 2013; Dunlop et al., 2015; Schmaal et al., 2015). A recent review suggested that rostral cingulate cortex hyperactivity in response to cognitive and emotional challenges as well as during baseline metabolic measurements, is a positive prospective marker of treatment response (Pizzagalli, 2011). There are overlapping regions within the rostral cingulate cortex reported for cognitive and affective conditions (Bush et al., 2000), and more recently within broader default mode network (Buckner et al., 2008). However, hyperactive amygdala and hypoactive subgenual cingulate responses to threat are inconsistent predictors of treatment response (Davidson et al., 2002; Drevets, 2003; Mayberg, 2003; Fu et al., 2004, 2013; Victor et al., 2010). Notably, amygdala response to threat appears to decrease with treatment (Harmer et al., 2006; Arce et al., 2008; Godlewska et al., 2012; Ruhe et al., 2012) and it is not clear if it is a reliable predictor of treatment response (Williams et al., 2015).
Notably, despite a number of studies with significance in prediction, models have not yet emerged that might show promise for use at the individual patient level. The threshold for clinical significance, or patient level prediction, requires a degree of specificity and significance that is well above the typical P < 0.05, even irrespective of corrections for multiple comparisons: It requires the ability to be correct, in classification, a preponderance of the time, rather than substantially better than chance. For example, prospective clinical prediction in a validation sample could then illustrate how a subject level marker could predict response/non-response with a high degree of accuracy for a given patient (Collins et al., 2015). Using existing clinical tools, cognitive performance, and neuroimaging independently, this level of prediction accuracy has yet to be attained (Bagby et al., 2002; Nierenberg, 2003; Siegle et al., 2012; Fu and Costafreda, 2013; Gyurak et al., 2015). One recent study demonstrated a method for how such a predictive algorithm might be evaluated (Williams et al., 2015). In this study with the iSPOT-D sample, 80 individuals with MDD completed treatment and pretreatment functional MRI. Pretreatment hypoactivation to happy and threat faces contributed to prediction accuracy of 75%, and more specifically, hypoactivation to sad subliminal faces was correct at prediction with 81% accuracy, including cross-validation. These levels of prediction accuracy are approaching levels that might be efficient at an individual patient level, meeting the much more stringent criteria for clinical significance and demonstrated internal reliability with cross-validation.
There remain several challenges to finding ways to capitalize upon these initial reports of prospective treatment prediction modelling with functional MRI, neuropsychological, and clinical data. A principal challenge is the technology required to provide functional MRI tools to multiple and diverse health care locations. Test-retest reliability of subtraction-based functional MRI measurements poses another challenge (Bennett and Miller, 2010). Reliability of subtraction-based measurements is historically poor, as error in each individual measurement can be exponentially increased when a subtraction is used (Stevens, 1996). Additional challenges are related to building effective modelling strategies given the limited nature of the sample characteristics typical of functional MRI treatment studies, in which subjects tend to be younger, free of comorbidities in medical and related disorders (e.g. substance use disorders, diabetes, obesity), and also free of current treatment (Phillips et al., 2015). Together, these have resulted in far higher rates of response and remission in treatment studies with neuroimaging probes. Furthermore, even the most promising functional MRI predictors have worked at the group level, not yet at the individual level. Prediction tools that can be exported out of the scanner and used in standard clinical settings are the long-term goal, but for now these tests and questionnaires have significant but markedly reduced predictive capacity (Dunkin et al., 2000; Taylor et al., 2006; Bruder et al., 2007, 2014). First, prediction tools can be enhanced to the level of more accurate prediction, and second they can be reduced and refined so that they can be integrated in standard clinical settings, perhaps with neuropsychological tests and in conjunction with clinical measures. For example, several studies demonstrate that executive functioning measures, including attention, processing speed, and cognitive control components tend to be significant predictors of treatment response, at least at the group level (Dunkin et al., 2000; Kampf-Sherf et al., 2004; Taylor et al., 2006; Bruder et al., 2007, 2014).
The present study was designed to employ several strategies to aid in treatment prediction modelling with MDD participants in an open-label treatment trial. This study is considered a developmental model with validation using resampling, per established guidelines (Collins et al., 2015). First, we focused on network predictors of treatment response. To do so, we used independent component analysis (ICA) of functional MRI data during a PARAMETRIC Go/No-go (PGNG) test to evaluate patterns of neural activation related to cognitive control (Cole and Schneider, 2007; Ryan et al., 2015) that are directly linked to behavioural performance, to identify temporal and spatially sensitive networks and properties that might be significant treatment markers. We used the PGNG task because executive functioning performance markers are a well-replicated predictor of treatment response (Dunkin et al., 2000; Gorlyn et al., 2008; Langenecker et al., 2009; Gudayol-Ferre et al., 2013; Jenkins et al., 2016). We also included traditional performance metrics for cognitive control and traditional haemodynamic response function (HRF) modelling of activation for hits to Targets, correct Rejections and Commissions errors to compare how these measures are similar or different from ICA component estimates in prediction of treatment response. Notably, we also integrated these tools to enhance predictive capacity, to evaluate whether they might surpass standards for prediction of treatment response that could be used in clinical trials (e.g. >80% accuracy, cross validation accuracy).
Materials and methods
Participants
Forty-nine participants with diagnosis of MDD were recruited. Details of those lost during the course of treatment and for data integrity purposes are listed below, with 29 individuals included in the final ICA predictive model [37 individuals with initial scans were used in cross validation (Steyerberg and Vergouwe, 2014)] and 36 in PGNG performance and HRF models (Table 1 and Supplementary Fig. 2). Prior to enrolment in the study, MDD participants had been medication-free for at least 90 days from any selective serotonin (SSRIs) or serotonin–norepinephrine reuptake inhibitors (SNRIs) and for at least 30 days from all other medications (including birth control). Individuals who smoked cigarettes, met criteria for alcohol abuse, or reported use of illegal drugs in the past 2 years were excluded. Informed consent was obtained according to the guidelines of the Institutional Review Boards of the University of Michigan and consistent with the Declaration of Helsinki. Participants were compensated for their participation.
Table 1.
Participant characteristics
| Intent to treat | Completed treatment | Functional MRI completera | ICA modelled | |
|---|---|---|---|---|
| n = 49 | n = 38 (77.5%) | n = 36 (73%)b | n = 29 (59.2%) | |
| Age | 36.94 (12.16) | 36.39 (11.80) | 35.89 (11.71) | 34.52 (11.15) |
| Sex (M/F) | 16/33 | 14/24 | 14/22 | 12/17 |
| Education | 15.16 (2.18) | 15.18 (2.15) | 15.14 (2.15) | 15.17 (2.04) |
| Shipley | 106.57 (10.71) | 105.86 (11.43) | 105.71 (11.56) | 105.34 (12.34) |
| Pre-treatment HDRS | 19.43 (4.21) | 19.61 (3.96) | 19.22 (3.46) | 19.48 (3.71) |
| Post-treatment HDRS | 7.68 (6.48) | 7.50 (6.85) | 7.43 (6.93) | 7.21 (7.39) |
| Treatment Response (HDRS % change) | 64.55 (25.47) | 65.00 (25.62) | 65.94 (25.99) | 68.66 (25.31) |
| Medications (escitalopram/duloxetine) | 30/19 | 23/15 | 22/14 | 16/13 |
| Weeks of treatment | 10.96 (2.07) | 11.24 (1.68) | 11.28 (1.68) | 11.28 (1.67) |
| % with comorbid anxiety disorder | 65% | 65% | 61% | 63% |
| Number of prior depressive episodes | 8.28 (17.06) | 9.72 (20.01) | 9.74 (20.10) | 10.12 (20.56) |
| % Antidepressant medication naïve (%) | 54% | 50% | 53% | 48% |
| Commission errors, n | 19.9 (11.5) | 18.1 (11.2) | 21.7 (10.5) | 20 (10.5) |
| Rejection events, n | 40.0 (12.8) | 41.8 (13.2) | 40.6 (11.6) | 41.8 (12.0) |
Values are means and standard deviations unless otherwise noted.
Sixteen participants were included in Langenecker et al., 2007 (32); no significant group differences.
Modelled for HRF and performance analyses.
Procedures
Clinical assessment was conducted using the structured clinical interview for DSM-IV (First et al., 2002). Treatment was provided by a board-certified psychiatrist (B.J.M. or J.K.Z.). MDD participants underwent functional MRI and completed several measures including the Hamilton Depression Rating Scale (HDRS; Hamilton, 1960) prior to receiving open-label treatment with escitalopram or duloxetine for 10 weeks. HDRS measurements took place every 1–2 weeks throughout treatment and on completion of treatment.
Forty individuals with MDD received treatment for at least 1 week; nine participants declined treatment or were lost to follow-up. Thirty-eight MDD participants completed at least 7 weeks of treatment (77%) and were considered to have completed treatment, but two did not complete functional MRI at baseline and therefore are not included in this study (Table 1). Therefore, of the 36 MDD who completed treatment and had functional MRI (functional MRI completers), a subset of 29 (59% of intent to treat sample and 76% of those completing treatment; Supplementary Fig. 2) whose scans were compatible with the ICA software requirements (ICA modelled, described below), were included in the analyses.
Participants treated with escitalopram (n = 22, 2004–07) were given 5 mg during Week 1 and then 10 mg up to Week 4 and could increase to 20 mg thereafter if <50% response was achieved. Participants treated with duloxetine (n = 14, 2009–12) were given placebo for the first week, 30 mg during Weeks 2–3 and then 60 mg during Weeks 4–6. If participants’ symptoms had not improved by at least 50%, their duloxetine dose was titrated up to 90 mg during Weeks 7–8 and if symptoms had still not improved by at least 50%, the dose was titrated up to 90–120 mg during Weeks 7–10, as tolerated.
Measures
The PGNG (Langenecker et al., 2005, 2007; Votruba and Langenecker, 2013) (Supplementary Fig. 1) is a 24-min task completed during functional MRI that measures attention (Targets) and set-shifting, processing speed, and correct (Rejections) and incorrect (Commissions) responses to lure trials as measures of inhibitory control. The PGNG task consists of three separate levels, which were completed in a semi-counterbalanced order of six runs, accounting for the easiest level to build prepotency [and to counterbalance the moderate and difficult inhibitory control levels (e.g. Levels 123132 or 132123; Supplementary Fig. 1)]. Level 1 (the 3-Target ‘Go’ condition; two runs) is designed to build and sustain prepotent responding to the set of target letters (‘x’, ‘y’, and ‘z’). It does not have a ‘no-go’ instruction set (which is needed to generate rejections and commissions). In Level 2, (the 2-Target Go/No-go condition; two runs) participants are required to respond to the target letters (‘x’ and ‘y’ only, ‘z’ is absent in this level) each time they appear, in alternation or non-repeating order. This ‘non-repeating rule’ stipulates that once the participant responds to the target ‘x’, the target set is ‘y’ and the lure set is ‘x.’ After they respond to a ‘y’, then the set is shifted—the target set is ‘x’ and the lure set is ‘y’. Level 3 (two runs) is similar to Level 2, but consists of three Targets (‘z’ is included), switching between two targets and one lure set. Scores were computed for the average correct hits for Go items (Targets) across all three levels of the task, average Rejections of No-go items across the two more difficult levels of the task, and Go Response Time across all three levels of the task. For more information see reliability and normative data (Langenecker et al., 2007; Votruba and Langenecker, 2013).
Data acquisition
Whole brain imaging was performed with a 3.0 T GE Signa scanner using a standard radio frequency coil and T2*-weighted pulse sequence. Blood oxygen level-dependent (BOLD) functional images were collected using a gradient-echo axial forward-reverse spiral sequence at University of Michigan between 2003 and 2013 (Glover and Thomason, 2004). The following parameters were used: repetition time = 2000 ms, echo time = 30 ms, flip angle = 90°, field of view = 22 cm, 64 × 64 matrix, slice thickness = 4 mm, 29 slices. An axial T1-weighted structural image was obtained for each participant using 108–124 axial images between 1–1.5 mm in thickness for spatial normalization. There were six runs of the PGNG, each lasting 4 min 20 s (120 volumes per run), and the entire scan lasted ∼25–28 min. The PGNG task was run in EPrime on a PC in the scanning room that was rear projected onto prism glass in the magnet for the participant. The task was synced to the scanner—the EPrime start initiated the functional MRI scan. Participants responded to the task using a five-button response ‘claw’.
MRI processing
Preprocessing of functional MRI data was conducted using SPM8 (http://www.fil.ion.ucl.ac.uk/spm/) and AFNI (http://afni.nimh.nih.gov/afni/). Data were despiked using AFNI. All data were then slice-time corrected in SPM8 and realigned in FSL (http://fsl.fmrib.ox.ac.uk/fsl/fslwiki/) using MCFLIRT (Jenkinson et al., 2002). Anatomical and functional images were co-registered and normalized to the T1-weighted structural image in Montreal Neurological Institute (MNI) space using SPM8. Isotropic smoothing was completed with a full-width at half-maximum filter of 5 mm3. First-level, event-related models were built in SPM8 covarying pitch (x), roll (y) and yaw (z) translation realignment movement regressors from FSL MCFLIRT.
Statistical procedures
Demographic and HRDS measures were compared between all groups (intent to treat n = 49, completed treatment n = 38, functional MRI completer n = 36, and ICA modelled n = 29) using t-tests or chi-square tests as appropriate in SPSS 20.0 (IBM).
The Group ICA fMRI Toolbox (GIFT), version 2.0a (Supplementary Fig. 2). We chose three runs as this enabled us to capture a broader range of performance capabilities [range of 4–35 Commissions, mean = 16.4, standard deviation (SD) = 8.2 and correct Rejections ranging from 14–44, mean = 29.8, SD = 9.1], a larger sample, while still maintaining sufficient power to detect event-specific neural activation in the ICA modelling and obtaining an even distribution of Commissions and Rejections across runs. For individuals who had all events in all four of the moderate and difficult runs, we chose to discard the run either (i) with very few (e.g. less than five or so Commissions or Rejections); or (ii) if all runs had a sufficient number of all events, than we discarded a run in a counter-balanced manner in order to ensure that across participants, the runs that were included in the ICA were drawn equally from all four possible runs.
ICA data analyses followed established procedures for functional MRI data (Calhoun et al., 2001). Using a modified minimum description length algorithm, 25 components were identified that optimally split the functional MRI datasets into a final set of spatially independent components, based on methods used and described in prior studies (Calhoun et al., 2001; Kim et al., 2009). In GIFT a regression was performed on the ICA component time courses with the general linear model (GLM) design matrix taken from SPM8, which represents a combination of the experimental onsets and the corresponding canonical HRF. This regression produced beta weights for each experimental regressor [Targets, Commissions (as a measure of emotion or corrective response to error) and Rejections (as an index of regulatory capacity/skill)] associated with a particular participant and component. These beta weights represent the degree to which the component is related to specific aspects of the experiment (e.g. Targets, Commissions, and Rejections), therefore a high, positive beta weight represents a large task-related modulation of a component for a specific regressor (Kim et al., 2009).
We then selected the components most closely and positively linked to each of the three key performance markers (Supplementary Table 1). More than five reached statistical significance (P-value < 0.05) in positive links with some performance markers (Commissions = 8/25, Rejections = 5/25, Targets = 6/25), but only seven Commission-related components, four Rejection-related components, and five Target-related components remained significant after False Discovery Rate (FDR) correction (Supplementary Table 1). We used SPSS to conduct multiple regression analyses with beta weights from each event (Targets, Commissions, Rejections) as separate independent variables, and medication, age, and gender as covariates, and treatment response (% HDRS change pre- to post-treatment) as the dependent variable in each model.
We created ‘within component’ masks from the two components that were significantly related to treatment response (Components 24 and 25) and used these masks (inclusive) in HRF-based second level models to evaluate for specific within-component regions that were most predictive of treatment response at the voxel-by-voxel level in order to compare HRF and ICA models in the same spatial regions. Results were deemed significant at P < 0.01, k = 23 using AlphaSim correction for multiple comparisons. Functional MRI event-related HRF activation after Rejections and Commissions were then used to predict treatment response (HDRS score change pre- to post-treatment) with the random effects simple regression procedure in SPM8. Logistic regression in SPSS was used to predict remission/not using standard criteria of post-treatment HDRS < 8 (dependent variable) with Components 24 and 25 Commission-related beta weights, HRF-modelled clusters within Components 24 and 25 masks, and no-go accuracy (per cent correct Rejections/inhibition; PCI) on the PGNG task as independent variables and initial HDRS score, education level, and pretreatment prediction accuracy as covariates.
Emerging strategies for demonstrating spatial extent reliability of results include leaving one observation out as sequential series of repetitions of the same analysis, then correcting for the number of cross validations performed (e.g. leave-one-out cross-validation). An analogous strategy is to perform repetitions of the same statistical procedure after removing subsets of individuals (Efron, 1986), here bins, in five or 10 cross-validations. When samples are very small, single participant removal may be the only choice. With more robust sample sizes, there is no need to repeat the cross-validation procedure, instead, subsets of participants can be removed, such that any given subset of 10% (in 10-fold) or 20% (in 5-fold) of individuals removed should render a highly similar result if the results are in fact internally reliable and not driven by a handful of outliers. Leave-one-out cross-validation was conducted with GIFT to determine the stability of the ICA components, including 37 individuals (selected as noted above for n = 29), plus eight individuals with MDD who had functional MRI data that met all the same conditions (and had non-significant differences in number of Commission errors and correct Rejections, P-values > 0.10), but who did not complete treatment (from the n = 49 intent to treat sample; Table 1 and Supplementary Fig. 2).
Results
Primary analyses
Components related to cognitive control task performance
First, we evaluated whether components related to the PGNG task were predictive of treatment response (seven Commission-related components, four Rejection-related components, and five Target-related components) from a one-sample t-test calculated in GIFT remained significant after FDR correction (Supplementary Table 1). A total of 25 positive components were related to any of these task conditions. This is data reduction of 360 repetition times, 29 participants, three conditions, and 880 000 voxels to 25 components (reduction of 1.10 × 10⁹). We evaluated if they were in non-grey matter regions or if they appeared to be related to movement. One component selected based on T-scores (Component 1 for Targets) met these criteria and was pulled out due to the fact that there was complete inclusion of the ventricular system, as well as some ringing around the superior aspect of the cortex (Supplementary Fig. 3). It was included as a null hypothesis component, in line with a double dissociation. All of these components and the primary nodes within them are listed in Table 2 and depicted in Supplementary Figs 3–5.
Table 2.
Predicting treatment response with components from ICA using linear regression (n = 29)
| Variable | |||||||||||||||
|---|---|---|---|---|---|---|---|---|---|---|---|---|---|---|---|
| Targets | |||||||||||||||
| Component 1b | Component 8 | Component 16 | Component 17 | Component 22 | |||||||||||
| R2 | Β | P | R2 | Β | P | R2 | B | P | R2 | B | P | R2 | B | P | |
| Full ICA sample | |||||||||||||||
| Event related to component | 0.09 | −00.19 | 0.38 | 0.06 | −0.05 | 0.81 | 0.06 | 0.03 | 0.90 | 0.16 | −0.32 | 0.09 | 0.10 | −0.20 | 0.30 |
| Medication | 0.34 | 0.12 | 0.25 | 0.21 | 0.26 | 0.20 | 0.28 | 0.14 | 0.31 | 0.12 | |||||
| Age | 0.24a | 0.30 | 0.29a | 0.21 | 0.28a | 0.23 | 0.28a | 0.19 | 0.33a | 0.13 | |||||
| Gender | 0.10a | 0.61 | 0.06a | 0.76 | 0.08a | 0.70 | 0.02a | 0.90 | 0.12a | 0.51 | |||||
| Participants treated with duloxetine | |||||||||||||||
| Event related to component | 0.04 | −0.20 | 0.52 | 0.02 | 0.13 | 0.68 | 0.01 | 0.12 | 0.71 | 0.10 | −0.32 | 0.29 | 0.01 | −0.07 | 0.82 |
| Participants treated with escitalopram | |||||||||||||||
| Event related to component | 0.02 | −0.15 | 0.59 | 0.04 | −0.20 | 0.47 | 0.01 | −0.07 | 0.79 | 0.11 | −0.33 | 0.21 | 0.12 | −0.34 | 0.20 |
| Commissions | |||||||||||||||
|---|---|---|---|---|---|---|---|---|---|---|---|---|---|---|---|
| Component 11 | Component 15 | Component 17 | Component 24 | Component 25 | |||||||||||
| R2 | Β | P | R2 | Β | P | R2 | Β | P | R2 | Β | P | R2 | Β | P | |
| Full ICA sample | |||||||||||||||
| Event related to component | 0.10 | −0.19 | 0.36 | 0.07 | −0.05 | 0.80 | 0.08 | −0.13 | 0.50 | 0.29 | −0.49 | 0.008 | 0.43 | −0.65 | <0.001 |
| Medication | 0.32 | 0.12 | 0.25 | 0.19 | 0.28 | 0.16 | 0.35 | 0.048 | 0.48 | 0.006 | |||||
| Age | 0.24a | 0.27 | 0.26a | 0.25 | 0.28a | 0.21 | 0.19a | 0.34 | 0.12a | 0.52 | |||||
| Gender | 0.08a | 0.67 | 0.09a | 0.65 | 0.14a | 0.49 | 0.02a | 0.93 | 0.04a | 0.80 | |||||
| Participants treated with duloxetine | |||||||||||||||
| Event related to component | 0.01 | −0.09 | 0.77 | 0.02 | 0.14 | 0.65 | 0.03 | −0.19 | 0.54 | 0.15 | −0.38 | 0.20 | 0.29 | −0.54 | 0.06 |
| Participants treated with escitalopram | |||||||||||||||
| Event related to component | 0.06 | −0.25 | 0.35 | 0.02 | −0.15 | 0.58 | 0.01 | −0.08 | 0.76 | 0.32 | −0.56 | 0.02 | 0.48 | −0.69 | 0.003 |
| Rejections | ||||||||||||
|---|---|---|---|---|---|---|---|---|---|---|---|---|
| Component 11 | Component 16 | Component 17 | Component 25 | |||||||||
| R2 | Β | P | R2 | Β | P | R2 | Β | P | R2 | Β | P | |
| Full ICA sample | ||||||||||||
| Event related to component | 0.07 | −0.08 | 0.66 | 0.10 | 0.20 | 0.31 | 0.07 | −0.02 | 0.94 | 0.11 | −0.33 | 0.08 |
| Medication | 0.25 | 0.21 | 0.31 | 0.13 | 0.25 | 0.21 | 0.34a | 0.12 | ||||
| Age | 0.27a | 0.25 | 0.28a | 0.19 | 0.27a | 0.22 | 0.19a | 0.39 | ||||
| Gender | 0.08a | 0.67 | 0.07a | 0.73 | 0.11a | 0.60 | 0.07a | 0.71 | ||||
| Participants treated with duloxetine | ||||||||||||
| Event related to component | 0.01 | 0.09 | 0.78 | 0.11 | 0.34 | 0.26 | 0.08 | 0.28 | 0.35 | 0.00 | −0.04 | 0.90 |
| Participants treated with escitalopram | ||||||||||||
| Event related to component | 0.03 | −0.18 | 0.50 | 0.00 | 0.04 | 0.90 | 0.13 | −0.36 | 0.18 | 0.43 | −0.66 | 0.006 |
Variable removed from final reduced model.
Null hypothesis predictor component. Models were not corrected for multiple comparisons, but FDR corrected P-values were computed for Commission events: P-value = 0.02). Italicized P-values are significant or trending toward significance at P=0.05.
Targets
Component 8 included the supplementary motor area (SMA), premotor and primary motor cortices, and dorsolateral prefrontal cortex (DLPFC) with left lateralization; Component 16 included the anterior cingulate cortex (ACC), and bilateral DLPFC and inferior parietal lobule (IPL); Component 17 included the ACC, orbitofrontal cortex, insula, amygdala, and precuneus; and Component 22 included the ventrolateral prefrontal cortex, caudate nucleus, temporal pole, hypothalamus, areas of the thalamus, and the amygdala (Supplementary Fig. 3). Component 1 was used as a null hypothesis predictor component and is described above. Two additional components (22 and 13, reported in Supplementary Table 1) were also positively related to task and are displayed in Supplementary Fig. 3 and prediction results are described in the Supplementary material.
Commissions
Component 11 included the DLPFC, dorsal pre-motor cortex, dorsomedial PFC, insula, inferior frontal junction, and IPL with right prominence; while Component 15 was similar to Component 11, but had left prominence (Supplementary Fig. 4). Component 17 is described above and Component 24 included the dorsal ACC and mid-cingulate. Component 25 included the rostral dorsal ACC, medial prefrontal cortex (PFC) extending into rostral-lateral PFC, and frontal pole.
Rejections
These are Components 11, 16, 17, and 25, which are all described above and in Supplementary Fig. 5.
Evaluation of treatment prediction of independent components beta weights
ICA beta weights reflective of the individual participant corresponding to a specific condition within the PGNG imaging task and component within the ICA (inclusive) were extracted and entered into SPSS for multiple regression models for the 29 individuals who were included in the primary ICA. These models included the beta weight components, medication type, age, sex, and the interaction between component beta weights and medication group as predictors. Two event-related component beta weights were significant predictors of treatment response during commission errors, Components 24 and 25, and survived FDR correction (Table 2 and Fig. 1). Of note, although there were no main effects of sex in these models, we performed exploratory analyses examining sex differences in how Components 24 and 25 are related to treatment response, which are reported in the Supplementary material. Five-fold leave-one-out cross-validation was computed with the ICA GIFT-modelled Components 24 and 25.
Figure 1.

Illustration of the spatial extent of the key components involved in cognitive and inhibitory control. Components 24 and 25 were significantly related to commission errors on the PGNG task and also related to treatment response to escitalpram and duloxetine. Component 11 is composed of areas related to cognitive control, e.g. right lateralized DLPFC, IPL, and dorsal ACC.
Eight non-treatment completers with MDD were added to the ICA sample of 29 for component cross-validation (Supplementary Fig. 2). Seven to eight individuals were randomly removed in each cross-validation, without replacement, in a binned fashion such that each responder, non-responder, and non-completer had an equal probability of being removed from a given cross-fold. Here we ran 5-fold cross-validation to demonstrate that there is reliable spatial extent of Components 24 and 25, both predictive of treatment response. We also report convergence of beta weight statistics across all 5-folds in relation to the initial ICA results for internal reliability. Figure 2A shows excellent spatial reliability of Component 24 across folds; Fig. 2B shows similar results for the 5-fold leave-one-out cross-validation for Component 25. Table 3 illustrates the high reliability internally of ICA beta weights estimation in relation to the task (here Commission errors). These reliabilities were uniformly high (r-values > 0.60, P-values < 0.05), demonstrating internal reliability of the ICA Components 24 and 25.
Figure 2.

Convergence of Component 24 across folds in the 5-fold leave-one-out cross-validation. (A) Areas of highest convergence in ICA estimated beta weights in relation to commission errors in the initial sample of 29 individuals completing treatment and five cross folds (37 − 7 or 8 randomly selected individuals, without replacement, for cross-validation). The 37 participants include those who did not complete treatment but had sufficient events for three runs to accommodate the ICA modelling in GIFT. (B) Areas of highest convergence in ICA estimated beta weights in relation to commission errors in the initial sample of 29 individuals completing treatment and five cross folds (37 − 7 or 8 randomly selected individuals, without replacement, for cross-validation). The 37 participants include those who did not complete treatment but had sufficient events for three runs to accommodate the ICA modelling in GIFT.
Table 3.
Within component and whole brain convergence in component weights
| Original ICA 24 | Original ICA 25 | |
|---|---|---|
| Cross-fold | r component/ r WB | r component/ r WB |
| Bin 1 | 0.96/0.80 | 0.94/0.69 |
| Bin 2 | 0.95/0.61 | 0.61/0.45 |
| Bin 3 | 0.97/0.85 | 0.78/0.60 |
| Bin 4 | 0.96/0.77 | 0.81/0.59 |
| Bin 5 | 0.78/0.44 | 0.82/0.59 |
Correlations, at a voxel by voxel level, of the component beta weights (in relation to commissions) for the original sample ICA with a given cross-fold component. Correlations are reported for voxels within the component, demonstrating moderate to high convergence across folds, as well as for the whole brain (WB), demonstrating moderate convergences.
Evaluation of relationships among Component 24 and 25 beta weights and clinical symptoms
We further investigated Components 24 and 25 to determine their association with pretreatment clinical symptoms. During Commissions, more coherence in the temporal pattern of activation in Component 25 was significantly associated with more symptoms of depression at pretreatment r(27) = 0.40, P = 0.03, but was not related to number of episodes, age, or age of first depressive episode. The temporal pattern of activation in Component 24 was not related to any of these clinical variables during commissions.
Evaluation of differential treatment response by medication type
In these exploratory analyses, we evaluated whether different component-based beta weights or component masked HRF-based activation were singular or differential predictors of treatment response based upon SSRI or SNRI use. First we examined whether any of the 13 event-related component beta-weights differentially predicted treatment response based on the medication given to participants. We calculated the difference between duloxetine and escitalopram correlation coefficients for each component that significantly predicted treatment response, had a significant medication effect, or trended toward significance on either of those measures (Supplementary Table 2). Although temporal activation in Components 24 and 25 during Commissions predicted the magnitude of the treatment response with escitalopram or duloxetine (Table 2), the difference between these effects was not significant (Supplementary Table 2, Fishers exact t-test). On the other hand, temporal activation in Component 25 during Rejections seemed to differentially predict treatment response (Table 2), such that a stronger coherence to the temporal activation of Component 25 during Rejections predicted poorer treatment response with escitalopram, but it did not predict treatment response with duloxetine (Fig. 3B), and the difference between these effects trended toward significance (Supplementary Table 2).
Figure 3.
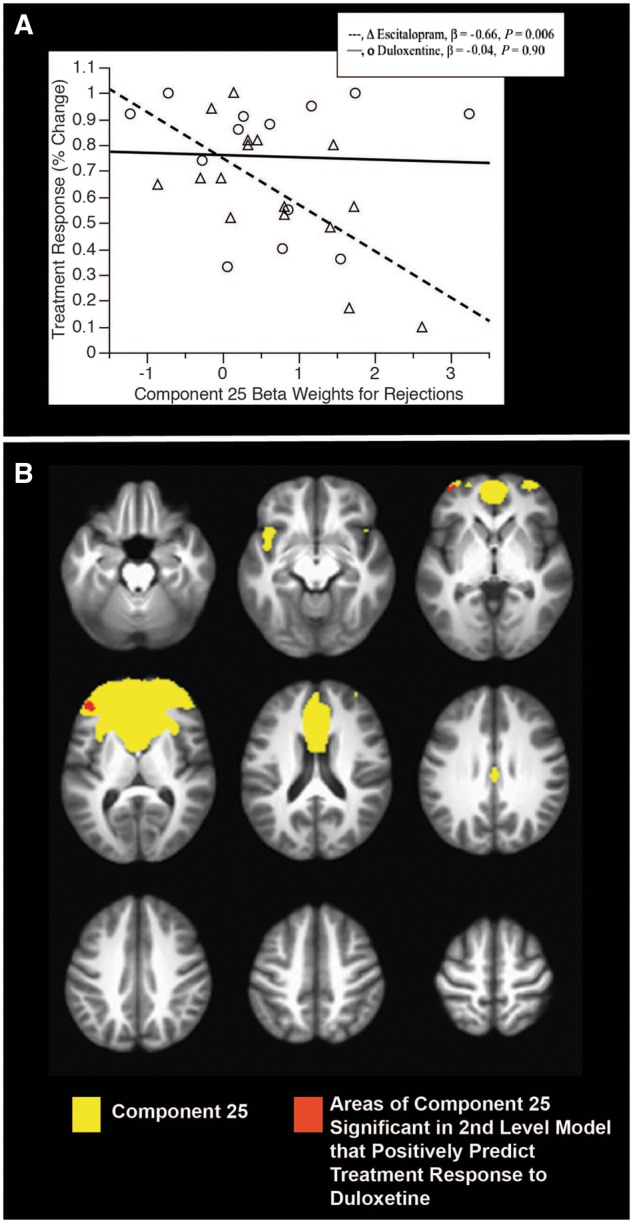
Exploratory analyses of differential prediction of treatment response by duloxetine and escitalopram of Component 25 in ICA modelled individuals during rejections. (A) Relations of treatment change with activation within the ICA (beta weights) for individuals for either escitalopram or duloxetine. (B) The full component (yellow) and the clusters within it that are predictive (red).
Given that there was a difference that trended toward significance between how temporal activation in Component 25 predicted treatment response for duloxetine and we created second level models using SPM in the full sample to examine the HRF-based interaction of treatment response and medication type (interaction effect P = 0.07; Fischers exact t-test of correlations P < 0.001). Figure 3A shows the interaction of HRF-based activation during Rejections in Component 25 and medication in the sample included in the ICA (n = 29). Figure 3B shows regions where the areas of HRF-based activation during Rejections in Component 25 that significantly predicted better response with duloxetine in the full sample (n = 36).
Evaluation of treatment prediction of haemodynamic response function-based beta weights using significant component masks
At a secondary, comparative level, we also directly evaluated within-component HRF-based models. We created second level models using SPM to examine treatment prediction in the full sample (n = 36) using binary, inclusive masks of the two components that predicted treatment response (Components 24 and 25), respectively. Note that these second level contrasts were post hoc, HRF-based GLMs and do not include the temporal ICA beta weights derived from GIFT. The additional six individuals included for HRF analyses tended to have slightly fewer Commission errors (mean = 1.1, SD = 11.2, P = 0.10) and had more correct Rejections (mean = 41, SD = 18.5, P = 0.01), and were included to best represent the sample for generalizability purposes. We also used this method to examine HRF-based treatment prediction of Component 11 during Commissions, as we hypothesized the areas captured in this component are related to cognitive control (bilateral DLPFC and IPL; Garavan et al., 1999) and would be relevant to treatment response (insula; McGrath et al., 2013; see Fig. 1 for overlap components). Results indicated that more HRF-based activation during Commission errors in the right ventrolateral PFC of Component 11 (peak coordinate: x = 42, y = 38, z = −12); in the dorsal ACC of Component 24 (peak coordinate: x = −14, y = −24, z = 32); and in four clusters of Component 25 (peak coordinates: x = −6, y = 12, z = 20; x = −14, y = 46, z = 12; x = 8, y = 14, z = 16; x = 22, y = 18, z = 8), including the rostral dorsal ACC and left medial PFC, all predicted poorer treatment response (Fig. 4).
Figure 4.

Areas of Components 11 (A), 24 (B), and 25 (C) predicting treatment response in second level models during Commissions in functional MRI completers. Results were deemed significant at P < 0.01, k = 23 using AlphaSim correction for multiple comparisons. x-, y-, and z-values represent the peak coordinate of the cluster displayed.
Evaluation of treatment prediction of performance measures
Behavioural variables: (i) response time to go items; (ii) go-accuracy (per cent correct hits for Targets); and (iii) no-go accuracy (PCI) were used to predict treatment response (HDRS change) in individuals that completed treatment. Supplementary Table 3 and Fig. 5A show that overall, poorer PCI predicted better treatment response, while per cent correct hits for Targets and response time did not predict treatment response. Relationships between ICA components and performance measures can be found in the Supplementary material.
Figure 5.

Poorer cognitive control performance (A), ICA 25 (B), and decreased mid cingulate activation (C) predicts better treatment response.
Omnibus model, linear and logistic regression, predictive cross-validation
Of particular interest was whether ICA-based components, HRF-based models, and performance markers each contributed unique or additive variance in treatment response—whether there were convergent or complimentary effects evident. To achieve this objective, Component 24 and 25 Commission-related ICA beta weights, HRF-modelled clusters within Components 24 and 25 masks, and PCI were entered into an omnibus prediction model of treatment response with the 29 ICA-modelled individuals (Table 1 and Supplementary Fig. 2). The final model [F(28) = 9.60, P < 0.0001, adjusted R2 = 0.65] included PCI (B = −0.32, P = 0.01, Fig. 5A), Component 25 ICA beta (B = −0.42, P = 0.001; Fig. 5B), an HRF-modelled cluster from Component 24 (B = −0.44, P = 0.01, coordinates −14, −24, 32; Fig. 5C), education (B = 0.31, P = 0.03), and two HRF-modelled clusters from Component 25 (coordinates −6, 12, 20 and 22, 18, 8, P-values > 0.20).
Using logistic regression, we also examined accuracy in prediction of remission (post-treatment HDRS < 8). With the addition of performance, ICA, and HRF-based predictors, and after accounting for initial HDRS score and education level, pretreatment prediction accuracy improved by 16% from 74% to 90%. Sensitivity (77.3–90.0%) and specificity (71.4–88.9%) also increased markedly with inclusion of functional MRI and performance markers.
A second leave-one-out cross-validation was conducted using the Random Forest Classifier of weka (Supplementary material for more details). Random Forest classification demonstrated that accuracy remained high using leave-one-out cross-validation in the treatment prediction model, with 84% accuracy, and high sensitivity (84.2%) and specificity (80.0%).
Discussion
In this study, we were able to demonstrate for the first time that ICA has several promising features that enable us to specifically define and probe networks of interest that are linked to behavioural performance markers and a clinically meaningful outcome, treatment response in MDD. ICA adds a dimension, time, which has been compressed in most functional MRI research to date. Notably, functional MRI analyses (HRF-based modelling) work to compress time by modelling contrast of interest minus contrast of non-interest, yielding a temporally linked contrast score that does not comprise the temporal signature itself or convergence of temporal signatures across multiple regions (into components). We were also able to evaluate ICA in relation to more traditional performance and HRF-modelled predictors, which together predicted treatment response with 90% accuracy. Notably, component-level beta weights for commissions were significant negative predictors for two commission-related networks at the global level.
Component 24 appeared to be the interference resolution network, including the dorsal ACC and mid-cingulate (Peterson et al., 1999; Langenecker et al., 2004; Mitterschiffthaler et al., 2008). Component 25 included the rostral dorsal ACC, medial PFC, and frontal pole. Component 25 completely contained the rostral ACC, hypothesized to be an important region involved in attention, cognitive control, and treatment response (Pizzagalli, 2011). The task on which ICA is based, the PGNG, is the first behaviour-based predictor that is integrated within this developmental functional MRI predictive model with HRF modelled contrasts, and with ICA modelled beta weights, requiring independent validation (Collins et al., 2015). In addition, the temporal coherence modelled in Component 24 was specifically related to actual performance skill for PCI, a subdomain of cognitive control. This relationship lends confidence to the ICA technique and relevance to an important clinical feature of MDD, above and beyond prediction of treatment response. Furthermore, coherence to the temporal pattern of activation in Component 25 was significantly associated with more symptoms of depression at baseline, another important clinical feature of MDD. This suggests that areas involved in attention and cognitive control (Component 25) may play an important role in depression severity (Mitterschiffthaler et al., 2008; Berman et al., 2011; Dillon et al., 2015) as well as treatment response and executive function (Component 24; Pizzagalli, 2011). The new additive and convergent prediction in this experiment, including high accuracy with cross-validation in prediction and ICA spatial extent and beta weights, presents a potential breakthrough in how treatment prediction modelling might be employed in future studies. The convergence approach can be marshalled for work in diseases other than MDD.
Independent component analysis as a prediction metric in treatment research
A benefit of ICA approaches like the one used here is that the networks are defined in relation to real behaviours that can be measured outside of the functional MRI environment, including in clinical settings. This synchronization allows for stronger parallels that could be drawn between behavioural performance predictors using executive functioning measures (in large multisite trials) to those with neuroimaging prediction measures (in select targeted subgroups). It is a strategy that can be used in other disorders where improvement in prediction is needed. Such strategies can then enable tiered treatment prediction models, so that if prediction is clear using behavioural performance, decision-making can be faster and more efficient. In this context, with the PGNG test, poorer inhibitory control also predicted better treatment response. There are some studies suggesting that specific aspects of executive functioning are negative treatment predictors, in light of the more common finding that those with stronger premorbid skills in this area might be more likely to respond to standard treatments. This conundrum of results is perhaps clarified in that slower processing speed and poorer decision-making are adverse predictors, while more impulsive responding is a positive predictor (Taylor et al., 2006; Bruder et al., 2014).
Independent component analysis as an additive metric to traditional haemodynamic response function modelling
The present results also suggest similarities and differences between ICA markers of treatment response and HRF-dependent regions within these models. Independent components can overlap, suggesting that different subpopulations of neurons within different networks may contribute in unique ways to functioning/outcomes, measured by independent temporal signatures. Of course, it is also possible that traditional HRF modelling overly compresses these signals, limiting the specificity of the measurements. Emerging evidence indicates that there are multiple neural circuits involved in different cognitive, emotional, regulatory, and monitoring processes, and this may be particularly true of the rostral anterior cingulate (Yeo et al., 2011). Each of these circuits may have unique or many unique time courses and task-related modulation even within the same voxels or networks and this may not be detected by GLM-based analysis, in which HRF is averaged across voxels (Beldzik et al., 2013; Xu et al., 2013a, b). Indeed, Xu et al. (2013b) found that several overlapping functional networks had unique task-related modulations of time courses, some of which increased, while others decreased even in the same voxels or regions using ICA. In contrast, GLM-based cancellation analysis with the same data only generated 12–26% of the same brain regions as observed in ICA, supporting the notion that ICA is distinct from and may be more sensitive the HRF-based GLM (Xu et al., 2013b). Furthermore, we demonstrate here for the first time that treatment predictive ICA components have moderate to strong internal reliability, using a 5-fold leave-one-out cross-validation procedure.
Indeed, highlighting the relatively weaker HRF-based activation models, we found smaller subareas of activation that were predictive of treatment response, within these components. Furthermore, even though the beta weights for ICA and the canonical values for HRF are modelled differently, they were in the same direction of prediction. Specifically, more activation during commission errors in the dorsal ACC of Component 24 and in the rostral dorsal ACC and left medial PFC of Component 25 predicted poorer treatment response. In addition, we found that more activation during Commission errors in the right ventrolateral PFC of Component 11 predicted poorer treatment response. This is in contrast to a recent study showing more dorsolateral right PFC engagement was a positive predictor of treatment response in an cognitive control task, although that model did not separate out Rejections and Commission errors (Gyurak et al., 2015). The dACC results also contrast to prior reports that increased resting activation within the cingulate might be predictive of better prospective treatment response (Pizzagalli, 2011); however, that review was largely comprised of resting state or emotion challenge paradigms.
Depressed individuals who make more errors of commissions and are not able to recruit brain areas important for cognitive control during errors of Commissions, including the anterior cingulate cortex (error monitoring), the left ventromedial PFC (decision-making and emotional regulation) and the right ventrolateral PFC (motor inhibition), appear to benefit more from treatment with SSRI/SNRIs. It is possible that medication effects upon serotonin and norepinephrine systems are in areas of the brain important for cognitive control and error monitoring, potentially influencing executive functioning performance and leading to better treatment response (Fales et al., 2009). This may be especially true among individuals who have differential, less efficient processing (Kampf-Sherf et al., 2004; Iverson et al., 2011). It is also possible that there are structural and plasticity constraints on how much change can be elicited in treatment, and that different subpopulations/networks are related to symptom severity and symptom improvement (Butters et al., 2000; Langenecker et al., 2009).
Exploratory differential prediction by selective serotonin/serotonin–norepinephrine reuptake inhibitors
In exploratory analyses, there was a pattern of negative/null predictive components with escitalopram and positive or null predictors with duloxetine for one Rejection component. Given the limitations of the sample selection, which included open label treatment and sequential cohorts of treatment with escitalopram and then duloxetine, these results are intriguing but should not be overinterpreted. One possibility is that the modulation of these brain regions implicated in cognitive control by SSRIs and SNRIs differentially benefits individuals in a treatment predictive manner, something that could be followed up in a blinded, randomized study. Two recent papers exploring the iSPOT-D sample with an emotional (Williams et al., 2015) and a cognitive control task (Gyurak et al., 2015) suggest that differential prediction of medication by task may be possible, at least in theory and with larger sample sizes. External validation modelling and greater distinction in mechanisms of action between different agents might strengthen approaches of this type, as there is substantial overlap in monoamine pathways challenged by SSRIs and SNRIs, and in their treatment efficacy (Papakostas et al., 2007). We also found some evidence of potential sex differences in how Components 24 and 25 were negatively (but not significantly) related to treatment effects in males, but not females (Supplementary material).
Integrative predictive models and steps for validation
There are broader implications of the present work that extend beyond predictive modelling in MDD alone. First, the relative independence of the HRF, ICA, and performance predictors emphasizes how multivariate prediction models, if validated beyond this initial developmental stage, can contribute additive, unique variance in prediction (Steyerberg and Vergouwe, 2014; Collins et al., 2015). This highlights both multivariate prediction and incremental improvement in accuracy. It also highlights the importance of translation potential. Most functional MRI tasks are specifically designed to obtain high levels of accuracy, which is comparable between groups, with the purpose being to define network/region differences that are performance independent. In contrast, our work highlights ways in which this may limit the information that might be gathered. If a performance marker obtained during functional MRI has predictive validity, the valuable information about performance can then be transferred and captured in clinical settings and may be available at a large-scale level (Liebel et al., 2015; Kassel, 2016; Rao et al., 2016; Zilles et al., 2016). Here, if poor performance on a measure such as per cent correct inhibition is predictive of treatment response, and also related to extent and amount of engagement of disease-relevant brain regions/components, then such a task might be used to preselect individuals for future treatment studies embedded within and including functional MRI measures, consistent with the experimental medicine framework (Henson et al., 2000; Strange et al., 2002; Insel, 2012). This method can be used in other diseases in which performance differences related to neural networks is expected and related to clinical outcomes.
Limitations
There are some limitations of the study that are important to review. Even though there were relatively equal numbers of males and females in each medication sample, we were underpowered to evaluate sex differences. Furthermore, there was substantial variability in participant age, which ranged from 18 to 57 years. Age was entered into regression models to diminish the influence in the predictive models, but it could still be relevant for how the components were initially derived. The sample used for ICA was relatively modest (n = 29 for the primary analysis, 37 for cross validation), although relatively large for a functional MRI treatment prediction study (Supplementary Fig. 6 illustrates the sample size of the present study relative to prior studies). ICA reliability was demonstrated using 5-fold leave-one-out cross-validation, but will still need to be replicated in an independent sample. Participants were excluded from enrolment if they were taking any other medications, limiting the generalizability of the findings. Moreover, although many of our models did correct for multiple comparisons, we note that our paper was intended to be an illustration of complimentary methods that might improve clinical prediction.
Summary
In conclusion, this is the first study to our knowledge to use both ICA and HRF-based activation prediction models, as well as performance measures, to predict eventual treatment response for SSRI/SNRIs with high accuracy. Significant predictors were found in rostral dorsal ACC, mid-cingulate, dorsomedial PFC, and lateral orbital frontal cortex, specifically in beta weights for neural activation related to Commissions, and also for performance-based Commission errors. The developmental predictive model (Collins et al., 2015), if replicated with a second sample, offers potential for translation into clinical applications. In sum, our results suggest that depressed individuals who make more errors of commissions and are not able to recruit brain areas important for cognitive control and/or interference resolution during errors of commissions, including the anterior cingulate cortex (error monitoring), the left ventromedial PFC (decision-making and emotional regulation) and the right ventrolateral PFC (motor inhibition), benefit more from treatment with SSRI/SNRIs, appearing more prominently within the escitalopram sample, if not significantly so.
Supplementary Material
Acknowledgements
We thank Forest Pharmaceuticals for the escitalopram (Lexapro) provided for treatment of 19 MDD participants. The remaining escitalopram and duloxetine was provided by the Michigan Clinical Research Center. Forest Pharmaceuticals had no other role in the design, execution, analysis, or preparation of this manuscript. There are no other potential or real conflicts of interest. We thank research assistants who were instrumental in the recruitment of participants and collection of this data, including Kortni K. Meyers and Kathleen E. Hazlett. We thank graduate assistants and postdoctoral fellows who aided in diagnostic interviews and data collection, including Michael L. Brinkman, Michael T. Ransom, Sara J. Walker, and Erica L. Dawson, and Virginia Murphy, R.N., who assisted in recruitment, diagnosis and treatment. We thank the University of Michigan fMRI Laboratory for Assistance in data quality and collection of functional MRI images, and the Michigan Clinical Research Unit staff (MO1 RR00042) for assistance in completion of physical examinations.
Funding
This publication was funded by the Brain and Behavior Research Foundation (NARSAD award to SAL) and the National Institute of Mental Health (NIMH) (R01MH050030, PI: JKZ; P01MH042251, PI: JKZ; and K23MH074459, PI: SAL). Its contents are solely the responsibility of the authors and do not necessarily represent the official views of NIMH or the National Institutes of Health.
Supplementary material
Supplementary material is available at Brain online.
Glossary
Abbreviations
- ACC
anterior cingulate cortex
- HDRS
Hamilton Depression Rating Scale
- HRF
haemodynamic response function
- ICA
independent component analysis
- MDD
major depressive disorder
- PFC
prefrontal cortex
- PGNG
parametric Go/No-go
- SS/SNRI
selective serotonin/serotonin–norepinephrine reuptake inhibitor
References
- Arce E, Simmons AN, Lovero KL, Stein MB, Paulus MP. Escitalopram effects on insula and amygdala BOLD activation during emotional processing. Psychopharmacology 2008; 196: 661–72. [DOI] [PMC free article] [PubMed] [Google Scholar]
- Bagby RM, Ryder AG, Cristi C. Psychosocial and clinical predictors of response to pharmacotherapy for depression. J Psychiatry Neurosci 2002; 27: 250–7. [PMC free article] [PubMed] [Google Scholar]
- Beldzik E, Domagalik A, Daselaar S, Fafrowicz M, Froncisz W, Oginska H, et al. Contributive sources analysis: a measure of neural networks' contribution to brain activations. Neuroimage 2013; 76: 304–12. [DOI] [PubMed] [Google Scholar]
- Bennett CM, Miller MB. How reliable are the results from functional magnetic resonance imaging? Ann NY Acad Sci 2010; 1191: 133–55. [DOI] [PubMed] [Google Scholar]
- Berman MG, Nee DE, Casement M, Kim HS, Deldin P, Kross E, et al. Neural and behavioral effects of interference resolution in depression and rumination. Cogn Affect Behav Neurosci 2011; 11: 85–96. [DOI] [PMC free article] [PubMed] [Google Scholar]
- Bruder GE, Alvarenga JE, Alschuler D, Abraham K, Keilp JG, Hellerstein DJ, et al. Neurocognitive predictors of antidepressant clinical response. J Affect Disord 2014; 166: 108–14. [DOI] [PMC free article] [PubMed] [Google Scholar]
- Bruder GE, Stewart JW, Schaller JD, McGrath PJ. Predicting therapeutic response to secondary treatment with bupropion: dichotic listening tests of functional brain asymmetry. Psychiatry Res 2007; 153: 137–43. [DOI] [PMC free article] [PubMed] [Google Scholar]
- Buckner RL, Andrews-Hanna JR, Schacter DL. The brain's default network: anatomy, function, and relevance to disease. Ann N Y Acad Sci 2008; 1124: 1–38. [DOI] [PubMed] [Google Scholar]
- Bush G, Luu P, Posner MI. Cognitive and emotional influences in anterior cingulate cortex. Trends Cogn Sci 2000; 4: 215–22. [DOI] [PubMed] [Google Scholar]
- Butters MA, Becker JT, Nebes RD, Zmuda MD, Mulsant BH, Pollock BG, et al. Changes in cognitive functioning following treatment of late-life depression 24. Am J Psychiatry 2000; 157: 1949–54. [DOI] [PubMed] [Google Scholar]
- Calhoun VD, Adali T, Pearlson GD, Pekar JJ. Spatial and temporal independent component analysis of functional MRI data containing a pair of task-related waveforms. Hum Brain Mapp 2001; 13: 43–53. [DOI] [PMC free article] [PubMed] [Google Scholar]
- Cole MW, Schneider W. The cognitive control network: integrated cortical regions with dissociable functions. Neuroimage 2007; 37: 343–60. [DOI] [PubMed] [Google Scholar]
- Collins GS, Reitsma JB, Altman DG, Moons KG. Transparent reporting of a multivariable prediction model for individual prognosis or diagnosis (TRIPOD): the TRIPOD Statement. BMC Med 2015; 13: 1. [DOI] [PMC free article] [PubMed] [Google Scholar]
- Davidson RJ, Pizzagalli D, Nitschke JB, Putnam K. Depression: perspectives from affective neuroscience. Ann Rev Psychol 2002; 53: 545–74. [DOI] [PubMed] [Google Scholar]
- Dillon DG, Wiecki T, Pechtel P, Webb C, Goer F, Murray L, et al. A computational analysis of flanker interference in depression. Psychol Med 2015; 45: 2333–44. [DOI] [PMC free article] [PubMed] [Google Scholar]
- Drevets WC. Neuroimaging abnormalities in the amygdala in mood disorders. Ann NY Acad Sci 2003; 985: 420–44. [DOI] [PubMed] [Google Scholar]
- Dunkin JJ, Leuchter AF, Cook IA, Kasl-Godley JE, Abrams M, Rosenberg-Thompson S. Executive dysfunction predicts nonresponse to fluoxetine in major depression. J Affect Disord 2000; 60: 13–23. [DOI] [PubMed] [Google Scholar]
- Dunlop BW, Kelley ME, McGrath CL, Craighead WE, Mayberg HS. Preliminary findings supporting insula metabolic activity as a predictor of outcome to psychotherapy and medication treatments for depression. J Neuropsychiatry Clin Neurosci 2015; 27: 237–9. [DOI] [PMC free article] [PubMed] [Google Scholar]
- Dunlop BW, Reddy S, Yang L, Lubaczewski S, Focht K, Guico-Pabia CJ. Symptomatic and functional improvement in employed depressed patients: a double-blind clinical trial of desvenlafaxine versus placebo. J Clin Psychopharmacol 2011; 31: 569–76. [DOI] [PubMed] [Google Scholar]
- Efron B. Estimating the error rate of a prediction rule: improvement on cross-validation. J Am Stat Assoc 1986; 78: 316–31. [Google Scholar]
- Fales CL, Barch DM, Rundle MM, Mintun MA, Mathews J, Snyder AZ, et al. Antidepressant treatment normalizes hypoactivity in dorsolateral prefrontal cortex during emotional interference processing in major depression. J Affect Disord 2009; 112: 206–11. [DOI] [PMC free article] [PubMed] [Google Scholar]
- First MB, Spitzer RL, Gibbon M, et al. Structured clinical interview for DSM-IV-TR Axis I Disorders, Research Version, Patient Edition. (SCID-I/P) New York: Biometrics Research, New York State Psychiatric Institute; November2002. [Google Scholar]
- Fu CH, Costafreda SG. Neuroimaging-based biomarkers in psychiatry: clinical opportunities of a paradigm shift. Can J Psychiatry 2013; 58: 499–508. [DOI] [PubMed] [Google Scholar]
- Fu CH, Steiner H, Costafreda SG. Predictive neural biomarkers of clinical response in depression: a meta-analysis of functional and structural neuroimaging studies of pharmacological and psychological therapies. Neurobiol Dis 2013; 52: 75–83. [DOI] [PubMed] [Google Scholar]
- Fu CH, Williams SC, Cleare AJ, Brammer MJ, Walsh ND, Kim J, et al. Attenuation of the neural response to sad faces in major depression by antidepressant treatment: a prospective, event-related functional magnetic resonance imaging study. Arch Gen Psychiatry 2004; 61: 877–89. [DOI] [PubMed] [Google Scholar]
- Garavan H, Ross TJ, Stein EA. Right hemispheric dominance of inhibitory control: an event-related functional MRI study. Proc Natl Acad Sci USA 1999; 96: 8301–6. [DOI] [PMC free article] [PubMed] [Google Scholar]
- Gaynes BN, Warden D, Trivedi MH, Wisniewski SR, Fava M, Rush AJ. What did STAR*D teach us? Results from a large-scale, practical, clinical trial for patients with depression. Psychiatr Serv 2009; 60: 1439–45. [DOI] [PubMed] [Google Scholar]
- Glover GH, Thomason ME. Improved combination of spiral-in/out images for BOLD fMRI. Magn Reson Med 2004; 51: 863–8. [DOI] [PubMed] [Google Scholar]
- Godlewska BR, Norbury R, Selvaraj S, Cowen PJ, Harmer CJ. Short-term SSRI treatment normalises amygdala hyperactivity in depressed patients. Psychol Med 2012; 42: 2609–17. [DOI] [PMC free article] [PubMed] [Google Scholar]
- Gorlyn M, Keilp JG, Grunebaum MF, Taylor BP, Oquendo MA, Bruder GE, et al. Neuropsychological characteristics as predictors of SSRI treatment response in depressed subjects. J Neural Transm 2008; 115: 1213–9. [DOI] [PMC free article] [PubMed] [Google Scholar]
- Greenberg PE, Kessler RC, Birnbaum HG, Leong SA, Lowe SW, Berglund PA, et al. The economic burden of depression in the United States: how did it change between 1990 and 2000? J Clin Psychiatry 2003; 64: 1465–75. [DOI] [PubMed] [Google Scholar]
- Gudayol-Ferre E, Guardia-Olmos J, Pero-Cebollero M, Herrera-Guzman I, Camarena B, Cortes-Penagos C, et al. Prediction of the time-course pattern of remission in depression by using clinical, neuropsychological, and genetic variables. J Affect Disord 2013; 150: 1082–90. [DOI] [PubMed] [Google Scholar]
- Gyurak A, Patenaude B, Korgaonkar MS, Grieve SM, Williams LM, Etkin A. Frontoparietal activation during response inhibition predicts remission to antidepressants in patients with major depression. Biol Psychiatry 2015; 79: 274–81. [DOI] [PubMed] [Google Scholar]
- Hamilton M. A rating scale for depression. J Neurol Neurosurg Psychiatry 1960; 23: 56–62. [DOI] [PMC free article] [PubMed] [Google Scholar]
- Harmer CJ, Mackay CE, Reid CB, Cowen PJ, Goodwin GM. Antidepressant drug treatment modifies the neural processing of nonconscious threat cues. Biol Psychiatry 2006; 59: 816–20. [DOI] [PubMed] [Google Scholar]
- Henson RNA, Rugg MD, Shallice T, Dolan RJ. Confidence in recognition memory for words: dissociating right prefrontal roles in episodic retrieval. J Cognitive Neurosci 2000; 12: 913–23. [DOI] [PubMed] [Google Scholar]
- Holtzheimer PE, Mayberg HS. Stuck in a rut: rethinking depression and its treatment. Trends Neurosci 2011; 34: 1–9. [DOI] [PMC free article] [PubMed] [Google Scholar]
- Insel TR. June 12. Director’s Blog: experimental medicine In: NIMH, editor. http://www.nimh.nih.gov/about/director/2012/experimental-medicine.shtml NIH.gov; 2012. [Google Scholar]
- Iverson GL, Brooks BL, Langenecker SA, Young AH. Identifying a cognitive impairment subgroup in adults with mood disorders. J Affect Disord 2011; 132: 360–7. [DOI] [PMC free article] [PubMed] [Google Scholar]
- Jenkins LM, Peters AT, Jacobs RH, Langenecker SA. Neuroscience of functional outcomes and treatment targets in major depressive disorder. In: McIntyre RS, Cha DS, editors. Cognitive impairment in major depressive disorder. Cambridge: Cambridge University Press; 2016. [Google Scholar]
- Jenkinson M, Bannister P, Brady M, Smith S. Improved optimization for the robust and accurate linear registration and motion correction of brain images. Neuroimage 2002; 17: 825–41. [DOI] [PubMed] [Google Scholar]
- Kampf-Sherf O, Zlotogorski Z, Gilboa A, Speedie L, Lereya J, Rosca P, et al. Neuropsychological functioning in major depression and responsiveness to selective serotonin reuptake inhibitors antidepressants. J Affect Disord 2004; 82: 453–9. [DOI] [PubMed] [Google Scholar]
- Kassel MT, Rao JA, Walker SJ, Briceno EM, Gabriel LB, Weldon AL, et al. Decreased fronto-limbic activation and disrupted semantic cued list learning in major depressive disorder. J Int Neuropsychol Soc 2016; 22: 412–25. [DOI] [PMC free article] [PubMed] [Google Scholar]
- Kessler RC, Akiskal HS, Ames M, Birnbaum H, Greenberg P, Hirschfeld RM, et al. Prevalence and effects of mood disorders on work performance in a nationally representative sample of U.S. workers. Am J Psychiatry 2006; 163: 1561–8. [DOI] [PMC free article] [PubMed] [Google Scholar]
- Kim DI, Mathalon DH, Ford JM, Mannell M, Turner JA, Brown GG, et al. Auditory oddball deficits in schizophrenia: an independent component analysis of the fMRI multisite function BIRN study. Schizophr Bull 2009; 35: 67–81. [DOI] [PMC free article] [PubMed] [Google Scholar]
- Langenecker SA, Bieliauskas LA, Rapport LJ, Zubieta JK, Wilde EA, Berent S. Face emotion perception and executive functioning deficits in depression. J Clin Exp Neuropsychol 2005; 27: 320–33. [DOI] [PubMed] [Google Scholar]
- Langenecker SA, Lee J, Bieliauskas LA. Neuropsychology of depression and related mood disorders. In: Adams K, Igor G, editors. Neuropsychological assessment of neuropsychiatric and neuromedical disorders. UK: Oxford University Press; 2009. [Google Scholar]
- Langenecker SA, Nielson KA, Rao SM. fMRI of healthy older adults during Stroop interference. Neuroimage 2004; 21: 192–200. [DOI] [PubMed] [Google Scholar]
- Langenecker SA, Zubieta JK, Young EA, Akil H, Nielson KA. A task to manipulate attentional load, set-shifting, and inhibitory control: convergent validity and test-retest reliability of the parametric Go/No-go test. J Clin Exp Neuropsychol 2007; 29: 842–53. [DOI] [PubMed] [Google Scholar]
- Liebel SW, Clark US, Xu XX, Riskin-Jones HH, Hawkshead BE, Schwarz NF, et al. An fMRI-compatible symbol search task. J Int Neuropsychol Soc 2015; 21: 231–8. [DOI] [PMC free article] [PubMed] [Google Scholar]
- Mayberg HS. Modulating dysfunctional limbic-cortical circuits in depression: towards development of brain-based algorithms for diagnosis and optimised treatment. Br Med Bull 2003; 65: 193–207. [DOI] [PubMed] [Google Scholar]
- McGrath CL, Kelley ME, Holtzheimer PE, Dunlop BW, Craighead WE, Franco AR, et al. Toward a neuroimaging treatment selection biomarker for major depressive disorder. JAMA Psychiatry 2013; 70: 821–9. [DOI] [PMC free article] [PubMed] [Google Scholar]
- Mitterschiffthaler MT, Williams SC, Walsh ND, Cleare AJ, Donaldson C, Scott J, et al. Neural basis of the emotional Stroop interference effect in major depression. Psychol Med 2008; 38: 247–56. [DOI] [PubMed] [Google Scholar]
- Nierenberg AA. Predictors of response to antidepressants general principles and clinical implications. Psychiatr Clin North Am 2003; 26: 345–52. [DOI] [PubMed] [Google Scholar]
- Papakostas GI, Thase M, Fava M, Nelson JC, Shelton R. Are antidepressant drugs that combine serotonergic and noradrenergic mechanisms of action more effective than the selective serotonin reuptake inhibitors in treating major depressive disorder? A Meta-analysis of Studies of Newer Agents. Biol Psychiatry 2007; 62: 1217–27. [DOI] [PubMed] [Google Scholar]
- Peterson BS, Skudlarski P, Gatenby JC, Zhang H, Anderson AW, Gore JC. An fMRI study of Stroop word-color interference: evidence for cingulate subregions subserving multiple distributed attentional systems. Biol Psychiatry 1999; 45: 1237–58. [DOI] [PubMed] [Google Scholar]
- Phillips ML, Chase HW, Sheline YI, Etkin A, Almeida JR, Deckersbach T, et al. Identifying predictors, moderators, and mediators of antidepressant response in major depressive disorder: neuroimaging approaches. Am J Psychiatry 2015; 172: 124–38. [DOI] [PMC free article] [PubMed] [Google Scholar]
- Pizzagalli DA. Frontocingulate dysfunction in depression: toward biomarkers of treatment response. Neuropsychopharmacology 2011; 36: 183–206. [DOI] [PMC free article] [PubMed] [Google Scholar]
- Rao JA, Jenkins LM, Hymen E, Feigon M, Weisenbach SL, Zubieta J-K, et al. Differential resting state connectivity patterns and impaired semantically cued list learning test performance in early course remitted major depressive disorder. J Int Neuropsychol Soc 2016; 22: 225–39. [DOI] [PMC free article] [PubMed] [Google Scholar]
- Ruhe HG, Booij J, Veltman DJ, Michel MC, Schene AH. Successful pharmacologic treatment of major depressive disorder attenuates amygdala activation to negative facial expressions: a functional magnetic resonance imaging study. Journal Clin Psychiatry 2012; 73: 451–9. [DOI] [PubMed] [Google Scholar]
- Ryan KA, Dawson EL, Kassel MT, Weldon AL, Marshall DF, Meyers KK, et al. Shared dimensions of performance and activation dysfunction in cognitive control in females with mood disorders. Brain 2015; 138 (Pt 5): 1424–34. [DOI] [PMC free article] [PubMed] [Google Scholar]
- Schmaal L, Marquand AF, Rhebergen D, van Tol MJ, Ruhe HG, van der Wee NJ, et al. Predicting the naturalistic course of major depressive disorder using clinical and multimodal neuroimaging information: a multivariate pattern recognition study. Biol Psychiatry 2015; 78: 278–86. [DOI] [PMC free article] [PubMed] [Google Scholar]
- Siegle G, Thompson W, Collier A, Berman SR, Feldmiller J, Thase M, et al. Toward clinically useful neuroimaging in depression treatment. Arch Gen Psychiatry 2012; 69: 913–24. [DOI] [PMC free article] [PubMed] [Google Scholar]
- Stevens J. Applied multivariate statistics for the social sciences. Mahwah, NJ: Lawrence Ehrlbaum Associates; 1996. [Google Scholar]
- Steyerberg EW, Vergouwe Y. Towards better clinical predictionmodels: seven steps for development and anABCDfor validation. Eur Heart J 2014; 35: 1925–31. [DOI] [PMC free article] [PubMed] [Google Scholar]
- Strange B, Otten L, Josephs O, Rugg M, Dolan R. Dissociable human perirhinal, hippocampal, and parahippocampal roles during verbal encoding. J Neurosci 2002; 22: 523–8. [DOI] [PMC free article] [PubMed] [Google Scholar]
- Taylor BP, Bruder GE, Stewart JW, McGrath PJ, Halperin J, Ehrlichman H, et al. Psychomotor slowing as a predictor of fluoxetine nonresponse in depressed outpatients. Am J Psychiatry 2006; 163: 73–8. [DOI] [PubMed] [Google Scholar]
- Trivedi MH, Rush AJ, Wisniewski SR, Nierenberg AA, Warden D, Ritz L, et al. Evaluation of outcomes with citalopram for depression using measurement-based care in STAR*D: implications for clinical practice. Am J Psychiatry 2006; 163: 28–40. [DOI] [PubMed] [Google Scholar]
- Victor TA, Furey ML, Fromm SJ, Ohman A, Drevets WC. Relationship between amygdala responses to masked faces and mood state and treatment in major depressive disorder. Arch Gen Psychiatry 2010; 67: 1128–38. [DOI] [PMC free article] [PubMed] [Google Scholar]
- Votruba KL, Langenecker SA. Factor structure, construct validity, and age- and education-based normative data for the parametric Go/No-go test. J Clin Exp Neuropsychol 2013; 35: 132–46. [DOI] [PMC free article] [PubMed] [Google Scholar]
- Williams LM, Korgaonkar MS, Song YC, Paton R, Eagles S, Goldstein-Piekarski A, et al. Amygdala reactivity to emotional faces in the prediction of general and medication-specific responses to antidepressant treatment in the randomized iSPOT-D trial. Neuropsychopharmacology 2015; 40: 2398–408. [DOI] [PMC free article] [PubMed] [Google Scholar]
- Xu J, Potenza MN, Calhoun VD. Spatial ICA reveals functional activity hidden from traditional fMRI GLM-based analyses. Front Neurosci 2013a; 7: 154. [DOI] [PMC free article] [PubMed] [Google Scholar]
- Xu J, Zhang S, Calhoun VD, Monterosso J, Li CS, Worhunsky PD, et al. Task-related concurrent but opposite modulations of overlapping functional networks as revealed by spatial ICA. Neuroimage 2013b; 79: 62–71. [DOI] [PMC free article] [PubMed] [Google Scholar]
- Yeo BT, Krienen FM, Sepulcre J, Sabuncu MR, Lashkari D, Hollinshead M, et al. The organization of the human cerebral cortex estimated by intrinsic functional connectivity. J Neurophysiol 2011; 106: 1125–65. [DOI] [PMC free article] [PubMed] [Google Scholar]
- Zilles D, Lewandowski M, Vieker H, Henseler I, Diekof E, Melcher T, et al. Gender differences in verbal and visuospatial working memory performance and networks. Neuropsychobiology 2016; 3: 52–63. [DOI] [PubMed] [Google Scholar]
Associated Data
This section collects any data citations, data availability statements, or supplementary materials included in this article.