Significance
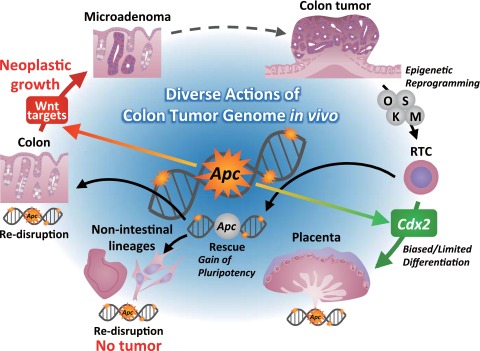
Genotype-linked disease phenotypes are often observed in a cell type-specific manner, implying a cellular context-dependent effect of the genetic aberrations. However, the extent to which cellular context affects the biological consequences of oncogenic mutations is unclear. Here, we reprogrammed colon tumor cells in an ApcMin/+ (adenomatous polyposis coli) mouse model and showed the divergent in vivo consequences of Apc mutation that arise in different cellular contexts. We also showed that the reprogrammed tumor cells remain in a pretumoral microadenoma stage after differentiation into colonic epithelium, suggesting that macroscopic colon tumor cells are reprogrammable into microadenoma cells. Our results underscore the significance of epigenetic regulation on gene expression, cellular plasticity, and cellular behavior in response to cancer-causing mutations.
Keywords: iPS cell, cancer epigenetics, plasticity, colon cancer, mouse model
Abstract
The spectrum of genetic mutations differs among cancers in different organs, implying a cellular context-dependent effect for genetic aberrations. However, the extent to which the cellular context affects the consequences of oncogenic mutations remains to be fully elucidated. We reprogrammed colon tumor cells in an ApcMin/+ (adenomatous polyposis coli) mouse model, in which the loss of the Apc gene plays a critical role in tumor development and subsequently, established reprogrammed tumor cells (RTCs) that exhibit pluripotent stem cell (PSC)-like signatures of gene expression. We show that the majority of the genes in RTCs that were affected by Apc mutations did not overlap with the genes affected in the intestine. RTCs lacked pluripotency but exhibited an increased expression of Cdx2 and a differentiation propensity that was biased toward the trophectoderm cell lineage. Genetic rescue of the mutated Apc allele conferred pluripotency on RTCs and enabled their differentiation into various cell types in vivo. The redisruption of Apc in RTC-derived differentiated cells resulted in neoplastic growth that was exclusive to the intestine, but the majority of the intestinal lesions remained as pretumoral microadenomas. These results highlight the significant influence of cellular context on gene regulation, cellular plasticity, and cellular behavior in response to the loss of the Apc function. Our results also imply that the transition from microadenomas to macroscopic tumors is reprogrammable, which underscores the importance of epigenetic regulation on tumor promotion.
Genetic alterations are associated with the pathogenesis of various diseases, including cancer. Genotype-linked disease phenotypes are often observed in an organ-specific manner, suggesting that the correlation between the genotype and phenotype depends on the cell type (1, 2). However, there is limited direct evidence on the cell type-specific correlation between the genotype and phenotype, especially in diseases with multiple genetic alterations, such as cancer. Induced pluripotent stem cells (iPSCs), the generation of which enables the control of cell fate while retaining the original genetic information, are suitable for investigating the cell type-specific correlation between the genotype and phenotype (3). By establishing induced iPSCs from neoplastic cells, we can obtain various cell types that share genetic information associated with tumor development.
The APC (adenomatous polyposis coli) gene was initially discovered as a mutated gene in patients with familial adenomatous polyposis (4). The presence of this mutation predisposes the patient to the development of colon cancer. In addition, somatic APC mutations are found in the majority of sporadic colon cancers (5). APC mutations often result in the production of a truncated protein, which typically stabilizes β-catenin and causes the activation of β-catenin/Tcf–mediated transcription (6). Given that the stabilized form of β-catenin induces intestinal neoplasms (7, 8), it is suggested that Apc mutations induce intestinal tumors through the activation of β-catenin/Tcf–mediated transcription. Notably, Apc mutations are observed in various types of cancers, albeit at a low frequency. However, with the exception of the intestinal cell lineage, the consequences of Apc mutations have not been fully elucidated in most cell types.
Accordingly, we used iPSC technology and investigated the impact of the cellular context on the consequence of Apc mutations. We succeeded in obtaining various cell types from colon tumor cells by establishing reprogrammed tumor cells (RTCs). We provide direct in vivo evidence of the cell type-specific consequences of tumor-associated mutations.
Results
The Reprogramming of Macroscopic Colon Tumor Cells.
We attempted to reprogram macroscopic colon tumor cells in Apc Min mice that were treated with a potent tumor promoter, dextran sodium sulfate (DSS) (Fig. S1A). In this study, we used a doxycycline (Dox)-inducible system to transduce reprogramming factors [octamer-binding transcription factor (Oct3/4), sex determining region Y-box 2 (Sox2), Kruppel-like factor 4 (Klf4), and avian myelocytomatosis viral oncogene homolog (c-Myc)]. ApcMin/+ mice were crossed with in vivo reprogrammable mice (9). The macroscopic colon tumors in the DSS-treated compound mice were carefully resected, and tumor cells were cultured in Dox-containing ES cell (ESC) medium.
Fig. S1.
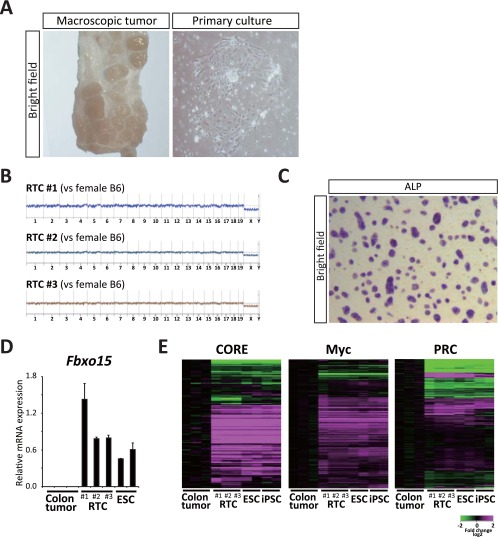
(A) Representative macroscopic image of colon tumors developed in DSS-treated ApcMin/+ mice and their primary cultured cells. Reprogramming factors were induced in primary cultured tumor cells by Dox exposure. (B) Chromosomal status in three different RTC lines (nos. 1–3) with CGH analysis. No obvious chromosomal aberration is observed in three RTC lines. (C) ALP activity in RTCs. (D) qRT-PCR analysis for the expression of Fbxo15 in colon tumors from ApcMin/+ mice, RTCs, and ESCs. Data are presented as the mean ± SD. The mean expression level of RTCs was set to one. (E) Transcriptional profiles of three modules for the ESC transcriptional program in colon tumors, RTCs, ESCs, and iPSCs. CORE, Myc, and Polycomb Repressive Complex modules are similarly activated in RTCs and PSCs. Related to Fig. 1.
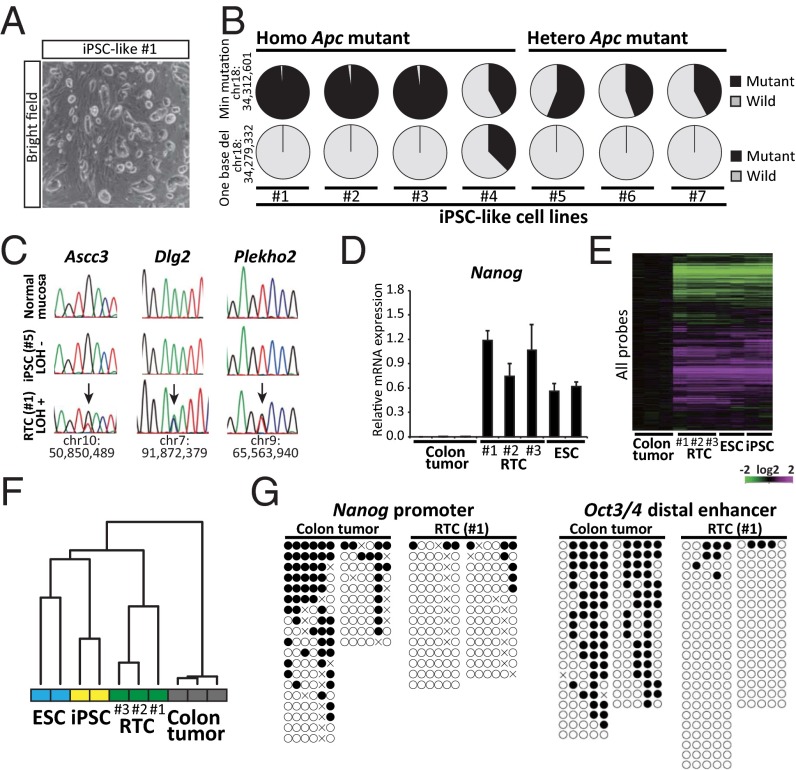
After the transduction of reprogramming factors in the primary cultured cells, we obtained colonies that were morphologically similar to iPSCs. The iPSC-like colonies were picked up and expanded in the absence of Dox to establish iPSC-like cell lines (Fig. 1A). It is known that the neoplastic transformation of the colonic epithelium in Apc Min mice is initiated by a spontaneous loss of heterozygosity (LOH) at the Apc locus (10). To exclude the iPSC-like cell lines that are derivatives of nonneoplastic stromal cells within tumors, we next performed an exome analysis and determined the Apc status of the established iPSC-like cell lines (nos. 1–7). Three of seven iPSC-like cell lines exhibited mitotic recombination and consequently, lacked the WT allele (nos. 1–3), and one line showed a one-base deletion at the Apc allele (no. 4), indicating that they are derived from colon tumor cells (Fig. 1B). We designated the iPSC-like cells harboring Apc LOH or additional Apc mutation as RTCs (nos. 1–4) and performed additional analyses. Comparison of four RTC cell lines with the Apc LOH-negative cell lines (nos. 5–7) revealed a total of 43 potential tumor-specific mutation sites, including Apc mutations, in each of four RTC lines (Table S1), although we also found mutations that were specific to the Apc LOH-negative cell lines. A conventional direct sequencing analysis confirmed the presence of Ascc3, Dlg2, and Plekho2 mutations in RTC 1. Consistent with the findings of previous studies, which reported that intestinal tumors arise with a normal karyotype in the Apc Min mouse model (11), a comparative genomic hybridization analysis revealed no abnormal karyotypes in three independent RTC lines (nos. 1–3 in Fig. S1B).
Fig. 1.
Establishment of RTCs. (A) Morphology of iPSC-like cells. iPSC-like cell lines were maintained in the absence of Dox. (B) Apc status of established iPSC-like cell lines (nos. 1–7) by exome analysis. Three lines (nos. 1–3) show somatic recombination, resulting in the lack of WT allele at the Min mutation site. iPSC-like cell line no. 4 harbors a one-base deletion in Exon 7 of the Apc gene. (C) A direct sequencing analysis of normal colonic mucosa, iPSC-like, and RTC lines. RTC no. 1 harbors point mutations at Ascc3, Dlg2, and Plekho2 gene loci, whereas normal colonic mucosa and iPSC-like line no. 5 do not possess any of these mutations. (D) qRT-PCR analysis for the expression of Nanog in colon tumors from Apc Min mice, RTCs (nos. 1–3), and ESCs. Data are presented as the mean ± SD. The mean expression level of RTCs was set to one. (E) Global transcriptional profiles of RTCs (nos. 1–3), colon tumors (GSE60620), ESCs, and iPSCs (GSE45916). (F) A hierarchical cluster analysis of the microarray data revealed that RTCs are clustered with PSCs. (G) Bisulfite sequencing analyses revealed that the Nanog promoter and the distal enhancer region of Oct3/4 are demethylated in RTCs. White and black circles indicate nonmethylated and methylated cytosine at CpG sites, respectively.
Table S1.
A list of potential mutation sites in RTCs
| Chromosome | Position | Gene | Base changes | Amino acid changes | RTC no. 1 | RTC no. 2 | RTC no. 3 | RTC no. 4 | ||||||
| Ref. | Alteration | Ref. | Alteration | Mutation frequency | Sequencing depth | Mutation frequency | Sequencing depth | Mutation frequency | Sequencing depth | Mutation frequency | Sequencing depth | |||
| chr18 | 34279332 | Apc | TC | T | Frame shift | 0 | 47 | 0 | 55 | 0 | 51 | 0.6 | 48 | |
| chr15 | 74671609 | Arc | T | C | Glu | Gly | 0 | 93 | 0 | 72 | 0 | 106 | 0.5 | 85 |
| chr10 | 50850489 | Ascc3 | G | T | Asp | Tyr | 0.479166667 | 48 | 0 | 43 | 0 | 50 | 0 | 46 |
| chr3 | 122505048 | Bcar3 | C | G | Pro | Arg | 0 | 33 | 0 | 26 | 0 | 36 | 0.653846154 | 34 |
| chr2 | 170348102 | Bcas1 | G | A | Ser | Phe | 0 | 38 | 0 | 42 | 0 | 44 | 0.5 | 53 |
| chr1 | 132122387 | Cdk18 | G | A | Arg | Cys | 0 | 46 | 0 | 46 | 0 | 47 | 0.347826087 | 53 |
| chr16 | 78949101 | Chodl | C | T | Ala | Val | 0.446808511 | 47 | 0.590163934 | 72 | 0.407407407 | 61 | 0.555555556 | 54 |
| chr11 | 69967109 | Cldn7 | T | G | Splice donor variation | 0.293103448 | 58 | 0.173333333 | 45 | 0.172413793 | 75 | 0.111111111 | 58 | |
| chr19 | 10535264 | Cpsf7 | G | GC | Frame shift | 0.233333333 | 60 | 0.386666667 | 56 | 0 | 75 | 0 | 47 | |
| chr18 | 71262919 | Dcc | G | A | Thr | Met | 0 | 45 | 0 | 38 | 0.3125 | 49 | 0 | 48 |
| chr10 | 62627579 | Ddx50 | G | T | Ala | Asp | 0.307692308 | 52 | 0.611111111 | 55 | 0.487804878 | 54 | 0.454545455 | 41 |
| chr9 | 54393724 | Dmxl2 | C | A | Ala | Ser | 0.225 | 40 | 0.142857143 | 33 | 0.3 | 56 | 0.121212121 | 40 |
| chr13 | 20241607 | Elmo1 | G | A | Arg | Gln | 0 | 91 | 0 | 72 | 0 | 102 | 0.513888889 | 101 |
| chr5 | 84331458 | Epha5 | C | A | Arg | Leu | 0 | 36 | 0 | 31 | 0 | 62 | 0.35483871 | 35 |
| chr4 | 48218091 | Erp44 | A | G | Ser | Pro | 0.509090909 | 55 | 0.4375 | 51 | 0.561403509 | 64 | 0.352941176 | 57 |
| chr5 | 65038713 | Fam114a1 | A | G | Asn | Ser | 0 | 109 | 0 | 101 | 0 | 127 | 0.386138614 | 123 |
| chr11 | 55283530 | Fat2 | T | G | Asp | Ala | 0 | 70 | 0 | 67 | 0.525423729 | 62 | 0 | 59 |
| chr5 | 21490487 | Fbxl13 | A | C | Leu | Val | 0 | 24 | 0.428571429 | 18 | 0 | 28 | 0 | 26 |
| chr1 | 171229915 | Fcer1g | G | A | Arg | Trp | 0.981132075 | 53 | 1 | 52 | 0.983050847 | 59 | 1 | 59 |
| chr3 | 96873548 | Gpr89 | A | C | Val | Gly | 0.282608696 | 46 | 0.075757576 | 53 | 0.054545455 | 66 | 0.056603774 | 55 |
| chr6 | 70216997 | Igkv8-24 | A | G | Phe | Leu | 0.277173913 | 184 | 0 | 182 | 0.19895288 | 273 | 0 | 191 |
| chr6 | 39170143 | Kdm7a | A | T | Val | Asp | 0 | 79 | 0 | 70 | 0.473684211 | 115 | 0 | 95 |
| chr10 | 62559613 | Kif1bp | C | T | Glu | Lys | 0.471428571 | 70 | 0.443037975 | 64 | 0.428571429 | 79 | 0.484375 | 56 |
| chr7 | 118853017 | Knop1 | G | T | Gln | Lys | 0 | 26 | 0.542857143 | 26 | 0 | 35 | 0 | 27 |
| chr15 | 101846271 | Krt1 | T | G | Thr | Pro | 0.266666667 | 30 | 0.043478261 | 24 | 0.214285714 | 23 | 0.166666667 | 28 |
| chr3 | 15833088 | LOC100038947 | C | T | Val | Met | 0.090909091 | 22 | 0.034482759 | 28 | 0.111111111 | 29 | 0.285714286 | 27 |
| chr2 | 128729365 | Mertk | A | G | Thr | Ala | 0.366666667 | 30 | 0.347826087 | 35 | 0.37254902 | 46 | 0.4 | 51 |
| chr10 | 56115811 | Msl3l2 | A | C | Thr | Pro | 0.083333333 | 12 | 0.047619048 | 14 | 0.071428571 | 21 | 0.285714286 | 14 |
| chr10 | 107493472 | Myf6 | C | A | Gly | Val | 0 | 24 | 0 | 21 | 0 | 28 | 0.714285714 | 23 |
| chr13 | 36726854 | Nrn1 | T | C | Tyr | Cys | 0 | 22 | 0.40625 | 27 | 0 | 32 | 0 | 24 |
| chr10 | 95549367 | Nudt4 | G | C | Ser | Trp | 0.345454545 | 55 | 0 | 74 | 0 | 89 | 0 | 96 |
| chr2 | 85841317 | Olfr1019 | G | A | Ala | Val | 0 | 42 | 0 | 40 | 0 | 35 | 0.65 | 46 |
| chr9 | 45975187 | Pafah1b2 | T | C | Glu | Gly | 0.15 | 20 | 0.142857143 | 26 | 0.333333333 | 14 | 0.115384615 | 18 |
| chr18 | 37091705 | Pcdhac1 | T | G | Phe | Val | 0 | 27 | 0.4375 | 30 | 0 | 32 | 0 | 30 |
| chr18 | 37514158 | Pcdhb21 | A | AT | Frame shift | 0 | 97 | 0 | 127 | 0 | 112 | 0.456692913 | 104 | |
| chr9 | 65563940 | Plekho2 | T | G | Thr | Pro | 0.575757576 | 33 | 0.405405405 | 30 | 0.5 | 37 | 0 | 34 |
| chr6 | 89356717 | Plxna1 | A | C | Val | Gly | 0.162162162 | 37 | 0.111111111 | 45 | 0.285714286 | 36 | 0.088888889 | 21 |
| chr8 | 4213326 | Prr36 | AG | A | Frame shift | 0 | 21 | 0 | 15 | 0 | 26 | 0.466666667 | 22 | |
| chr13 | 22007249 | Prss16 | G | A | Ser | Phe | 0.142857143 | 21 | 0.294117647 | 11 | 0.269230769 | 17 | 0.363636364 | 26 |
| chr4 | 129310156 | Rbbp4 | G | C | Ala | Gly | 0.25 | 12 | 0.136363636 | 22 | 0.263157895 | 22 | 0.136363636 | 19 |
| chr4 | 129310153 | Rbbp4 | T | C | Glu | Gly | 0.357142857 | 14 | 0.047619048 | 24 | 0 | 21 | 0.041666667 | 14 |
| chr12 | 108107241 | Setd3 | C | A | Glu | Asp | 0.221774194 | 248 | 0.26369863 | 350 | 0.249291785 | 292 | 0.185714286 | 353 |
| chr1 | 133393113 | Sox13 | A | G | Leu | Pro | 0.071428571 | 14 | 0.346153846 | 21 | 0.333333333 | 26 | 0.476190476 | 15 |
| chr1 | 85642543 | Sp140 | A | G | Thr | Ala | 0 | 50 | 0 | 42 | 0.416666667 | 62 | 0 | 36 |
| chr11 | 94091820 | Spag9 | T | G | Val | Gly | 0.29245283 | 106 | 0.168 | 108 | 0.35 | 125 | 0.25 | 100 |
| chr12 | 44902955 | Stxbp6 | T | C | Lys | Glu | 0.5 | 26 | 0.269230769 | 41 | 0.483870968 | 26 | 0.243902439 | 31 |
| chr2 | 51627659 | Tas2r134 | G | T | Cys | Phe | 0.211538462 | 52 | 0.235294118 | 37 | 0.35 | 51 | 0.189189189 | 40 |
| chr4 | 141616450 | Tmem82 | T | G | Thr | Pro | 0.058823529 | 17 | 0.185185185 | 15 | 0.125 | 27 | 0.4 | 16 |
| chr2 | 25524919 | Traf2 | C | A | Cys | Phe | 0.162162162 | 37 | 0.148148148 | 42 | 0.195652174 | 54 | 0.261904762 | 46 |
| chr2 | 13519932 | Trdmt1 | T | G | Glu | Asp | 0.552631579 | 76 | 0 | 65 | 0 | 92 | 0 | 83 |
| chr2 | 120930872 | Ubr1 | T | G | His | Pro | 0.272727273 | 33 | 0.142857143 | 31 | 0.172413793 | 42 | 0.193548387 | 29 |
| chr2 | 164820332 | Zswim3 | G | C | Arg | Pro | 0.475409836 | 61 | 0 | 63 | 0 | 89 | 0 | 63 |
RTCs Share Features with Pluripotent Stem Cells.
We next examined whether these RTCs have similar characteristics to pluripotent stem cells (PSCs). The RTCs were positive for alkaline phosphatase (Fig. S1C), and a quantitative RT-PCR (qRT-PCR) revealed the high expression of pluripotency-related genes, such as Nanog and Fbxo15 (Fig. 1D, Fig. S1D, and Table S2). A microarray analysis revealed that the global transcriptional profile of RTCs exhibits an ESCs/iPSCs-like signature (Fig. 1 E and F). Three modules for the ESC transcriptional program (12) were similarly activated in RTCs and PSCs (Fig. S1E), implying that the loss of the Apc gene does not have a large impact on the global gene expression in these cells. A DNA methylation analysis revealed that RTCs exhibit a loss of DNA methylation at Oct3/4 distal enhancer and Nanog promoter, which is a critical event for successful reprogramming (Fig. 1G). Taken together, these results indicate that RTCs exhibit similar features to PSCs, despite the presence of genetic mutations that are associated with colon tumor development.
Table S2.
Primers used in this study
| Genes | Forward | Reverse |
| Quantitative PCR | ||
| β-Actin | GCTACAGCTTCACCACCACA | CTTCTGCATCCTGTCAGCAA |
| S33 mutant β-catenin | ATGGAGCCGGACAGAAAAGC | CTTGCCACTCAGGGAAGGA |
| Cdx2 | CAAGGACGTGAGCATGTATCC | GTAACCACCGTAGTCCGGGTA |
| Elf5 | ATGTTGGACTCCGTAACCCAT | GCAGGGTAGTAGTCTTCATTGCT |
| Eomes | GGCCCCTATGGCTCAAATTCC | CCTGCCCTGTTTGGTGATG |
| Fbxo15 | TCGTGGGACTGAGCACAACTA | TGACAGATGAGCCTCTAACAAAC |
| Gata3 | GGGTTCGGATGTAAGTCGAG | CCACAGTGGGGTAGAGGTTG |
| Hand1 | GGCAGCTACGCACATCATCA | CCTGGCATCGGGACCATAG |
| Nanog | TCTTCCTGGTCCCCACAGTTT | GCAAGAATAGTTCTCGGGATGAA |
| Bisulfite sequencing | ||
| Nanog | GATTTTGTAGGTGGGATTAATTGTGAATTT | ACCAAAAAAACCCACACTCATATCAATATA |
| Nr5a2 | TTAAAGTATGAGTGTGTTTTTGGTAAG | AAAAAACCCTTTCTAACCTCCTATC |
| Oct3/4 | GGTTTTAGAGGTTGGTTTTGGG | CATCTCTCTAACCCTCTCCATAAATC |
| 5′ probe for Southern blotting for Apc gene | TCAGAATTTTGCTTGGGTTTCC | AGGTTAGGAATGCCCCATCG |
| Confirmation of LoxP deletion at Apc gene | ||
| 1 | AGAAACAGCACTGACCCAAA | ATGTCCCACAAGGCTTCCTG |
| 2 | TAGAAACAGCACTGACCCAA | CCTCCATCATACTCAGAAGTTT |
| Direct sequencing | ||
| Ascc3 | AAGGCCTTCTCACTCACACG | AACCCGTCACACCACAATGT |
| Dlg2 | CCCTGCCTTCTCATGTCCAA | ACCTGAGTCTGCCATCCTCT |
| Plekho2 | GTCTCGGGCAAGGAAGGAAA | GGATCCAACCGTTAGGCACA |
Cell Type-Specific Effects of the Apc Mutation on Gene Expression.
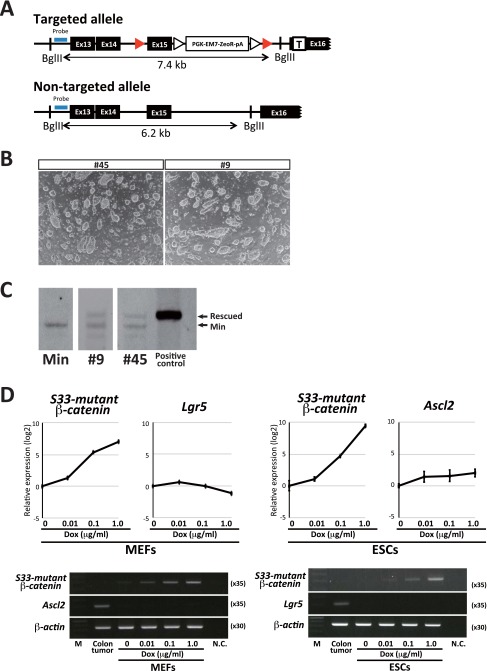
The representative target genes of the Apc mutation in the intestine include Axin2, Lgr5, and Ascl2 (13, 14). We next investigated the genes affected by Apc mutations in RTCs. For this purpose, we rescued one of the ApcMin alleles in RTCs by homologous recombination with a targeting allele that contained the WT sequence of Apc (Fig. 2A and Fig. S2A). Two Apc-rescued RTC lines (nos. 45 and 9) were established from two independent RTC lines (nos. 1 and 3, respectively) (Fig. S2 B and C).
Fig. 2.
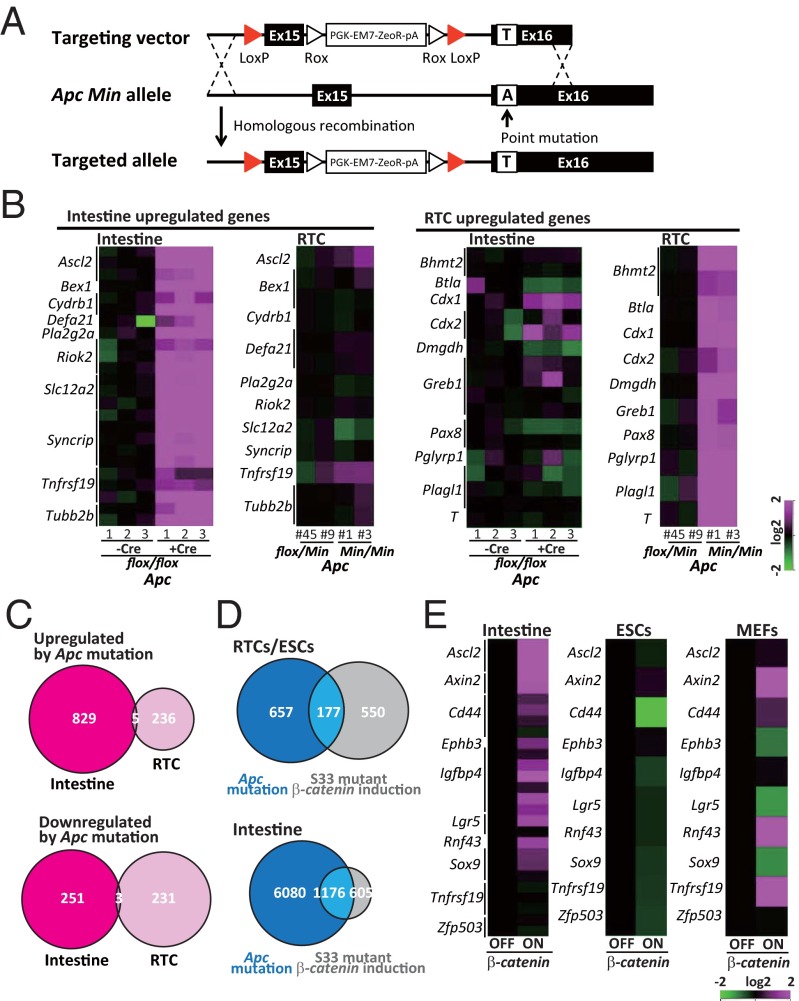
Cell type-specific effect of Apc mutation on gene expression. (A) A schematic illustration of homologous recombination of the Apc Min allele with a targeting vector containing the WT Apc gene sequence. (B) Cell type-specific effect of the Apc mutation on gene expression. (C) Up-/down-regulated genes by the Apc mutation in the intestine and RTCs (nos. 1 and 45 were compared; cutoff value is threefold in the intestine and twofold in RTCs). GSE70262 was used for the gene expression data in the intestine. (D) Genes up-regulated by the Apc mutation or induction of S33 mutant β-catenin. Apc mutation affects a substantially different set of genes in RTCs (no. 1) than the ectopic induction of mutant β-catenin does in ESCs (cutoff value is 1.5-fold). Note that target genes of Apc mutation and those of the β-catenin induction often overlap in the intestine (cutoff value is 1.5-fold). (E) The effects of S33 mutant β-catenin induction on gene expression in different cell types. Previously reported target genes of the canonical Wnt pathway are often up-regulated in colonic crypts (GSE41688). However, the target genes were hardly affected in ESCs and differentially regulated in MEFs.
Fig. S2.
(A) A schematic drawing of the targeted and nontargeted Apc allele. (B) Morphology of Apc-rescued clones nos. 45 and 9. Clones nos. 45 and 9 were derived from RTC nos. 1 and 3, respectively. (C) Southern blotting confirmed successful recombination of the Apc allele in clones nos. 45 and 9. (D) Dosage effect of S33 mutant β-catenin on expression of the canonical Wnt target genes. MEFs and ESCs were treated with Dox at different concentrations for 2 d. Results in (Upper) qRT-PCR analysis and (Lower) RT-PCR analysis are shown. We calculated the ∆∆CT from the CT values of each gene and β-actin in qRT-PCR analysis. Leaky expression level was set to zero for S33 mutant β-catenin. For Ascl2 and Lgr5, values at Dox 0 were set as zero. The average value is shown on the log2 scale with SD. The previously reported Wnt target genes, Ascl2 and Lgr5, are not significantly affected in ESCs and MEFs by S33 mutant β-catenin expression at different levels. In all conditions, Ascl2 and Lgr5 expression is not detectable in MEFs or ESCs by RT-PCR analysis, respectively. M, marker; N.C., negative control. Related to Fig. 2.
Although the morphology and global gene expression of the Apc-rescued RTC lines were similar to those of RTCs, we found a substantial difference in the expression of a subset of genes (Fig. 2B). Notably, genes that were up-regulated by the Apc mutation in the intestine (15) were hardly affected in RTCs with the mutation. Conversely, genes that were up-regulated by the Apc mutation in RTCs were not affected in intestinal cells with the mutation (Fig. 2B). Of particular note, the majority of up- and down-regulated genes did not overlap in the two different cell types (Fig. 2C).
Given that the Apc mutation exerts tumorigenic activity through the activation of β-catenin/Tcf–mediated transcription in the intestine, we compared genes that were affected by the Apc mutation in the RTCs and genes that were affected by the induction of β-catenin in ESCs. For this purpose, we induced a stabilized form of human β-catenin (S33 mutant) in ESCs (16) and examined their gene expression. Microarray analyses revealed that the set of genes up-regulated by the Apc mutation in RTCs was substantially different from the genes that were affected by ectopic induction of the mutant β-catenin in ESCs, whereas the target genes of the Apc mutation and the mutant β-catenin overexpression often overlap in the intestine (Fig. 2D). We further examined the effects of the induction of mutant β-catenin on gene expression in different cell types. We first confirmed that the previously reported target genes of the canonical Wnt pathway are often up-regulated by mutant β-catenin induction in the colonic epithelium. However, these Wnt target genes were hardly affected in ESCs and differentially regulated in mouse embryonic fibroblasts (MEFs) by the induction of mutant β-catenin (Fig. 2E and Fig. S2). A previous study showed that different levels of canonical Wnt signaling affect differentiation propensity of ESCs (17). Although the induction levels of mutant β-catenin did not affect the expression of Ascl2 and Lgr5, well-known Wnt target genes, in either MEFs or ESCs (Fig. S2D), we cannot exclude the possibility that a dose-dependent effect may have a role in the different preferences of target gene expression. Taken together, these results indicate that the Apc mutation has remarkably distinct effects on gene regulation, which depend on the cellular context.
RTCs Lack the Ability to Form Teratomas but Exhibit the Propensity to Differentiate Along the Trophectoderm Cell Lineage.
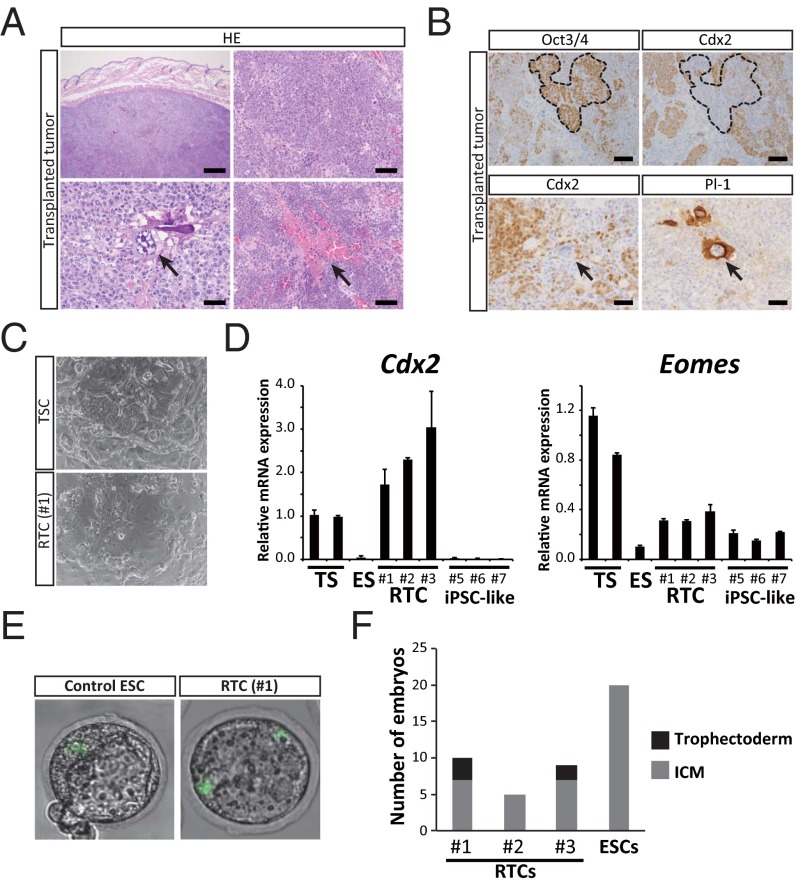
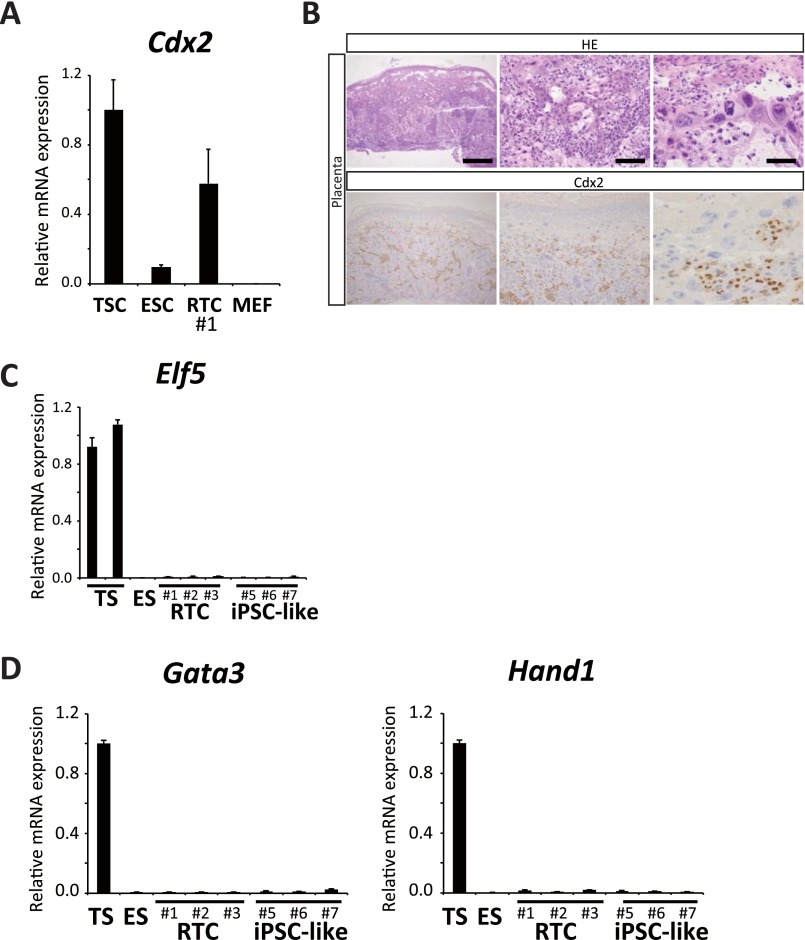
Given that the morphology and overall gene expression profiles of RTCs are similar to those of PSCs, we performed a teratoma assay and evaluated the differentiation propensity of RTCs. However, the tumors that developed in immunocompromised mice were distinct from teratomas and mainly consisted of histologically undifferentiated cells, implying that RTCs lacked pluripotency (Fig. 3A). Notably, we found that the expression of Cdx2 is up-regulated in RTCs (Fig. 2B and Fig. S3A), whereas it is often down-regulated in tumors of the colon (18, 19). A previous study showed that the overexpression of Cdx2 in mouse ESCs is sufficient to generate proper trophoblast stem cells (TSCs), the precursors of the differentiated cells of the placenta (20). We, therefore, hypothesized that RTCs might have the propensity to differentiate into trophectoderm cells. Indeed, the RTC-derived tumors contained a small number of giant cells, which resembled trophoblast giant cells that are terminally differentiated, polyploid cells in the placenta (Fig. 3A). Some of these giant cells were positive for placental lactogen 1 (Pl1), a marker for trophoblast giant cells in the mouse placenta (Fig. 3B), suggesting that the differentiation of RTCs was biased toward the trophectoderm cell lineage. Despite the undifferentiated morphology, the RTC-derived tumor cells often expressed Cdx2 protein, and this expression was reciprocal to the expression of Oct3/4, which was reminiscent of early embryonic development (Fig. 3B) (20). Moreover, Pl1-positive giant cells were often surrounded by Cdx2-positive tumor cells (Fig. 3B), which resemble the expression patterns that are observed in the mouse placenta (Fig. S3B).
Fig. 3.
RTCs lack the ability of teratoma formation but exhibit a biased differentiation propensity. (A) The histology of RTC-derived tumors developed after inoculation into s.c. tissue of nude mice. The tumors consist of mainly histologically undifferentiated cells (Upper), with a small number of giant cells that resemble trophoblast giant cells (Lower Left; arrow). Multiple hemorrhagic foci are observed in the tumors (Lower Right; arrow). (Scale bars: Upper Left, 500 μm; Upper Right and Lower Right, 200 μm; Lower Left, 50 μm.) (B) Immunohistochemistry for the RTC-derived tumors. The histologically undifferentiated cells often express Cdx2 (Upper Right), and this expression is often reciprocal with Oct3/4 expression (Upper Left; the dashed outline indicates the area containing Oct3/4-expressing cells, which lack Cdx2 expression). Some trophoblast giant cell-like cells are positive for Pl1 (Lower Right; arrow) and often surrounded by Cdx2-positive tumor cells (Lower Left; arrow indicates a trophoblast giant cell-like cell). (Scale bars: Upper, 200 μm; Lower, 50 μm.) (C) Morphology of RTCs cultured in TSC medium. RTCs change their morphology into epithelium-like cells and giant cells, which is reminiscent of TSCs. (D) qRT-PCR analysis for Cdx2 and Eomes in TSCs, ESCs, RTCs (nos. 1–3), and iPSC-like cells (ApcMin/+). ESCs, RTCs, and iPSC-like cells were cultured with TSC medium for 3 d. Data are presented as the mean ± SD. The mean expression level of TSCs was set at one. (E) Representative images of embryos after injection of EGFP-labeled ESCs and RTCs (no. 1). (F) A summary of the localization of EGFP-positive cells.
Fig. S3.
(A) qRT-PCR analysis for Cdx2 expression in TSCs, ESCs, RTCs (no. 1), and MEFs. Data are presented as the mean ± SD. The expression level of TSCs was set to one. (B) Histology and immunohistochemistry of normal mouse placenta. Cdx2-positive cells were present in normal mouse placenta, and they surrounded trophoblast giant cells. (Scale bars: Left, 500 μm; Center, 100 μm; Right, 50 μm.) (C) qRT-PCR analysis for Elf5 in TSCs, ESCs, RTCs (nos. 1–3), and iPSC-like cells (nos. 5–7: ApcMin/+). ESCs, RTCs, and iPSC-like cells were cultured with TSC medium for 3 d. Data are presented as the mean ± SD. The mean expression level of TSCs was set to one. (D) qRT-PCR analysis for Gata3 and Hand1 in TSCs, ESCs, RTCs (nos. 1–3), and iPSC-like cells (nos. 5–7: ApcMin/+). Cells were cultivated in the TSC differentiation medium for 72 h. Data are presented as the mean ± SD. The expression level of TSCs was set to one. Related to Fig. 3.
We next cultured RTCs in vitro under the TSC culture conditions. Morphologically, the RTCs changed into epithelium-like cells, which include giant cells (Fig. 3C). qRT-PCR showed the increased expression of Cdx2 and Eomes in RTCs, both of which are important for the determination and maintenance of TSCs (Fig. 3D) (21). However, the expression of Elf5 was not up-regulated in these cells (Fig. S3C). Similarly, we did not observe an increased expression of trophectoderm differentiation markers, such as Gata3 and Hand1, after cultivation in TSC differentiation medium for 72 h (Fig. S3D). These results indicate that RTCs are not pluripotent; rather, it suggests that they have a biased but limited potential for differentiation into the trophectoderm cell lineage. To examine whether RTCs contribute to the trophectoderm cell lineage in vivo, we injected EGFP-labeled RTCs into the perivitelline space of eight-cell stage embryos and examined the distribution of EGFP-positive cells at the blastocyst stage. As reported previously, control ESCs exclusively contributed to the inner cell mass (ICM) region but failed to contribute to the trophectoderm layer (Fig. 3E). In contrast, we observed EGFP signals in the trophectoderm cell layer after injection of EGFP-labeled RTCs, albeit at a low frequency (Fig. 3 E and F), indicating that a subset of RTCs is indeed able to incorporate into the trophectoderm cell layer in vivo. Although we also observed EGFP signals in the ICM regions of some blastocysts, we never observed RTC-derived cells in the resulting embryonic day (E)11.5–E14.5 embryos, further supporting the notion that RTCs lack pluripotency.
Loss of the Apc Gene Is Responsible for Increased Expression of Cdx2 and Biased Differentiation of RTCs.
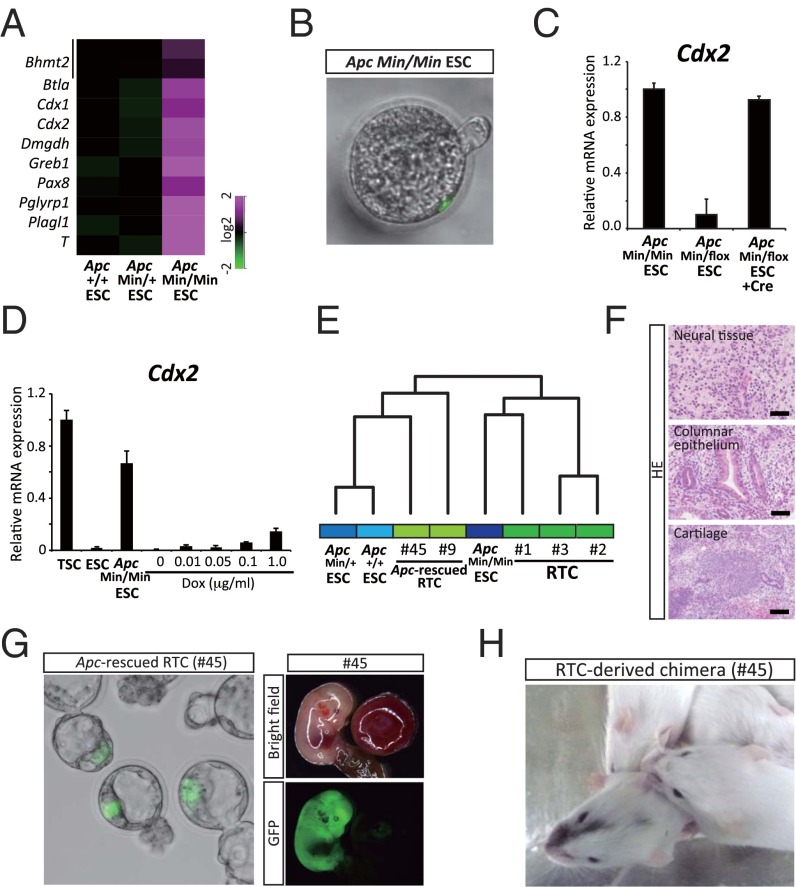
To examine the role of the Apc mutation on the biased differentiation of RTCs, we established ApcMin/Min ESCs and analyzed the gene expression and differentiation propensity. Genes up-regulated by the Apc mutations in RTCs, including Cdx2, were similarly affected in the ApcMin/Min ESCs compared with ApcMin/+ or Apc+/+ ESCs (Fig. 4A). Moreover, the ApcMin/Min ESCs occasionally incorporated into the trophectoderm layer of blastocysts after injection into eight-cell stage embryos (Fig. 4B).
Fig. 4.
Genetic rescue of the Apc gene confers pluripotency on RTC. (A) Up-regulated genes by Apc mutation in RTCs were similarly affected in ApcMin/Min ESCs compared with those in ApcMin/+ or Apc+/+ ESCs. (B) Representative images of a blastocyst after the injection of ApcMin/Min ESCs. (C) qRT-PCR analysis of Cdx2 in ApcMin/Min ESCs. After rescue of the Apc gene, ESCs decrease Cdx2 expression, whereas redisruption of the Apc gene with Cre recombinase causes up-regulation of Cdx2. (D) qRT-PCR analysis of the Cdx2 expression in TSCs, ESCs, ApcMin/Min ESCs, and ESCs with Dox-inducible alleles for mutant β-catenin. ESCs expressing mutant β-catenin for 14 d show a slight up-regulation of Cdx2; however, the expression levels are far less than those in ApcMin/Min ESCs. Data are presented as the mean ± SD. The expression level of TSCs was set at one. (E) A hierarchical cluster analysis using microarray data. (F) Genetic rescue of the Apc gene leads to the acquisition of pluripotency in RTCs. Apc-rescued RTCs (no. 45) form teratoma containing various differentiated cells, including neuronal cells, chondrocytes, and columnar epithelium. (Scale bars: 50 μm.) (G) EGFP-labeled Apc-rescued RTCs were injected into eight-cell stage embryos. (Left) Apc-rescued RTCs lose the biased differentiation propensity to trophectoderm cell lineage and contribute exclusively to the ICM region. (Right) EGFP signals are observed exclusively in the embryo and are not observed in the placenta. (H) Adult chimeric mice derived from Apc-rescued RTCs (no. 45).
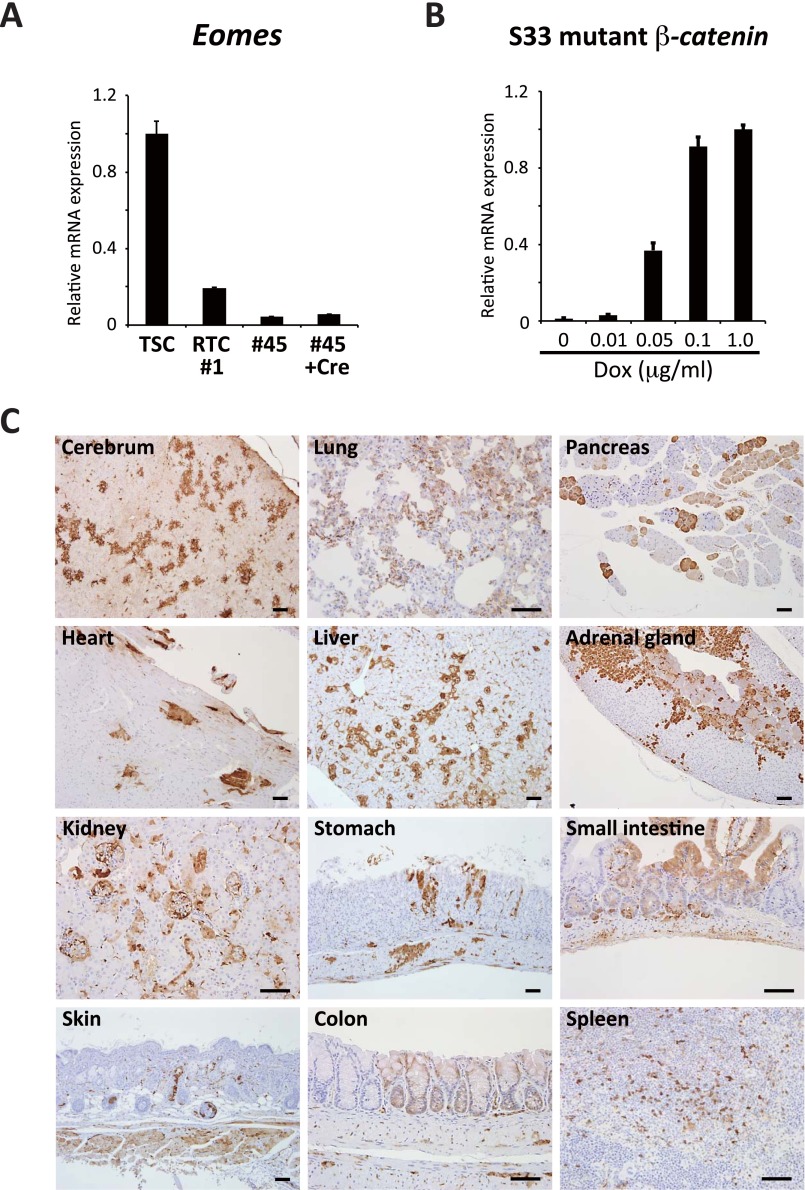
Notably, the expression levels of Cdx2 and Eomes were decreased in ApcMin/flox ESCs after the genetic rescue of the Apc mutation, affirming that the Apc mutation does indeed cause the increased expression of Cdx2 in ESCs (Fig. 4C and Fig. S4A). This finding was further confirmed by an increased expression of Cdx2 on redisruption of the rescued Apc gene in ESCs (Figs. 4C and 5A, redisruption of the rescued Apc allele is described). We also examined the effect of inducing a stabilized form of β-catenin in ESCs. Although the 2 wk of mutant β-catenin induction led to a slight up-regulation of Cdx2, the level remained far lower than that observed in ApcMin/Min ESCs (Fig. 4D and Fig. S4B), suggesting that the induction of mutant β-catenin is insufficient to cause increased expression of Cdx2 in ApcMin/Min ESCs. A clustering analysis of global gene expression revealed that RTCs exhibit similar expression patterns to ApcMin/Min ESCs, whereas Apc-rescued RTCs clustered with the control ESCs (Fig. 4E), suggesting that the altered gene expression patterns in RTCs are largely attributable to loss of the Apc gene.
Fig. S4.
(A) qRT-PCR analysis for Eomes in TSCs, RTCs (no. 1), Apc-rescued RTCs (no. 45), and Cre-expressing no. 45. Apc-rescued RTCs showed decreased expression of Eomes compared with RTCs. The reduction was slightly recovered by redisruption of the Apc allele. Data are presented as the mean ± SD. The expression level of TSCs was set to one. (B) qRT-PCR revealed Dox concentration-dependent induction of S33 mutant β-catenin. Data are presented as the mean ± SD. The expression level of Dox 1.0 was set to one. (C) Contribution of RTCs to various organs in the chimeric mice. RTCs (45) were labeled with CAG-GFP piggyBac vector before injection into blastocysts in this experiment. Related to Fig. 4. (Scale bars: 50 μm.)
Fig. 5.
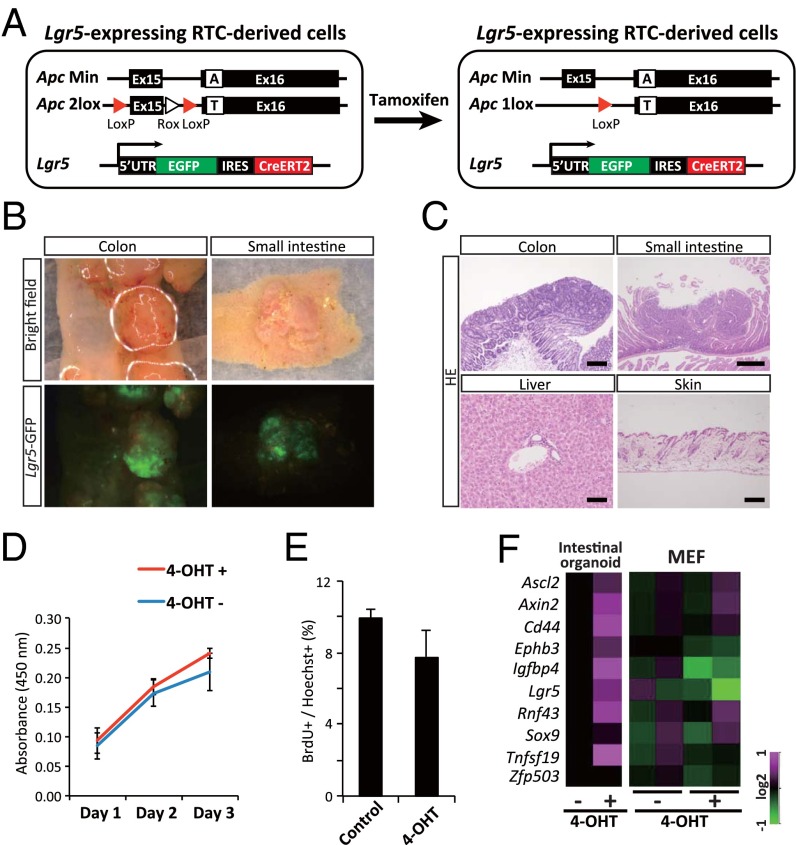
Cell type-specific consequences of redisruption of the rescued Apc gene in vivo. (A) A schematic drawing of redisruption of the rescued Apc allele in Lgr5-expressing RTC-derived cells. (B) Macroscopic tumors develop in the colon and the small intestine of RTC-chimeric mice after tamoxifen administration. A strong Lgr5-EGFP signal is observed in RTC-derived secondary tumors. (C) The histology of the colon, small intestine, liver, and skin of RTC-derived mice after tamoxifen administration. Although neoplastic growth is observed in the colon and small intestine, the liver and skin show no histological abnormalities. (Scale bars: Upper Left and Lower Right, 200 μm; Upper Right, 500 μm; Lower Left, 100 μm.) (D) WST8 assay for RTC (no. 45)-derived MEFs with or without 4-OHT treatment (2 μg/mL). These MEFs were infected with constitutively active ERT2creERT2-expressing retrovirus in advance. No significant difference in the growth activity was observed between the two groups. (E) The number of BrdU-positive proliferating cells did not increase in the RTC (no. 45)-derived MEFs by 4-OHT treatment in vitro. (F) Expression of the previously reported target genes of the canonical Wnt pathway in RTC-derived intestinal organoids and MEFs (no. 45-derived). Two independent experiments were performed with MEFs. Note that the target genes are up-regulated in organoids but are not up-regulated in MEFs after 4-OHT exposure.
Genetic Rescue of the Apc Gene Results in the Acquisition of Pluripotency in RTCs.
Importantly, both Apc-rescued nos. 45 and 9 RTCs formed teratomas containing various differentiated cells, including neural cells, chondrocytes, and ciliated columnar epithelia (Fig. 4F). In sharp contrast to RTCs, the Apc-rescued RTCs lost their bias toward differentiation into trophectoderm cells but contributed to the ICM region and embryos after injection into eight-cell stage embryos (Fig. 4G). Moreover, the Apc-rescued RTC lines contributed to a wide variety of organs in chimeric embryos and adult mice after blastocyst injection (Fig. 4H and Fig. S4C). Taken together, the results suggest that genetic rescue of the Apc mutation increased the plasticity of RTCs and that Apc-rescued RTCs can differentiate into the various cell types that constitute the adult mouse body.
Redisruption of the Rescued Apc Gene in RTC-Derived Differentiated Cells Leads to Neoplastic Growth in the Intestine in Vivo.
To examine the influence of the colon tumor cell genome in the context of various cell types, we disrupted the rescued Apc allele in differentiated cells in RTC-derived chimeric mice. The targeting vector used to rescue the ApcMin allele contained Exon 15, which was flanked by two LoxP sequences (Fig. 2A). Thus, the induction of Cre recombinase in these mice leads to excision of Exon 15 and redisruption of the Apc gene, resulting in the generation of a truncated Apc protein that is reminiscent of the Apc Min protein, which lacks β-catenin binding sites. We used an Lgr5-EGFP-ires-CreERT2 allele to redisrupt the rescued Apc allele in vivo (Fig. 5A) (22), because Lgr5 is expressed in the tissue stem/progenitor cells of various organs, including intestine, hair follicles, and the damaged liver (22–24).
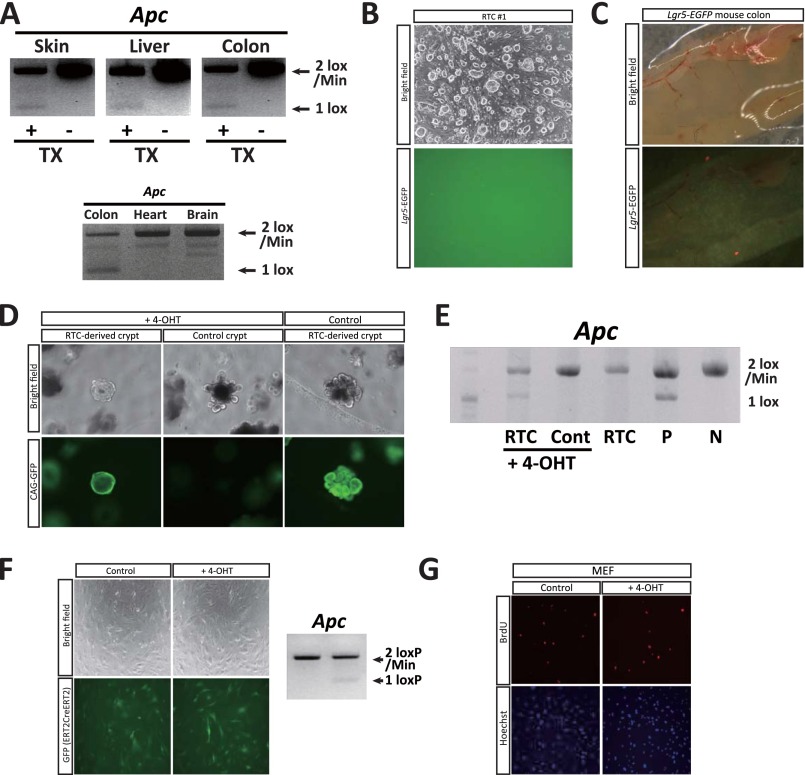
Six-wk-old RTC-derived chimeric mice were treated with tamoxifen and examined 12 wk later (n = 9). We confirmed that the LoxP-flanked sequence was deleted in organs that contained Lgr5-expressing cells (Fig. S5A). After redisruption of the Apc gene, neoplastic growth was observed in the small intestine and colon (Fig. 5 B and C), resulting in the development of macroscopic tumors. In contrast to the lack of an Lgr5-EGFP signal in the RTCs (Fig. S5B), the Lgr5-EGFP signal of the macroscopic intestinal tumors was stronger than that of the control crypts (Fig. 5B and Fig. S5C), which confirmed that the Apc mutation affected different genes in the intestinal cells and RTCs. Notably, despite the presence of the disrupted Apc gene, no pathological evidence was detected in the liver or skin (Fig. 5C and Fig. S5A), suggesting that the colon tumor cell genome can only exert neoplastic activity in specific organs in vivo.
Fig. S5.
(A) Disruption of the rescued Apc gene in vivo. Chimeric mice generated from Apc-rescued RTCs with the Lgr5-EGFP-ires-CreERT2 allele were treated with tamoxifen and analyzed after 12 wk. Faint bands were detected in the skin, liver, and colon, where Lgr5-expressing somatic stem/progenitor cells reside. Note that the one lox band was not detectable in the heart and brain of the tamoxifen-treated mouse. (B) Fluorescent image of RTC (no. 1) cultured with ESC medium. No Lgr5-EGFP signal was detected. (C) Nonchimeric control mouse with the Lgr5-EGFP-ires-CreERT2 allele showing faint EGFP signals in the colon by macroscopic examination. (D) In vitro assay of RTC-derived small intestinal crypts with the Lgr5-EGFP-ires-CreERT2 allele. RTCs (no. 45) were further labeled with CAG-GFP piggyBac vector before blastocyst injection. After exposure to 4-OHT (1 μM), intestinal organoids become cyst-like spheroids, which is reminiscent of Apc-depleted organoids. (E) Disruption of the rescued Apc allele was detected in cyst-like spheroids after 4-OHT treatment. P, positive control, N, negative control. (F) RTC (no. 45)-derived MEFs were infected with constitutively active ERT2creERT2-expressing retrovirus. Confirmation of the conditional deletion of the LoxP-flanked sequence in MEFs by the administration of 4-OHT (2 μg/mL). (G) BrdU immunofluorescent staining in an in vitro assay of RTC (no. 45)-derived MEFs. After 4-OHT exposure (2 μg/mL), the number of BrdU-positive proliferating cells was measured. Related to Fig. 5.
Cell Type-Specific Effects of the Apc Mutation in RTC-Derived Differentiated Cells in Vitro.
Our in vivo experiments suggested that RTCs lose their neoplastic activity after differentiating into other lineages. We next aimed to distinguish whether this tumor suppressive effect is caused by a cell-autonomous phenomenon or in vivo environmental factors, such as an immune response. Accordingly, we performed an in vitro assay using differentiated cells derived from Apc-rescued RTCs (45). We first performed organoid culture of the intestinal crypts from adult RTC-chimeric mice (25). After exposure to tamoxifen [4-hydroxytamoxifen (4-OHT)], intestinal organoids changed into a cyst-like structure that was reminiscent of Apc-depleted intestinal organoids (Fig. S5 D and E) (14).
We next established MEFs from the Apc-rescued RTC-derived fetus (45) and then, transduced CreERT2 in vitro. Notably, tamoxifen treatment of Apc-rescued MEFs did not lead to a higher growth activity compared with nontreated cells (Fig. 5D and Fig. S5F). Similarly, cells that incorporated BrdU were unchanged after redisruption of the Apc gene (Fig. 5E and Fig. S5G). Our results show that RTCs do not exhibit enhanced cell growth in multiple lineages (other than the intestine) in vivo and in vitro.
Consistent with cellular context-dependent effects of the Apc mutation on gene expression, target genes of the canonical Wnt pathway in the intestine (14) were not up-regulated in MEFs after treatment with tamoxifen, whereas they were up-regulated in the intestinal organoids (Fig. 5F).
The Majority of Colonic Lesions Remain in a Pretumoral Microscopic Stage in RTC-Derived Chimeric Mice.
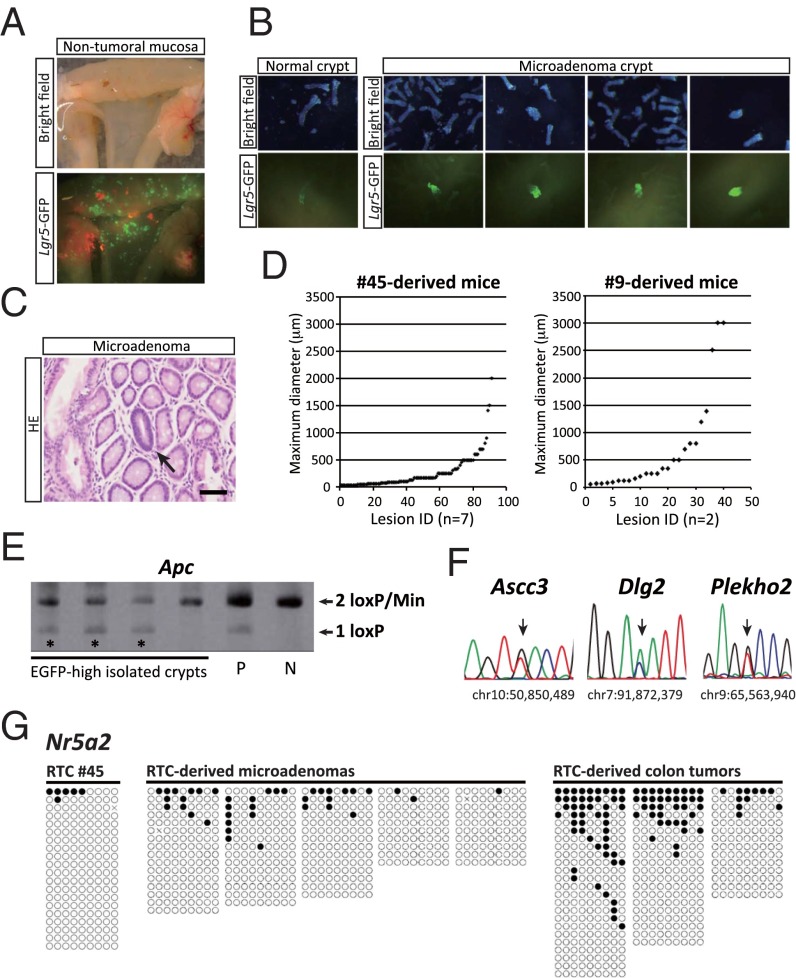
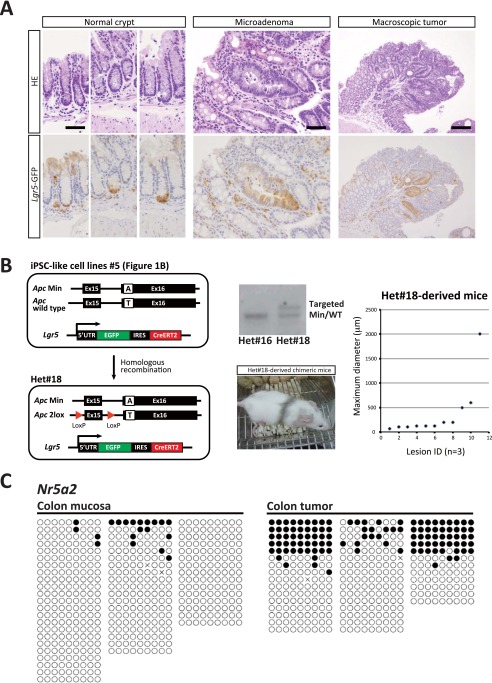
Although we observed macroscopic tumors in RTC-derived colon, we also found that the majority of colonic lesions in both nos. 45- and 9-derived chimeric mice were macroscopically invisible microadenomas, which can be identified by higher expression of the Lgr5-EGFP reporter (Fig. 6 A and B and Fig. S6A). Histological analyses revealed that the maximum diameter of microadenomas in RTC-derived mice was often smaller than 500 μm (Fig. 6 C and D). Furthermore, a majority of the colonic lesions in RTC-derived mice remained as microadenomas, even in aged mice 20 wk after the administration of tamoxifen. Notably, microadenomas harbor the redisrupted Apc gene as well as Ascc3, Dlg2, and Plekho2 mutations, indicating that these pretumoral lesions are indeed derived from RTCs (Fig. 6 E and F). We also established Apcflox/Min iPSCs (Het no. 18) from the iPSC-like cell line 5 (Fig. S6B). Control Het no. 18-derived chimeric mice similarly developed microadenomas as well as a small number of macroscopic tumors, suggesting that loss of Apc function alone phenocopies the consequences observed in RTC-derived mice. These results also suggest that the genetic aberrations of colon tumor cells are not sufficient for full-blown tumor development, which is consistent with previous findings showing that de novo DNA methylation plays a pivotal role in the transition from pretumoral microadenomas to tumors in the colon of ApcMin mice (18, 26). In agreement with this hypothesis, we confirmed that tumor-specific heterogeneous hypermethylation at Nr5a2 (27) was absent in both RTCs and RTC-derived microadenomas but present in the secondary colon tumors that arose in RTC-derived mice (Fig. 6G and Fig. S6B).
Fig. 6.
The majority of colonic lesions remain in a pretumoral microscopic stage in RTC-derived mice. (A) Macroscopic images of nontumoral flat mucosa. Note the presence of EGFP-positive crypts in RTC-derived mouse. (B) Representative images of normal crypt and microadenoma crypts in the colon. Microadenoma crypts can be identified by an increased signal intensity for Lgr5-EGFP. (C) Representative histology of pretumoral microadenoma (arrow). (Scale bar: 50 μm.) (D) Distribution of the maximum diameter of neoplastic lesions developed in RTC-derived colon after tamoxifen treatment. The majority of neoplastic lesions exhibit a pretumoral microscopic size in both nos. 45- and 9-derived mice. (E) Genomic PCR identified deletion of LoxP-flanked Exon 15 in the rescued Apc allele in the majority of microadenomas. P, positive control; N, negative control. (F) Direct sequencing for RTC-derived microadenomas. The identical genomic mutations to RTC (no. 45) were detected in microadenomas (n = 5). (G) Bisulfite sequencing analysis at the Nr5a2 locus in Apc-rescued RTCs (no. 45), RTC-derived microadenomas, and RTC-derived secondary colon tumors. Although Nr5a2 methylation level is very low in Apc-rescued RTCs and RTC-derived microadenomas, Nr5a2 is heterogeneously methylated in RTC-derived secondary colon tumors.
Fig. S6.
(A) H&E staining and immunohistochemistry of Lgr5-EGFP in normal crypts, microadenoma, and macroscopic tumor in the colon of RTC-derived mice. Although Lgr5-EGFP–positive cells were localized at the base of normal crypts, a stronger signal was observed outside the crypt base in both microadenoma and macroscopic tumor. (Scale bars: Left and Center, 50 μm; Right, 200 μm.) (B) Establishment of Apcflox/Min iPSCs (Het no. 18). Apc WT allele in iPSC-like cell line no. 5 was replaced by two lox alleles. Southern blotting confirmed recombination of the Apc allele. Het no. 18 iPSCs successfully contributed to adult chimeric mice. After 12 wk of tamoxifen treatment, colonic lesions in Het no. 18-derived mice were examined in en face sections. Note that Het no. 18-derived mice similarly developed microadenomas as well as a small number of macroscopic tumors. (C) Bisulfite sequencing analysis of Nr5a2 in normal colonic mucosa and macroscopic tumors in the colon of ApcMin/+ mice. The methylation levels in macroscopic tumors are higher than those in normal colonic mucosa. White and black circles indicate nonmethylated and methylated cytosine at CpG sites, respectively. Related to Fig. 6.
Discussion
Cell type-specific cancer development has been recognized in many organs. Although patients with familial adenomatous polyposis harbor the APC gene mutation in cells throughout their bodies, they predominantly develop colon cancer (28). These observations suggest that genetic mutations require a specific cellular context or organ-specific environment to exert cancer properties. We herein showed that a cancer-causing Apc mutation indeed has distinct, cell-autonomous effects on gene expression in different types of cells. Surprisingly, there was little overlap between intestinal cells and RTCs with regard to the genes that were affected by Apc mutation. We also showed that RTCs confer neoplastic activity after differentiation into intestinal cells (but not into other cell types) in vivo and in vitro. Taken together, our results provided experimental evidence that the biological consequences of tumor-causing mutations are substantially different depending on the cellular context (Fig. S7).
Fig. S7.
Cellular context-dependent biological consequences of Apc mutations.
The plasticity of the cancer cell genome is involved in various aspects of cancer biology, including the maintenance, progression, and recurrence of cancer cells. Pioneering studies that investigated the plasticity of the cancer cell genome used nuclear cloning experiments (29, 30). These studies showed that some cancer nuclei are competent for the initial developmental stage after nuclear transplantation. In this study, we showed that colon tumor cells can be reprogrammed into iPSC-like RTCs. However, with the exception of trophectoderm lineage cells, RTCs did not give rise to embryonic tissue, showing that the genomic information of colonic tumor cells does not allow for their differentiation into most cell lineages; rather, they harbor a biased and limited differentiation propensity. Importantly, genetic rescue of the mutated Apc gene, a driver mutation in this model, canceled this limited differentiation propensity and induced pluripotency in the RTCs, raising the possibility that the restoration of key genetic defects may confer plasticity on tumor cells. This notion is consistent with a recent study, which showed that Apc gene expression promotes the differentiation of colon tumor cells into the multiple cell types that constitute intestinal crypts/villi (14). Our results may provide an unappreciated link between oncogenic driver signals and the plasticity of cancer cells.
In summary, we showed divergent in vivo consequences of cancer-causing mutations that depend on different cellular contexts. We also showed that the majority of RTC-derived intestinal lesions are microadenomas, suggesting that macroscopic colon tumor cells are reprogrammable into pretumoral microadenoma cells. Given that epigenetic regulation plays a central role in cell type specification and cellular reprogramming, these results may underscore the significance of epigenetic regulation in interpreting the genetic information of cancer cells and the subsequent biological consequences in vivo.
Experimental Procedures
All experiments using animals were performed under the ethical guidelines of Kyoto University and approved by the Center for Induced Pluripotent Stem Cell Research and Application Animal Experiment Committee. Generation of chimeric mice, histological analysis, qRT-PCR, and microarray analysis were performed as described previously (9). The accession number for microarray data reported in this paper is GSE77202. Details on experimental procedures are provided in SI Experimental Procedures.
SI Experimental Procedures
Mice.
ApcMin/+ mice were treated with a potent tumor promoter, DSS, to promote colon tumor development (18). To reprogram the colon tumor cells using the Dox-inducible system, Dox-inducible in vivo reprogrammable mice (9) were crossed with ApcMin/+ mice. Compound transgenic mice, which have both Apc Min allele and Dox-inducible alleles [namely, an optimized reverse tetracycline-dependent transactivator (M2rtTA) at the Rosa26 locus and a polycistronic cassette encoding reprogramming factors followed by ires-mCherry at the Col1a1 locus under the tetracycline-dependent promoter (tetOP-OKMS-ires-mCherry)], were obtained. In vivo reprogrammable mice have previously been crossed with Lgr5-EGFP-ires-CreERT2 mice (22) (Jackson Laboratory) for redisruption of the rescued Apc allele in RTC/iPSC-derived Lgr5-expressing somatic cells. Thus, the established RTCs/iPSC-like cells (including nos. 45, 9, and Het no. 18) contained the Lgr5-EGFP-ires-CreERT2 allele. Apc-rescued RTCs nos. 45 and 9 were used to generate chimeric mice by injection of RTCs into eight-cell stage embryos or blastocysts. The rescued Apc gene could be mutated in Lgr5-expressing somatic stem/progenitor cells in the intestine, hair follicles, and damaged liver of chimeric mice on the administration of tamoxifen. Tamoxifen (Sigma-Aldrich) was administered via a single i.p. injection (2 mg) to mice when they were 6 wk of age to redisrupt the rescued Apc allele in RTC/iPSC-derived differentiated cells. The mice were then killed at 12 or more weeks later. All of the animal experiments were approved by the Center for iPS Cell Research and Application Animal Experiment Committee, and the care of the animals was in accordance with institutional guidelines.
Reprogramming Colon Tumor Cells.
Colon tumors developed in ApcMin/+ mice with the compound transgenic alleles were carefully resected, and tumor cells were cultured in Dox-containing (2 μg/mL) ESC medium on feeders for 14 d. Each iPSC-like colony was picked up and expanded to establish iPSC-like cell lines in the absence of Dox.
Exome and Direct Sequencing Analyses.
For exome sequencing of the seven iPSC-like cell lines, 3 μg genome was extracted with a PureLink Genomic DNA Kit (ThermoFisher Scientific). Whole-exome capture was performed with SureSelect XT (Agilent Technologies). Exome libraries were sequenced (109-bp paired end reads) using a HiSeq2500 System (Illumina). The sequenced reads were mapped to mouse reference genome (mm10) using the Burrows–Wheeler Aligner (bwa-0.7.12) after trimming adaptor sequences and low-quality bases by cutadapt-1.8.1. Properly paired reads with a mapping quality of 20 or higher were extracted using samtools-1.2, duplicate reads were marked using picard-tools-1.134 (https://broadinstitute.github.io/picard/), and local realignment was performed using the Genome Analysis Tool Kit (GATK-3.4–0) for additional analyses. Mutation calling was performed using the scripts in the Genomon-exome pipeline (genomon.hgc.jp/exome/en/index.html). We selected somatic variants by removing SNPs and indels that were reported in dbSNPs 142 build (https://www.ncbi.nlm.nih.gov/projects/SNP/) and removing the overlapping variants that were present in the V6.5, 129, or B6 exome data. Common variants that were detected in any of iPSC-like cell lines nos. 5–7 were removed to determine the RTC-specific variants. For genomic analyses of the microadenomas, total genomic DNA was extracted with a QIAamp DNA Micro Kit (QIAGEN) according to the manufacturer’s protocol. PCR was performed with primers that were designed externally to the variant sites (Table S2). The sequencing of the amplified PCR products was performed using an ABI 3500xL Genetic Analyzer (Applied Biosystems).
Array Comparative Genomic Hybridization.
Genomic DNA was extracted from RTCs with a PureLink Genomic DNA Kit. Array comparative genomic hybridization (CGH) was performed with a SurePrint G3 Mouse CGH Microarray 180k Kit (Agilent Technologies), which was used according to manufacturer’s Array-Based CGH protocol for in situ oligonucleotide DNA microarrays (version 7.1). The arrays were scanned using an Agilent Microarray Scanner (Agilent Technologies) and imaged using the Agilent Scan Control software program.
Alkaline Phosphatase Staining.
To evaluate the alkaline phosphatase (ALP) activity in RTCs, we performed ALP staining according to the manufacturer’s protocol (Muto Pure Chemicals).
RNA Preparation, qRT-PCR, and Microarray Analysis.
Total RNA of cells was isolated with the RNeasy Plus Mini Kit (QIAGEN) according to the manufacturer’s instructions. One microgram extracted total RNA was reverse transcribed with a SuperScript III First Strand Synthesis Kit (ThermoFisher Scientific). qRT-PCR analysis was performed using GoTaq qPCR Master Mix (Promega) and analyzed with a Step-One Real-Time PCR System (Life Technologies). The expression levels of target transcripts were normalized to the expression level of β-actin. Primer pairs that were used for the amplification are shown in Table S2. Microarray analysis was performed using Mouse Gene 1.0 ST Array (Affymetrix) according to the manufacturer’s instructions with 200 ng total RNA. All of the data analyses were performed using the GeneSpring GX software program (version 12; Agilent Technology). The microarray data of the following samples were obtained from the Gene Expression Omnibus database: colon tumors from GSE60620, ESCs/iPSCs from GSE45916 and GSE51786, S33 mutant β-catenin–induced colonic crypts from GSE41688, and Apc-deleted intestine from GSE70262. To compare the affected genes in a different array platform, the probe identifications in Gene430 array were translated into the identifications that were used in Gene ST1.0 array using GeneSpring software.
DNA Methylation Analysis.
DNA methylation statuses of the Oct3/4 distal enhancer, the Nanog promoter, and the DNA methylation valleys located in Nr5a2 were analyzed using bisulfite sequencing. Total DNA of ESCs, RTCs, normal colonic mucosa, and macroscopic colon tumors was extracted using a PureLink Genomic DNA Kit. Genomic DNA from RTC-derived microadenomatous crypts was extracted with the QIAamp DNA Micro Kit according to the manufacturer’s protocol. Cytosine to uracil conversion of genomic DNA was performed using an EZ DNA Methylation-Gold Kit (Zymo Research). The primers used for bisulfite sequencing are listed in Table S2. Thymine adenine (TA) cloning of the amplified PCR product was performed using the pCR4-TOPO TA Vector (ThermoFisher Scientific), and sequencing was performed with an ABI 3500xL System. The methylation analysis was conducted using the Quantification Tool for Methylation Analysis software program (quma.cdb.riken.jp/top/quma_main_j.html).
Construction of Targeting Vector, Homologous Recombination, and Southern Blotting.
To replace the Apc Min allele with a targeted allele containing the WT Apc gene sequence, we first established a targeting vector using Red/ET BAC recombination technology (Gene Bridges); 20 μg linearized targeting plasmid was transfected into RTCs (nos. 1 and 3) and one ApcMin/+ iPSC-like cell (5) by electroporation followed by cultivation with Blastcidin (20 μg/mL) for 14 d. After picking up the surviving colonies, genomic DNA was extracted from each colony with a PureLink Genomic DNA Kit. Southern blotting was performed to verify homologous recombination using the DIG System (Roche). For hybridization with 5′ external probes, genomic DNAs were digested with BglII overnight. The primers that were used to amplify the 5′ probe are shown in Table S2.
Inoculation of RTCs into Nude Mice.
Immunodeficient nude mice were s.c. injected with 1 × 10⁶ RTCs. At 3 wk after the injection, tumors were excised and histologically evaluated.
Histological Analysis, Immunohistochemistry, and Immunofluorescence.
All of the tissue samples were fixed in 4% (wt/vol) paraformaldehyde in PBS overnight. Sections (5 μm) were stained with H&E, and serial sections were used for immunohistochemical or immunofluorescent staining. The tissue sections were deparaffinized, rehydrated, and processed for antigen retrieval using a standard microwave heating technique in pH9 buffer (Nichirei). The primary antibodies, which were incubated at 4 °C overnight in blocking buffer, were mouse anti-Oct3/4 (clone 40/Oct-3; dilution 1:100; BD Transduction), rabbit anti-Cdx2 (clone EPR2764Y; dilution 1:100; ThermoFisher Scientific), rat anti-Pl1 (polyclonal; dilution 1:100; Santa Cruz), mouse anti-GFP (clone 4B10; dilution 1:100; Cell Signaling), and rabbit anti-Ki67 (clone SP6; dilution 1:100; Abcam). The sections were incubated with the appropriate species of HRP-conjugated secondary antibodies (Nichirei, Histofine) at room temperature for 30 min, and chromogen development was performed using DAB (Nichirei). The stained slides were counterstained with Meyer hematoxylin.
Culture of RTCs Under Conditions for TSCs.
TSC-conditioned medium was prepared with GMEM (Gibco) supplemented with 10% (vol/vol) FBS, 1× sodium pyruvate (Nacalai Tesque), 1× nonessential amino acids (Nacalai Tesque), 10−4 M 2-mercaptoethanol 2 mg/mL sodium heparin (Wako), and 20 ng/mL recombinant FGF4 (Sigma-Aldrich) on mitomycin-C–treated MEF feeder cells.
Injection of RTCs and ESCs into Eight-Cell Stage Embryos.
To examine the contribution to the trophectoderm cell layer in vivo, EGFP-labeled RTCs, ApcMin/Min ESCs, or control ESCs were injected into the perivitelline space of eight-cell stage embryos, and the distribution of these cells at blastocyst stage was examined.
Redisruption of the Rescued Apc Gene and Confirmation of Deletion of the LoxP-Flanked Sequence.
To redisrupt the rescued Apc gene in RTC/iPSC-derived differentiated cells in vivo, tamoxifen (2 mg) was i.p. injected into 6-wk-old RTC/iPSC-derived chimeric mice. For in vitro assay, RTC-derived intestinal organoids and MEFs were cultured with 4-OHT (1 μM for the intestinal organoids and 2 μg/mL for MEF)-containing media for 2 d.
Genomic DNA from RTC-derived tissues was extracted with a PureLink Genomic DNA Kit. Genomic DNA of a single adenomatous crypt and each RTC-derived organoid was extracted with a QIAamp DNA Micro Kit. A PCR was performed using the primers listed in Table S2.
Small Intestinal Crypt Isolation and Organoid Culture.
The proximal half of the small intestine of RTC-derived chimeric mice was removed and opened longitudinally. After scraping the villi using a coverslip, the intestine was analyzed for Lgr5-EGFP signals under a fluorescence stereomicroscope (M205FA; Leica). Segments with large numbers of EGFP-positive crypts were further selected and cut into 5-mm pieces. These pieces were washed in a conical tube by shaking on a vortex mixer for 20–30 s in 10 mL cold PBS. This procedure was repeated twice. After the supernatant was aspirated, 10 mL 30 mM EDTA (Gibco)-HBSS (Gibco) was added and incubated for 15 min at 37 °C. After the aspiration of the supernatant, 4 mL cold PBS was added and vortexed. The isolated crypts in cold PBS were collected by centrifugation at 200 × g for 3 min. The supernatant was then aspirated, and 1 mL basal culture medium [Advanced DMDM F/12 (Gibco) containing penicillin/streptomycin, 2 mM GlutaMax (Life Technologies), 10 mM Hepes] was applied. The number of crypts was calculated, and medium was spun down again. After the aspiration of the supernatant, 50 μL Growth Factor Reduced Matrigel (for 500 crypts; BD) was applied and pipetted. Fifty microliters resuspension was plated onto a prewarmed 24-well plate. After addition of Matrigel, the plate was incubated at 37 °C for 5–10 min for polymerization. Subsequently, 500 μL small intestinal organoid growth medium [Basal Media containing 50 ng/mL EGF (Gibco), 100 ng/mL Noggin (PeproTech), 500 ng/mL R-spondin (RD), 1× N2 supplement (Life Technologies), 1× B27 supplement (Life Technologies), 1 mM N-Acetylcysteine (Sigma-Aldrich)] was laid on top of Matrigel. Medium was changed every 2 d, and the organoids were passaged after 7–14 d. Growth media were removed for passaging, and Matrigel was resuspended in 500 μL to 1 mL basal medium and transferred to a 15-mL falcon tube. After gently pipetting, 10 mL basal medium was added to the tube and pipetted to fully wash cells. The cells were then centrifuged at 200 × g for 3 min, and the supernatant was aspirated. The cells were then resuspended in Matrigel and replated according to the above-mentioned procedure.
Established organoids were separated into two groups and treated with or without 4-OHT (1 μM) for 2 d to assess the effects of the redisruption of the Apc gene. Genomic DNA was extracted from each organoid to confirm the deletion of the LoxP-flanked sequence, and RNA was extracted from the bulk of the organoids [4-OHT–treated organoids, n = 12; 4-OHT(−) organoids, n = 20] to evaluate transcriptional profiles.
In Vitro Proliferation Analysis of MEFs.
MEFs were extracted from chimeric fetus (E13.5) derived from RTCs. Blastocyst-derived MEFs were removed using puromycin (1.0 μg/mL) for 7 d. The puromycin-resistant MEFs were maintained with the following media: DMEM (Nacalai Tesque) containing 10% (vol/vol) FBS, 1× l-glutamine (Nacalai Tesque), 1× nonessential amino acid (Nacalai Tesque), and Pen/Strep.
For the transduction of constitutively active CreERT2, 10 μg pMYs-ERT2CreERT2-IRES-GFP retroviral expression vector established with pMYs-IRES-GFP vector (Cell Biolabs) was transduced into Plat-E packaging cells (Cell Biolabs) with Lipofectamine 2000 (ThermoFisher Scientific). The day after confirmation of GFP signal in Plat-E cells, culture medium with polybrene (4 μg/mL) was applied on the MEFs. On the next day of viral transduction, 4-OHT (2 μg/mL)-containing medium was applied to delete LoxP-flanked sequences. MEFs were cultured for 2 more days, and the proliferative activity was evaluated by BrdU staining.
WST-8 Assay.
A WST-8 assay was performed (Dojindo Laboratories) to evaluate the cell proliferative activity of RTC-derived MEFs with or without administration of tamoxifen (4-OHT; 2 μg/mL). MEFs were cultured in a 96-well plate (3,000 cells per well) with 100 μL culture medium. On days 1, 2, and 3, 10 μL Cell Counting Kit-8 solution was added, and the plates were incubated for 2 h. OD at 450 nm was then measured.
Measurement of Neoplastic Lesions That Developed in the Colon of RTC-Derived Chimeric Mice.
To measure the number and maximum diameter of neoplastic lesions in the colon, we examined a total of 12 chimeric mice (no. 45-derived, n = 7; no. 9-derived, n = 2; Het no. 18-derived, n = 3). The colon was resected and cut open longitudinally. Each colon was then divided into three segments (the proximal colon, distal colon, and intermediate colon). En face sections were prepared for nontumoral flat mucosa as described previously (26). The maximum diameter of each lesion was microscopically determined on en face H&E-stained sections.
Microadenoma Crypt Isolation.
For analyses of microscopic microadenoma crypts in the colon of RTC-derived chimeric mice, the distal colon was resected and cut open longitudinally. Chimeric contribution was evaluated using the Lgr5-EGFP signal under a fluorescence stereomicroscope. Highly contributing segments of the flat mucosa were further resected and washed with HBSS followed by incubation with 30 mM EDTA-HBSS for 15 min at 37 °C. Samples were then placed into 4 mL HBSS in conical tubes and shaken on a vortex mixer to separate the crypt from the stromal tissues.
We found that Lgr5-EGFP signals were stronger in microadenoma crypts than in nonneoplastic crypts. Although the Lgr5-EGFP localization was limited at the base of normal crypts, a stronger signal was often observed outside this area in microadenoma crypts (Fig. S6A), which is consistent with the facts that microadenomas harbor activated canonical Wnt signaling because of the loss of Apc function and that Lgr5 is a target of this pathway. Based on the higher expression of Lgr5-EGFP, microadenoma crypts were isolated with a fluorescence stereomicroscope. Isolated Lgr5-EGFP-High crypts often harbor the one lox allele of Apc gene (Fig. 6E), affirming that these crypts are microadenomas. Isolated crypts with Apc LOH were used for DNA methylation and sequencing analyses.
Acknowledgments
We thank S. Nishikawa for helpful discussions; P. Karagiannis for critical reading of this manuscript; and T. Ukai, K. Yamada, W. Grove, M. Takemoto, M. Kabata, T. Sato, and K. Osugi for technical assistance. We were supported, in part, by P-CREATE, a Grant-in-Aid from the Ministry of Education, Culture, Sports, Science, and Technology of Japan; the Strategic International Collaborative Research Program (SICORP); the Takeda Science Foundation; and the Naito Foundation.
Footnotes
The authors declare no conflict of interest.
This article is a PNAS Direct Submission.
Data deposition: The microarray data reported in this paper have been deposited in the Gene Expression Omnibus (GEO) database, www.ncbi.nlm.nih.gov/geo (accession no. GSE77202).
This article contains supporting information online at www.pnas.org/lookup/suppl/doi:10.1073/pnas.1614197114/-/DCSupplemental.
References
- 1.Dimas AS, et al. Common regulatory variation impacts gene expression in a cell type-dependent manner. Science. 2009;325(5945):1246–1250. doi: 10.1126/science.1174148. [DOI] [PMC free article] [PubMed] [Google Scholar]
- 2.Hnisz D, et al. Super-enhancers in the control of cell identity and disease. Cell. 2013;155(4):934–947. doi: 10.1016/j.cell.2013.09.053. [DOI] [PMC free article] [PubMed] [Google Scholar]
- 3.Takahashi K, Yamanaka S. Induction of pluripotent stem cells from mouse embryonic and adult fibroblast cultures by defined factors. Cell. 2006;126(4):663–676. doi: 10.1016/j.cell.2006.07.024. [DOI] [PubMed] [Google Scholar]
- 4.Bodmer WF, et al. Localization of the gene for familial adenomatous polyposis on chromosome 5. Nature. 1987;328(6131):614–616. doi: 10.1038/328614a0. [DOI] [PubMed] [Google Scholar]
- 5.Solomon E, et al. Chromosome 5 allele loss in human colorectal carcinomas. Nature. 1987;328(6131):616–619. doi: 10.1038/328616a0. [DOI] [PubMed] [Google Scholar]
- 6.Korinek V, et al. Constitutive transcriptional activation by a beta-catenin-Tcf complex in APC-/- colon carcinoma. Science. 1997;275(5307):1784–1787. doi: 10.1126/science.275.5307.1784. [DOI] [PubMed] [Google Scholar]
- 7.Morin PJ, et al. Activation of beta-catenin-Tcf signaling in colon cancer by mutations in beta-catenin or APC. Science. 1997;275(5307):1787–1790. doi: 10.1126/science.275.5307.1787. [DOI] [PubMed] [Google Scholar]
- 8.Harada N, et al. Intestinal polyposis in mice with a dominant stable mutation of the beta-catenin gene. EMBO J. 1999;18(21):5931–5942. doi: 10.1093/emboj/18.21.5931. [DOI] [PMC free article] [PubMed] [Google Scholar]
- 9.Ohnishi K, et al. Premature termination of reprogramming in vivo leads to cancer development through altered epigenetic regulation. Cell. 2014;156(4):663–677. doi: 10.1016/j.cell.2014.01.005. [DOI] [PubMed] [Google Scholar]
- 10.Su LK, et al. Multiple intestinal neoplasia caused by a mutation in the murine homolog of the APC gene. Science. 1992;256(5057):668–670. doi: 10.1126/science.1350108. [DOI] [PubMed] [Google Scholar]
- 11.Haigis KM, Caya JG, Reichelderfer M, Dove WF. Intestinal adenomas can develop with a stable karyotype and stable microsatellites. Proc Natl Acad Sci USA. 2002;99(13):8927–8931. doi: 10.1073/pnas.132275099. [DOI] [PMC free article] [PubMed] [Google Scholar]
- 12.Kim J, et al. A Myc network accounts for similarities between embryonic stem and cancer cell transcription programs. Cell. 2010;143(2):313–324. doi: 10.1016/j.cell.2010.09.010. [DOI] [PMC free article] [PubMed] [Google Scholar]
- 13.Sansom OJ, et al. Loss of Apc in vivo immediately perturbs Wnt signaling, differentiation, and migration. Genes Dev. 2004;18(12):1385–1390. doi: 10.1101/gad.287404. [DOI] [PMC free article] [PubMed] [Google Scholar]
- 14.Dow LE, et al. Apc restoration promotes cellular differentiation and reestablishes crypt homeostasis in colorectal cancer. Cell. 2015;161(7):1539–1552. doi: 10.1016/j.cell.2015.05.033. [DOI] [PMC free article] [PubMed] [Google Scholar]
- 15.Reed KR, et al. A limited role for p53 in modulating the immediate phenotype of Apc loss in the intestine. BMC Cancer. 2008;8:162. doi: 10.1186/1471-2407-8-162. [DOI] [PMC free article] [PubMed] [Google Scholar]
- 16.Hirata A, et al. Dose-dependent roles for canonical Wnt signalling in de novo crypt formation and cell cycle properties of the colonic epithelium. Development. 2013;140(1):66–75. doi: 10.1242/dev.084103. [DOI] [PMC free article] [PubMed] [Google Scholar]
- 17.Kielman MF, et al. Apc modulates embryonic stem-cell differentiation by controlling the dosage of beta-catenin signaling. Nat Genet. 2002;32(4):594–605. doi: 10.1038/ng1045. [DOI] [PubMed] [Google Scholar]
- 18.Hatano Y, et al. Reducing DNA methylation suppresses colon carcinogenesis by inducing tumor cell differentiation. Carcinogenesis. 2015;36(7):719–729. doi: 10.1093/carcin/bgv060. [DOI] [PubMed] [Google Scholar]
- 19.Bonhomme C, et al. The Cdx2 homeobox gene has a tumour suppressor function in the distal colon in addition to a homeotic role during gut development. Gut. 2003;52(10):1465–1471. doi: 10.1136/gut.52.10.1465. [DOI] [PMC free article] [PubMed] [Google Scholar]
- 20.Niwa H, et al. Interaction between Oct3/4 and Cdx2 determines trophectoderm differentiation. Cell. 2005;123(5):917–929. doi: 10.1016/j.cell.2005.08.040. [DOI] [PubMed] [Google Scholar]
- 21.Rossant J, Cross JC. Placental development: Lessons from mouse mutants. Nat Rev Genet. 2001;2(7):538–548. doi: 10.1038/35080570. [DOI] [PubMed] [Google Scholar]
- 22.Barker N, et al. Identification of stem cells in small intestine and colon by marker gene Lgr5. Nature. 2007;449(7165):1003–1007. doi: 10.1038/nature06196. [DOI] [PubMed] [Google Scholar]
- 23.Jaks V, et al. Lgr5 marks cycling, yet long-lived, hair follicle stem cells. Nat Genet. 2008;40(11):1291–1299. doi: 10.1038/ng.239. [DOI] [PubMed] [Google Scholar]
- 24.Huch M, et al. In vitro expansion of single Lgr5+ liver stem cells induced by Wnt-driven regeneration. Nature. 2013;494(7436):247–250. doi: 10.1038/nature11826. [DOI] [PMC free article] [PubMed] [Google Scholar]
- 25.Sato T, et al. Single Lgr5 stem cells build crypt-villus structures in vitro without a mesenchymal niche. Nature. 2009;459(7244):262–265. doi: 10.1038/nature07935. [DOI] [PubMed] [Google Scholar]
- 26.Yamada Y, et al. Opposing effects of DNA hypomethylation on intestinal and liver carcinogenesis. Proc Natl Acad Sci USA. 2005;102(38):13580–13585. doi: 10.1073/pnas.0506612102. [DOI] [PMC free article] [PubMed] [Google Scholar]
- 27.Abu-Remaileh M, et al. Chronic inflammation induces a novel epigenetic program that is conserved in intestinal adenomas and in colorectal cancer. Cancer Res. 2015;75(10):2120–2130. doi: 10.1158/0008-5472.CAN-14-3295. [DOI] [PubMed] [Google Scholar]
- 28.Vasen HF, et al. Guidelines for the clinical management of familial adenomatous polyposis (FAP) Gut. 2008;57(5):704–713. doi: 10.1136/gut.2007.136127. [DOI] [PubMed] [Google Scholar]
- 29.Hochedlinger K, et al. Reprogramming of a melanoma genome by nuclear transplantation. Genes Dev. 2004;18(15):1875–1885. doi: 10.1101/gad.1213504. [DOI] [PMC free article] [PubMed] [Google Scholar]
- 30.Blelloch RH, et al. Nuclear cloning of embryonal carcinoma cells. Proc Natl Acad Sci USA. 2004;101(39):13985–13990. doi: 10.1073/pnas.0405015101. [DOI] [PMC free article] [PubMed] [Google Scholar]


