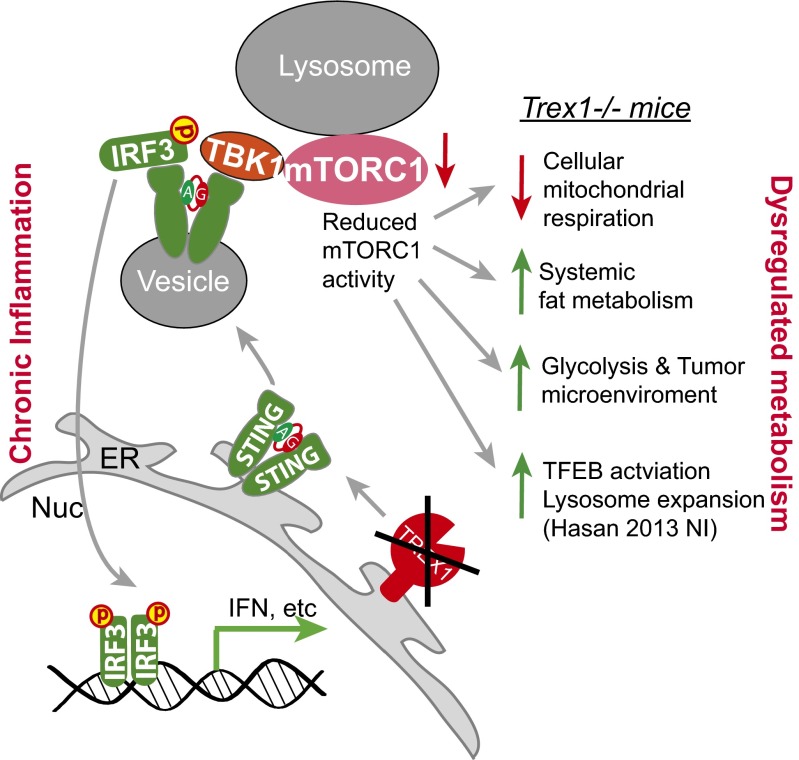
Significance
Patients with chronic autoimmune and autoinflammatory diseases often also present metabolic phenotypes. The molecular connection between inflammation and metabolism is incompletely understood. We describe a mouse model, three-prime repair exonuclease 1 knockout, that presents both chronic systemic inflammation and metabolic dysregulation. We genetically separated the inflammation and metabolic phenotypes and biochemically identified TANK-binding kinase 1 (TBK1) as a key regulator of mammalian target of rapamycin complex 1, a master regulator of metabolism. Chronically activated TBK1 and interferon signaling are associated with many autoimmune diseases, including systemic lupus erythematosus. Our study provides a mechanism by which the innate immune signaling pathways regulate cellular metabolism.
Keywords: TREX1, TBK1, mTORC1, innate immunity, metabolism
Abstract
Three-prime repair exonuclease 1 knockout (Trex1−/−) mice suffer from systemic inflammation caused largely by chronic activation of the cyclic GMP-AMP synthase–stimulator of interferon genes–TANK-binding kinase–interferon regulatory factor 3 (cGAS–STING–TBK1–IRF3) signaling pathway. We showed previously that Trex1-deficient cells have reduced mammalian target of rapamycin complex 1 (mTORC1) activity, although the underlying mechanism is unclear. Here, we performed detailed metabolic analysis in Trex1−/− mice and cells that revealed both cellular and systemic metabolic defects, including reduced mitochondrial respiration and increased glycolysis, energy expenditure, and fat metabolism. We also genetically separated the inflammatory and metabolic phenotypes by showing that Sting deficiency rescued both inflammatory and metabolic phenotypes, whereas Irf3 deficiency only rescued inflammation on the Trex1−/− background, and many metabolic defects persist in Trex1−/−Irf3−/− cells and mice. We also showed that Leptin deficiency (ob/ob) increased lipogenesis and prolonged survival of Trex1−/− mice without dampening inflammation. Mechanistically, we identified TBK1 as a key regulator of mTORC1 activity in Trex1−/− cells. Together, our data demonstrate that chronic innate immune activation of TBK1 suppresses mTORC1 activity, leading to dysregulated cellular metabolism.
Mammals have evolved complex and integrated systems of immunity and metabolism to maintain and defend internal and environmental threats. Increasing numbers of immune regulators have been found to play critical roles in metabolism. Studies from recent years have established an integrated view on the shared architecture between adaptive immunity and metabolism, including how they correspond to stimulus in disease settings. However, cell-intrinsic innate immune regulation of metabolic pathways remains poorly understood. This is in part due to the fact that overwhelming systemic inflammation in chronic diseases often masks direct underlying molecular causes.
We have previously characterized an autoimmune/autoinflammatory disease mouse model, three-prime repair exonuclease 1 knockout (Trex1−/−) (1). TREX1, also known as DNase III, is an exonuclease that localizes to the endoplasmic reticulum (ER) to prevent aberrant accumulation of self-DNA or glycans that would trigger immune activation (2, 3). Mutations of the TREX1 gene have been associated with several autoinflammatory and autoimmune diseases, including Aicardi–Goutières syndrome and systemic lupus erythematosus (SLE) (4). Trex1−/− mice suffer from systemic inflammation caused largely by chronic activation of the cytosolic DNA sensing pathway through the cyclic GMP-AMP synthase–stimulator of interferon genes–TANK-binding kinase–interferon regulatory factor 3 (cGAS–STING–TBK1–IRF3) cascade (5–7). We showed previously that TREX1 also regulates lysosomal biogenesis through the mTORC1–TFEB pathway and that Trex1−/− mouse embryonic fibroblasts (MEFs) exhibit drastically reduced mTORC1 activity compared with WT cells (1). The molecular mechanism leading to suppression of mTORC1 activity remains unknown.
Here, we show that mTORC1 activity is reduced in multiple Trex1−/− mouse tissues and TREX1 mutant human cells. We also show that Trex1−/− mice exhibit many metabolic-dysregulation phenotypes consistent with chronically reduced mTORC1 activity, including reduced cellular mitochondrial respiration and increased in vivo energy expenditure and fat metabolism, leading to reduced adiposity and survival. We genetically separated inflammation and metabolic defects and demonstrate that metabolic dysregulation in Trex1−/− mice is caused by innate immune activation of TBK1, but not the downstream IRF3 signaling and inflammation, and that TBK1 binds to the mTORC1 complex and inhibits its activity in Trex1−/− cells. Our data thus establish TBK1–mTORC1 as an important regulatory axis between cell-intrinsic immune signaling and metabolism.
Results
Reduced mTORC1 Activity and Cellular Metabolism in Trex1−/− Cells and Tissues.
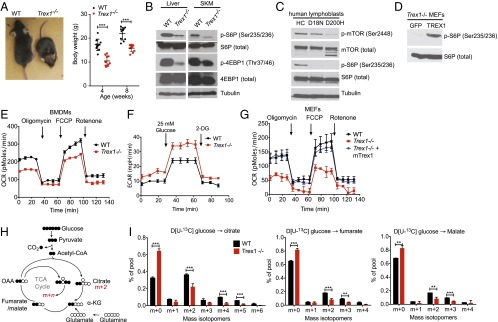
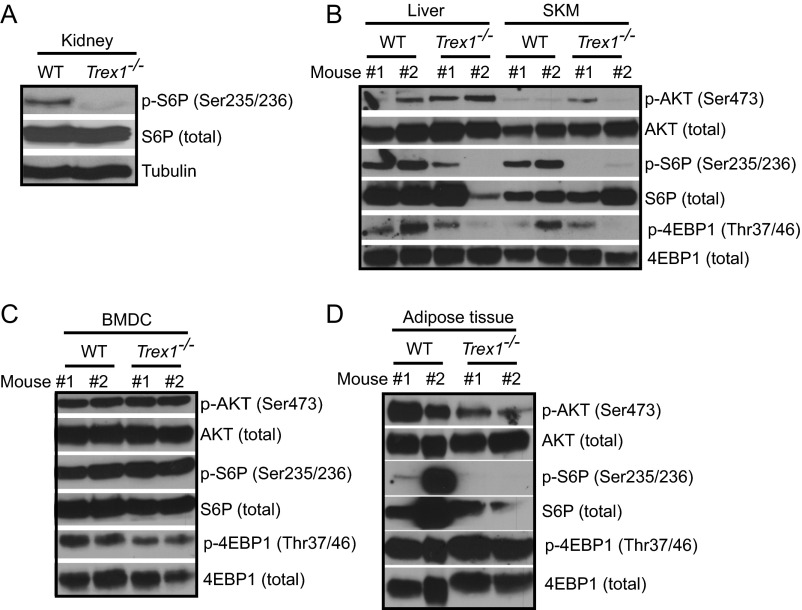
Recently, we showed that Trex1−/− cells have reduced mTORC1 activity, but the underlying mechanism is unclear (1). Trex1−/− mice also display reduced body size and weight that resembles reduced mTORC1 function as in S6K−/− or Raptor conditional knockout mice (8, 9) (Fig. 1A). To extend our earlier in vitro findings, we first evaluated the mTORC1 activity in tissues of Trex1−/− mice. We observed clear reduction in mTORC1 activity (measured by S6P and 4EBP phosphorylation) in the liver, skeletal muscles, and kidney of Trex1−/− mice (Fig. 1B and Fig. S1 A and B). Interestingly, AKT phosphorylation is unchanged in Trex1−/− tissues where mTORC1 activity is clearly reduced, indicating that mTORC1 is regulated independent of AKT in these tissues (Fig. S1B). We observed some reduction of 4E–BP phosphorylation in Trex1−/− bone marrow-derived dendritic cells (BMDCs), and in adipose tissue, we observed both reduced mTORC1 activity and AKT phosphorylation (Fig. S1 C and D). We also measured mTORC1 activity in TREX1 mutant human patient lymphoblasts. Both D18N and D200H mutations disrupt TREX1 DNase activity and activate DNA-mediated innate immune activation. We observed reduced mTORC1 activity in both TREX1 mutant human patient cells (Fig. 1C).
Fig. 1.
Reduced mTORC1 activity and defective mitochondrial respiration in Trex1−/− cells and tissues. (A) Representative images of WT and Trex1−/− mice at the age of 6–8 wk. Body weight was measured at 8 wk (n = 10). (B) Immunoblot analysis of phosphorylated and total S6P and 4E-BP1 in WT and Trex1−/− mouse tissues. (C) Immunoblot analysis of phosphorylated and total mTOR and S6P in healthy control (HC) and TREX1-D18N and TREX1-D200H mutant patient lymphoblasts. (D) Immunoblot analysis of phosphorylated and total S6P in Trex1−/− MEFs reconstituted with GFP (control) or mouse TREX1. (E–G) Real-time changes in the OCR and ECAR of WT or Trex1−/− BMDMs (E and F) or MEFs (G). OCR was assessed during subsequent sequential treatment with oligomycin (inhibitor of ATP synthase), FCCP (carbonyl cyanide 4-(trifluoromethoxy) phenylhydrazone), and rotenone (inhibitors of the electron-transport chain). ECAR was assessed during sequential treatment with 25 mM glucose and 2-deoxyglucose (2-DG). (H) Schematic representation of metabolism of [U-13C]glucose for experiments in G. (I) Mass isotopomer analysis of citrate, fumarate, and malate in cells cultured with [U-13C]glucose and unlabeled glutamine. Data are presented as the means ± SEM of quadruplets of two to three independent experiments. *P < 0.05; **P < 0.01; ***P < 0.001 (Student’s t test).
Fig. S1.
Reduced mTORC1 activity in Trex1−/− mouse tissues. Immunoblot analysis of phosphorylated and total S6P, 4E-BP1, and AKT in WT and Trex1−/− mouse kidney (A), liver and skeletal muscle (SKM) (B), BMDCs (C), and adipose tissues (D).
We next asked whether reexpressing TREX1 can restore mTORC1 activity in Trex1−/− cells. We stably reconstituted Trex1−/− MEFs with retroviral constructs expressing WT mouse TREX1, which restored mTORC1 activity (Fig. 1D), suggesting that lack of TREX1 protein or subsequent immune signaling pathways activated by Trex1 deficiency are responsible for mTORC1 suppression.
mTORC1 is known to regulate mitochondrial function (10). To explore whether the chronic suppression of mTORC1 activity in Trex1−/− cells is associated with defects in cellular metabolism, we analyzed the oxygen consumption rate (OCR), which is an indicator of mitochondrial respiration. Indeed, we observed drastically reduced mitochondrial respiration in Trex1−/− MEFs and bone marrow-derived macrophages (BMDMs) compared with WT cells (Fig. 1E). We also observed increased glycolysis in Trex1−/− cells measured by extracellular acidification rate (ECAR) (Fig. 1F). The mitochondrial-respiration defect in Trex1−/− MEFs was completely restored by reexpressing WT TREX1 (Fig. 1G). To confirm the mitochondrial defect and pinpoint the specific step(s) of cellular metabolism that might be affected by Trex1−/−, we performed 13C isotope tracing to determine the fate of glucose-derived carbon (11). After culturing with [U-13C]glucose, the unlabeled fraction of citrate (m+0) was significantly increased in Trex1−/− cells compared with WT, whereas the fraction of labeled citrate arising from 13C entry into and progression around the TCA cycle (m+2, m+4, and m+5) was significantly decreased (Fig. 1 H and I). Together, these data suggest that reduced mitochondrial respiration observed in Trex1−/− cells is likely caused by a defect in the delivery of glucose-derived carbon to the mitochondria for oxidation.
Cellular Metabolic Defect Associated with Trex1 Deficiency Is Dependent on STING but Independent of IRF3 and Inflammation.
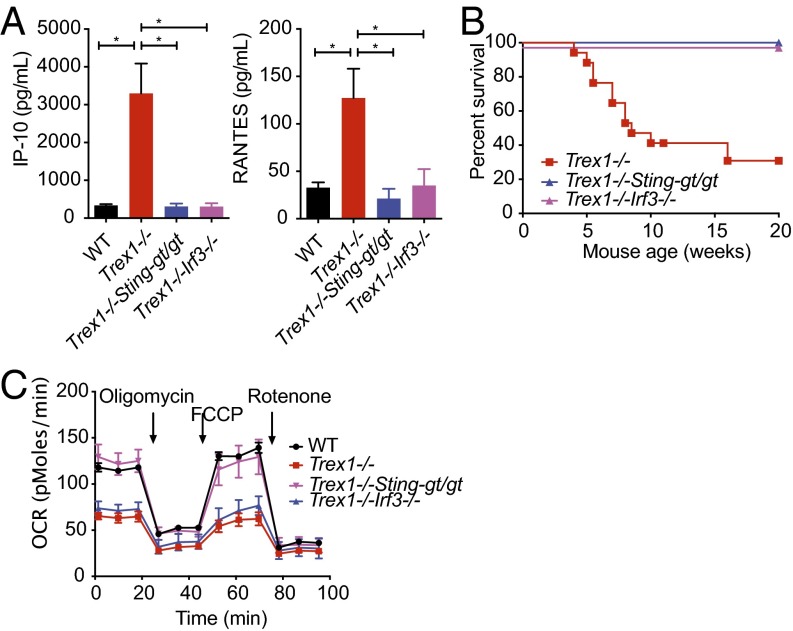
Trex1−/− mice succumb to systemic inflammation early in age, largely due to immune activation by self-DNA through the cGAS–STING–TBK1–IRF3 pathway (6, 7). Upon activation by DNA, cGAS produces cyclic GMP–AMP (cGAMP) dinucleotide that activates STING on the ER. STING then moves from the ER to cytoplasmic vesicles through the secretory pathway, during which time STING recruits protein kinase TBK1, which phosphorylates itself, STING, and transcription factor IRF3, leading to activation of IFN genes. Both Sting and Irf3 deficiency rescue inflammation and mortality of Trex1−/− mice (Fig. 2 A and B and refs. 3 and 5). We next examined cellular metabolic phenotypes of Trex1−/−Stinggt/gt and Trex1−/−Irf3−/− cells. Surprisingly, we found that Stinggt/gt fully rescued the mitochondrial-respiration defect associated with Trex1−/−, but Irf3−/− did not (Fig. 2C). These data suggest that mitochondrial-respiration defect persists in Trex1−/−Irf3−/− cells, despite complete shutoff of IFN signaling and inflammation. Together, we conclude that mTORC1 is regulated by a STING-dependent, but IRF3-independent, mechanism in Trex1−/− mice. Our data also indicate that inflammation and metabolic defect in Trex1−/− mice can be genetically separated by Irf3−/−.
Fig. 2.
Cellular metabolic defect associated with Trex1−/− is STING-dependent but IRF3-independent. (A) Serum levels of indicated inflammatory cytokines in WT, Trex1−/−, Trex1−/−Stinggt/gt, and Trex1−/−Irf3−/− mice. (B) Survival curve of Trex1−/−, Trex1−/−Stinggt/gt, and Trex1−/−Irf3−/− mice. (C) Real-time changes in the OCR of WT, Trex1−/−, Trex1−/−Stinggt/gt, and Trex1−/−Irf3−/− BMDMs. Data are representative of at least two independent experiments.
Chronically Activated TBK1 Inhibits mTORC1 Activity.
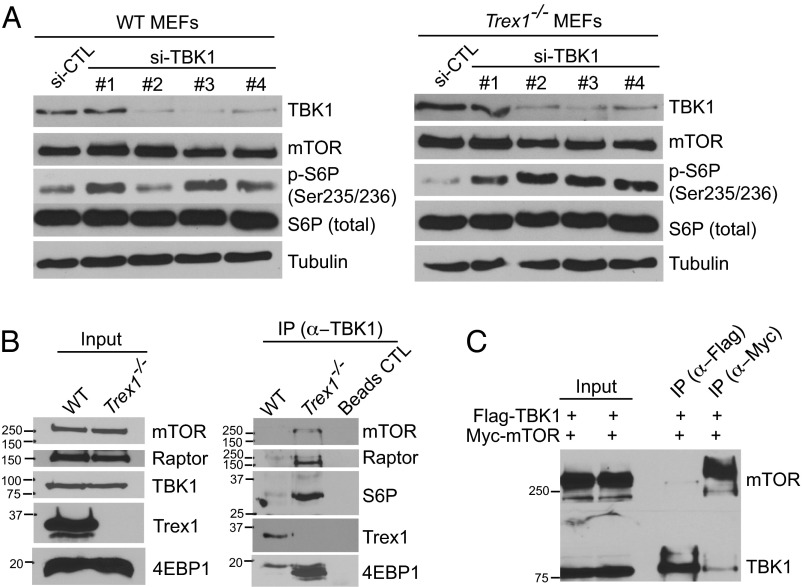
We next investigated the STING-dependent but IRF3-independent regulation of mTORC1 activity. One possibility is that STING recruits TBK1 to phosphorylate IRF3 and that chronically activated TBK1 may directly inhibit mTORC1. A previous study found that TBK1 interacts with mTORC1 and inhibits its activity in prostate cancer cells (12). In the case of DNA sensing, STING recruits TBK1 to form the “STING signalsome” as soon as it exits the ER, and both proteins travel through the secretory pathway, potentially reaching lysosomes where mTORC1 is located (13). To test this possibility, we first knocked down TBK1 in WT and Trex1−/− cells using four independent siRNAs. TBK1 knockdown in WT MEFs increased mTORC1 activity modestly above the already high steady-state level of mTORC1 activity (Fig. 3A; siRNA sequences are in Table S1). TBK1 knockdown in Trex1−/− MEFs clearly restored mTORC1 activity to WT level (Fig. 3A). We next examined whether TBK1 binds mTORC1 in Trex1−/− cells. We immunoprecipitated endogenous TBK1 from WT and Trex1−/− BMDMs and blotted for mTORC1 cofactors and substrates. Remarkably, we found that mTOR, Raptor, S6P, and 4EBP all coimmunoprecipitated with TBK1 only in Trex1−/− cells but not in WT cells (Fig. 3B). We next validated TBK1:mTOR interaction by overexpression of epitope tagged proteins and coimmunoprecipitation in 293T cells (Fig. 3C). Together, these data suggest that TBK1 inhibits mTORC1 activity through direct binding to the mTORC1 complex and that interaction is enhanced in Trex1−/− cells. Together with our genetic evidence, these data suggest that chronic activation of TBK1 promotes its interaction with mTORC1, resulting in inhibited mTORC1 activity in Trex1−/− cells.
Fig. 3.
TBK1 is recruited to the mTORC1 complex and inhibits mTORC1 complex activity in Trex1−/− cells. (A) Immunoblot analyses of mTORC1 activity in WT or Trex1−/− MEFs after control or TBK1 knocked down by siRNA. (B) Immunoblot analyses of TBK1–mTORC1 interaction in WT or Trex1−/− BMDMs. IP was performed with anti-TBK1 antibody and subsequently blotted for indicated proteins. (C) Immunoblot analyses of TBK1–mTORC1 interactions by transient transfection of Flag-TBK1 and Myc-mTOR plasmids and IP with indicated antibodies (Upper) in 293T cells. Both Flag-TBK1 and Myc-mTORC1 were expressed in both conditions, but Flag IP was performed in one sample and blot for Myc (upper strip of membrane), and Myc was performed in another sample and blot for Flag (lower strip of membrane).
Table S1.
siRNA used in this study
| Name | Sequence |
| mTBK1 #1 | CAGUGAUGUGCUUCACCGA |
| mTBK1 #1_as | UCGGUGAAGCACAUCACUG |
| mTBK1 #2 | CACAAAUUUGAUAAGCAAA |
| mTBK1 #2_as | UUUGCUUAUCAAAUUUGUG |
| mTBK1 #3 | GCUCUAACACCUUAGUGGA |
| mTBK1 #3_as | UCCACUAAGGUGUUAGAGC |
| mTBK1 #4 | GGAUUUCGGCGCCGCUCGA |
| mTBK1 #4_as | UCGAGCGGCGCCGAAAUCC |
| Control | UAGCGACUAAACACAUCAA |
| Control-as | UUGAUGUGUUUAGUCGCUA |
All siRNA oligos are predesigned and synthesized by Sigma-Aldrich. as, antisense.
Trex1−/− Mice Exhibit Systemic Metabolic Defect, Including Reduced Adiposity and Increased Energy Expenditure.
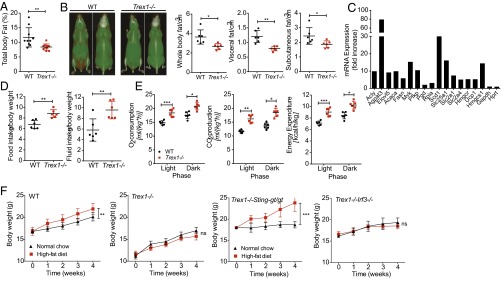
We next investigated whether the cellular metabolic defect caused by Trex1−/− is associated with any in vivo systemic metabolic phenotypes. Because mitochondrial respiration (oxidative phosphorylation) was reduced in Trex1−/− cells, it is possible that Trex1−/− mice use fat as an alternate source of energy and become hypermetabolic in vivo. Increased lipolysis has been reported in patients treated with an mTORC1 inhibitor, rapamycin, following organ transplantation (14). S6K−/− or Raptor conditional knockout mice also showed altered lipid metabolic profiles (8, 9). Indeed, we observed significant reduction of body fat in Trex1−/− mice compared with age-matched WT controls (Fig. 4A). To pinpoint exact location(s) where fat is reduced, we used high-resolution micro-computed tomography (CT) scan and found significant reduction of fat both in subcutaneous tissues and visceral tissues, as well as brown fat (Fig. 4B).
Fig. 4.
Trex1−/− mice exhibit a hypermetabolic state with reduced adiposity and increased energy expenditure. (A) Percentage of total body fat in WT and Trex1−/− mice (n = 10). (B) High-resolution micro-CT scan images of WT and Trex1−/− mice (front and back view of the same mouse, red indicates fat mass). Representative images are shown on the left. Quantitation of whole-body, visceral, and subcutaneous fat volume is shown on the right (n = 6). (C) qRT-PCR analysis of selected genes involved in lipid metabolic pathways. (D) Food and fluid intake in WT and Trex1−/− mice over a period of 5 d (n = 6). (E) Oxygen consumption, CO2 production, and energy expenditure in WT and Trex1−/− mice (n = 6). (F) Body weights of WT or Trex1−/−, Trex1−/−Stinggt/gt, and Trex1−/−Irf3−/− mice on normal chow or HFD over a period of 4 wk (n = 9). Data are presented as the means ± SEM *P < 0.05; **P < 0.01; ***P < 0.001 (Student’s t test).
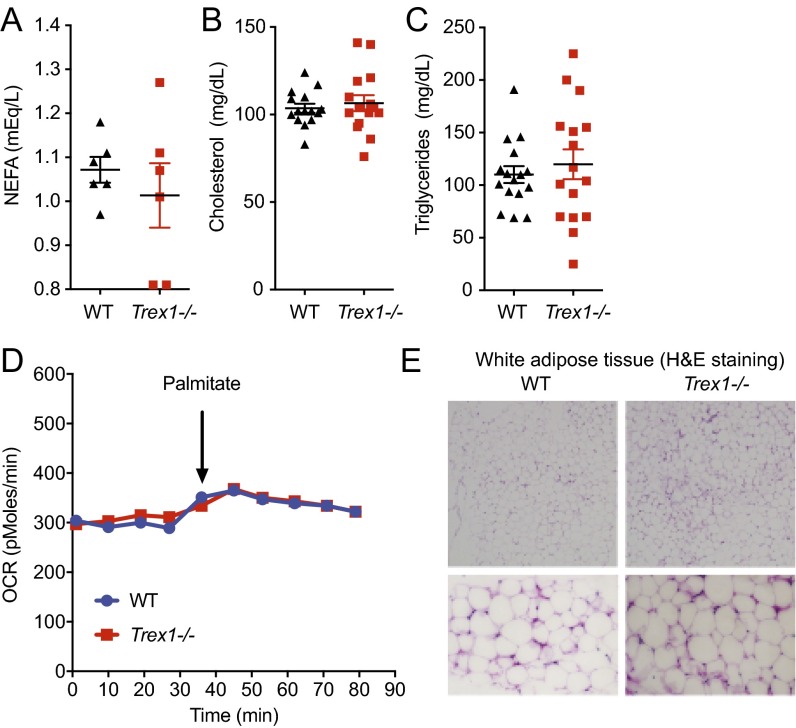
We next performed lipid analysis in serum and did not observe any significant differences in nonesterified fatty acids (NEFAs), triglycerides, or cholesterols (Fig. S2 A–C). We also did not observe any differences in fatty acid oxidation (Fig. S2D). We also did not observe any difference in white adipose tissue (Fig. S2E). We next isolated brown adipose tissue from WT and Trex1−/− mice and measured the expression of several genes known to be involved in fat metabolism. Genes involved in fat metabolic pathways (15), such as Agpat3, Scd1, and many others, were highly up-regulated (5–80-fold) in Trex1−/− brown adipose tissue compared with WT (Fig. 4C), consistent with accelerated fat metabolism.
Fig. S2.
Serum lipids and white adipose tissue are not affected by Trex1−/−. (A–C) WT and Trex1−/− mouse serum NEFA, triglyceride, and cholesterol measurements. No statistically significant difference was observed. (D) Seahorse measurement of fatty acid oxidation (FAO) in WT and Trex1−/− cells using palmitate–BSA FAO substrate. (E) H&E staining of white adipose tissue isolated from WT and Trex1−/− mice. The lower images are close-up views.
We also monitored bioenergetics profiles of WT and Trex1−/− mice using metabolic cage. We observed increased food and fluid intake (Fig. 4D), as well as significant increase in oxygen consumption, carbon dioxide production, and heat production in Trex1−/− mice (Fig. 4E). To further characterize the hypermetabolic phenotype and determine whether this in vivo phenotype also depends on STING or IRF3, we challenged WT, Trex1−/−, Trex1−/−Stinggt/gt, and Trex1−/−Irf3−/− mice with a high-fat diet (HFD) over a period of 4 wk (median survival of Trex1−/− mice is around 8–10 wk). We found that Trex1−/− and Trex1−/−Irf3−/− mice did not gain any additional weight during the HFD challenge, whereas WT and Trex1−/−Stinggt/gt mice gained significantly more weight during the same period on HFD (Fig. 4F). These data demonstrate that the in vivo hypermetabolic phenotype observed in Trex1−/− mice is also STING-dependent and IRF3-independent, which implies that the reduced cellular mitochondrial respiration and increased in vivo fat metabolism are likely associated, and both could be caused by chronically suppressed mTORC1 activity.
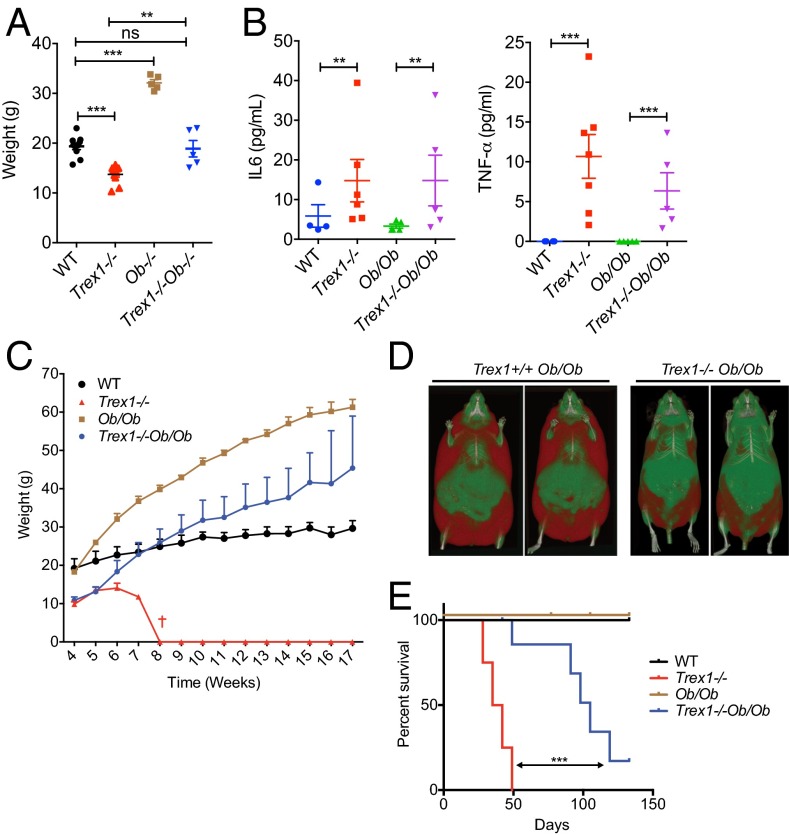
We next crossed Trex1−/− mice to Leptin-deficient (Ob/Ob) mice to determine whether we can genetically rescue the hypermetabolic phenotype of Trex1−/− mice by enhancing lipogenesis. Remarkably, Trex1−/−Ob/Ob mice restored body weight to that of WT and heterozygous littermate controls, all significantly lower compared with littermate Ob/Ob mice (Fig. 5A). Inflammatory cytokines such as IL-6 and TNFα remain elevated in Trex1−/−Ob/Ob mice compared with WT mice, at levels similar to Trex1−/− mice, suggesting that Ob/Ob did not dampen inflammation (Fig. 5B). This observation further supports the notion that inflammation and metabolism can be genetically separated. Trex1−/−Ob/Ob mice were able to exceed WT in body weight after 3 mo of age, while still weighing less than Ob/Ob mice (Fig. 5C). CT scans also showed less body fat in Trex1−/−Ob/Ob mice compared with Trex1+/+Ob/Ob mice (Fig. 5D). More importantly, we observed significant increase in survival of Trex1−/−Ob/Ob mice compared with Trex1−/− alone (Fig. 5E). Although systemic inflammation is the predominant cause of mortality in Trex1−/− mice, our data showed that enhancing lipogenesis can prolong the survival of Trex1−/− mice without dampening inflammation, suggesting that the hypermetabolic phenotype, likely a consequence of reduced mTORC1 activity, is an important contributing factor to the overall morbidity of Trex1−/− mice.
Fig. 5.
Leptin deficiency (Ob/Ob) increases lipogenesis and survival of Trex1−/− mice without dampening inflammation. (A) Body weights of mice of indicated genotypes on normal chow diet for 6 wk (n = 5–10). (B) Serum levels of indicated inflammatory cytokines. (C) Body weights of mice of indicated genotypes on normal chow diet for a period 17 wk (n = 5–10). (D) High-resolution micro-CT scan images of WT and Trex1−/− mice on Ob/Ob background (front view of two separate mice, red indicates fat mass). (E) Survival curve of mice of indicated genotypes (n = 5–10). Data are presented as the means ± SEM. *P < 0.05; **P < 0.01; ***P < 0.001. (A and B, Student’s t test; E, log-rank test.)
Trex1−/− Mice Support Accelerated Growth of Implanted Breast Cancer Cells.
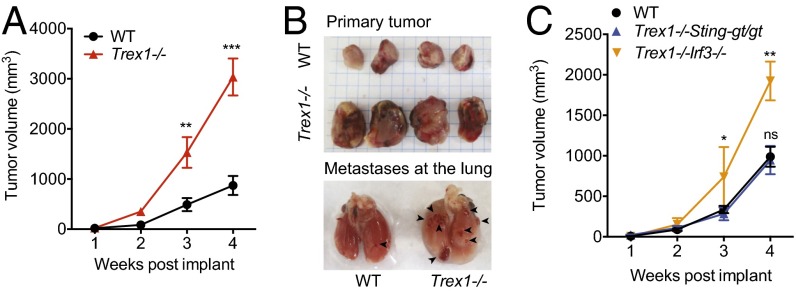
Persistent mTORC1 inhibition by rapalogs (analogs of rapamycin) has been reported to cause liver damage, inflammation, and enhanced tumorigenesis (16). The reduced mitochondrial respiration and increased glycolysis of Trex1−/− cells also resembles the Warburg effect (17), although spontaneous tumor has not been observed in Trex1−/− mice during their short lifespan. We next examined whether Trex1−/− mice could alter the growth rate of implanted cancer cells. We implanted E0771 breast cancer cells [derived from breast tumor in a C57BL/6 mouse (18)] in the mammary pad of WT and Trex1−/− mice and followed the mice over a period of 3–4 wk. Remarkably, Trex1−/− mice supported two- to threefold increase in primary tumor size and more frequent lung metastasis compared with age-matched WT mice (Fig. 6 A and B). To determine whether STING- or IRF3-mediated signaling is also playing a role, we performed similar xenograft experiments in Trex1−/−Stinggt/gt and Trex1−/−Irf3−/− mice. We found that Trex1−/−Irf3−/− mice also supported increased tumor growth, whereas Trex1−/−Stinggt/gt mice are indistinguishable to WT mice in tumor growth (Fig. 6C). These data provide yet another line of evidence for an IRF3-independent STING-signaling branch in Trex1−/− mice, which could create a favorable microenvironment or immune status that enhances tumorigenesis (for a model, Fig. 7).
Fig. 6.
Trex1−/− mice support accelerated growth of implanted breast cancer cells. (A) E0771 breast tumor growth in WT and Trex1−/− mice; 5 × 10⁵ E0771 cells were injected into mammary pads of female WT and Trex1−/− mice. Tumor sizes were recorded weekly (n = 9). (B) Representative images of primary and metastatic tumor at week 4 from WT or Trex1−/− mice. (C) E0771 breast tumor growth in WT and Trex1−/−Stinggt/gt and Trex1−/−Irf3−/− mice. E0771 cells were injected as in A. Data are presented as the means ± SEM. *P < 0.05; **P < 0.01; ***P < 0.001; ns, not significant (Student’s t test).
Fig. 7.
A model. Trex1−/− leads to chronic activation of the STING–TBK1–IRF3 signaling pathway, leading to inflammation through IRF3 and mTORC1 inhibition by TBK1. Reduced mTORC1 activity causes metabolic dysregulation, including reduced mitochondrial respiration and increased glycolysis and fat metabolism.
Discussion
We present here an autoimmune/autoinflammatory disease mouse model, Trex1−/−, with evidence of cellular and systemic metabolic dysregulation and chronically suppressed mTORC1 activity. TREX1 is best known for its DNase activity, which prevents sensing of cytosolic self-DNA by the cGAS–STING pathway and activation of the IFN response (6, 7). The striking resemblance of Trex1−/− mice’s lean appearance to the phenotypes of S6K- or Raptor-deficient mice (8, 9), together with significantly reduced mTORC1 activity in tissues, provided a strong clue that chronic activation of immune pathways in Trex1−/− mice may play an important role in mTORC1 regulation and metabolism. We provide evidence that inflammation and metabolic defects in Trex1−/− mice can be genetically separated. Both Trex1−/−Stinggt/gt and Trex1−/−Irf3−/− mice fully rescued mortality and inflammation caused by Trex1−/−. Importantly, Trex1−/−Stinggt/gt also rescued the cellular mitochondrial respiration and systemic hypermetabolic phenotypes associated with Trex1−/−, whereas Trex1−/−Irf3−/− failed to rescue either metabolic phenotype. Complementing these findings are the genetic crosses to Ob/Ob mice, where Trex1−/−Ob/Ob mice increased lipogenesis and overall survival without dampening inflammation compared with Trex1−/− mice.
The key protein connecting STING and IRF3 is TBK1. TBK1 is a member of the IκB kinase family and is ubiquitously expressed. In addition to its role in innate immunity, TBK1 also plays an important role in cell proliferation and cancer (19), and Tbk1 deficiency is embryonic-lethal. TBK1 has been shown to inhibit mTORC1 activity in prostate cancer cells (12, 20). T cell-specific ablation of TBK1 also enhances mTORC1 signaling in an experimental autoimmune encephalomyelitis model (20). We recently showed that pharmacological inhibition of TBK1 ameliorates disease phenotypes in Trex1−/− mice (21). STING activation involves trafficking from the ER to cytoplasmic vesicles through the secretory pathway (13), during which time TBK1 is recruited and travels with STING as part of the STING signalsome, which is potentially targeted to lysosomes for degradation to prevent excessive IFN response (22) (see the model in Fig. 7). mTORC1 localizes to the lysosomes, and we showed that Trex1 deficiency enhances lysosome biogenesis through suppressing mTORC1 activity (1). We now further show with biochemical evidence that TBK1 is recruited to the mTORC1 complex in Trex1−/− cells, and TBK1 knockdown by siRNA alleviated mTORC1 suppression in Trex1−/− cells. These molecular findings establish a plausible mechanism by which chronic STING activation and trafficking not only recruit TBK1 for IRF3 signaling but also bring TBK1 to close proximity with mTORC1 on the lysosomes. Consistent with this finding, mTORC1 substrate S6K was recently shown to be recruited to the STING–TBK1 complex to promote IFN signaling during acute DNA stimulation (23). The molecular details of the interaction between the STING signalsome and the mTORC1 complex, as well as functional consequences during acute and chronic DNA stimulation, require further investigation.
Trex1 deficiency leads to reduced mTORC1 activity in mouse cells and tissues, as well as impaired cellular metabolism (reduced mitochondrial respiration) and a hypermetabolic state (increased fat metabolism and glycolysis) in vivo. Both the cellular and systemic metabolic phenotypes are STING-dependent and IRF3-independent, and both phenotypes have previously being shown to be associated with reduced mTORC1, a master regulator of metabolism (8–10). The “cause” of inflammation (and innate immune signaling) in Trex1−/− mice has been clearly demonstrated by multiple groups to be the self-DNA-mediated activation of the cGAS–STING–TBK1–IRF3 pathway. In the context of this knowledge, decreased mTORC1 activity is the “consequence,” not the cause, of Trex1-deficiency-mediated innate immune signaling; this decreased mTORC1 activity occurs cell-intrinsically. However, our study does not exclude the possibility of decreased mTORC1 in turn influencing overall inflammation. We also found that Trex1 deficiency enhances growth of xenografted tumor, and this protumor effect is also STING-dependent but IRF3-independent. Whether this protumor effect is the result of chronic mTORC1 inhibition by TBK1 or the dysregulated host metabolism seen in Trex1−/− mice requires more investigation. Other host immune signaling downstream of STING, such as NF-κB or STAT6 activation (24), could also contribute to the overall protumor effect.
Together, we envision a model where chronic autoimmune activation of the STING–TBK1 pathway leads to reduced mTORC1 activity, which then causes dysregulated cellular and systemic metabolic phenotypes. We identify TBK1 as the critical factor that regulates both immune signaling (that leads to inflammation) and metabolism (through inhibiting mTORC1). Future studies are needed to further illuminate how TBK1 balances both activities in normal and in autoimmune disease settings. It will be interesting to investigate whether other chronic innate immune activation mouse models present similar metabolic phenotypes. Nonetheless, because metabolic dysregulation is becoming more commonly observed in autoimmune diseases such as SLE, which is often associated with elevated type I IFN gene signature and chronic activation of TBK1-dependent innate immune pathways (21, 25, 26). The molecular mechanism we delineated here with the Trex1−/− mouse model highlight TBK1 as a potentially useful therapeutic target that mediates the crosstalk between immune response and metabolism.
Materials and Methods
Cells, Mice, and Reagents.
All animal experimental protocols were approved by the Institutional Animal Care and Use Committee of University of Texas Southwestern Medical Center at Dallas. Trex1−/− mice were described previously (1). Trex1−/−Ob/Ob mice were generated by crossing Trex1+/− mice with Ob/Ob mice. All mice used in this study were from a C57BL/6 background, and experiments were conducted using littermate-controlled male or female mice. A detailed reagent list is in SI Materials and Methods.
RNA Isolation, Quantitative RT-PCR Analysis, Cytokine-Detection Assay, Western Blot, and Immunoprecipitation.
RNA isolation and quantitative (q)RT-PCR analysis were performed as described previously (1). Serum cytokines were measured by MILLIPLEX multiplex assay using Luminex (EMD Millipore) according to the manufacturer’s protocols. Western blots were performed as described previously (1). Coimmunoprecipitation experiments were performed as described previously (2).
Body Composition Analysis, Computed Topography, Metabolism Assay, and Tumor Study.
A Whole Body Composition Analyzer (Bruker Minispec mq10; Bruker) was used to quantify total body fat, lean body mass, and fluid contents. For real-time analysis of the ECAR and OCR, cells were analyzed with XF-24-3 extracellular flux analyzer (Seahorse Bioscience) according to the manufacturer’s recommendations. Serum NEFA measurements were done using the Vitros 250 Chemistry System at the University of Texas Southwestern Medical Center Mouse Metabolic and Phenotyping Core. For more detailed information, SI Materials and Methods.
SI Materials and Methods
Cells and Mice.
Trex1−/− mice were described previously (1). Trex1−/−Ob/Ob mice were generated by crossing Trex1+/− mice with Ob/Ob mice (a kind gift from Philipp Scherer, UT Southwestern Medical Center, Dallas). Cells were maintained in DMEM with 10% (vol/vol) heat-inactivated FCS, 2 mM l-glutamine, 10 mM Hepes, and 1 mM sodium pyruvate (complete DMEM) with the addition of 100 U/mL penicillin and 100 mg/mL streptomycin and cultured at 37 °C with 5% CO2. For Trex1−/− MEFs reconstituted with various TREX1-rescuing constructs, WT, mutant, or truncated TREX1 was cloned into retroviral MRX-ibsr vector (a kind gift from S. Akira, Osaka University, Osaka, Japan) using EcoRI and NotI sites. For the generation of BMDMs and BMDCs, femurs and tibias were collected from 6- to 8-wk-old mice. Bone marrow was flushed from the bones with cold DMEM supplemented with 20% conditioned medium from L929 mouse fibroblasts, 10% (vol/vol) heat-inactivated FBS, 2 mM l-glutamine, 10 mM Hepes, 1 mM sodium pyruvate, 100 U/mL penicillin, and 100 mg/mL streptomycin. Bone marrow cells were cultured for 7 d in 10-cm Petri dishes (10-mL volume) at 37 °C and 5% CO2. At days 3 and 6, fresh medium was added to the cultured cells. GM-CSF (20–30 ng/mL) and IL-4 (10–40 ng/mL) were used for making BMDCs. All of the mice used in this study were from a C57BL/6 background, and experiments were conducted using littermate-controlled male or female mice. Animals were housed in a temperature-controlled specific pathogen-free environment on a 12-h light/12-h dark cycle with free access to food and water. Mice were fed either standard chow (2916 Global Diet; Harlan Teklad) or HFD (TD. 88137 Western Diet; Harlan Teklad). HFD experiments were initiated at 4 wk of age and monitored for the indicated time period. For energy-expenditure measurements, mice were first acclimatized in individual cages for 3 d and then monitored over a period of 5 d using metabolic cages (Mouse Metabolic and Phenotyping Core facility, UT Southwestern Medical Center).
Reagents and Antibodies.
TRI Reagent (Invitrogen) was used for RNA isolation. Lipofectamine 2000 (Invitrogen) was used for nucleic acid transfections. Antibodies used in this study include the following: anti-Trex1 (mouse, 1:1,000 dilution; 29, 611987; BD Biosciences); anti-FLAG (mouse, 1:1,000 dilution; M2; F1804; Sigma-Aldrich); anti-tubulin (mouse, 1:2,000 dilution; B-5-1-2; Sigma-Aldrich); anti-V5 (mouse; 1:10,000 dilution; R-960-25; Life Technologies); anti-Myc (rabbit, 1:2,000 dilution; sc-40 ac; Santa Cruz); anti-mTOR (rabbit, 1:1,000 dilution; 7C10; 2983; Cell Signaling); anti-Raptor (rabbit, 1:1,000 dilution; 24C12; 2280; Cell Signaling); anti-S6P (rabbit, 1:1,000 dilution; 5G10; 2217; Cell Signaling); antibody to S6P phosphorylated at Ser235 and Ser236 (rabbit, 1:1,000 dilution; 2211; Cell Signaling); antibody to p70 S6K phosphorylated at Thr389 (rabbit, 1:1,000 dilution; 9205; Cell Signaling); antibody to 4E-BP1 phosphorylated at Thr37 and Thr46 (rabbit, 1:1,000 dilution; 2855; Cell Signaling); anti-4E-BP1 (rabbit, 1:1,000 dilution; 9644; Cell Signaling); anti-TBK1 (rabbit, 1:1,000 dilution; 3504; Cell Signaling); and antibody to phosphorylated TBK1 at Ser172 (rabbit, 1:1,000 dilution; 5483; Cell Signaling); secondary antibodies (1:4,000 dilution; GE Healthcare) were used for immunoblot analysis according to standard protocols.
RNA Isolation, qRT-PCR Analysis, and Cytokine-Detection Assay.
RNA isolation and qRT-PCR analysis were performed as described previously (1). qPCR array analyses of immune gene profiles were performed using custom-ordered PCR array plates containing primer sets prealiquoted (Bio-Rad). Each primer set was validated by Bio-Rad and in-house. Serum cytokines were measured by MILLIPLEX multiplex assay using Luminex (EMD Millipore) according to the manufacturer’s protocols.
Western Blot and IP.
Western blots were performed as described previously (1). Briefly, cells were removed from the plate, and cell pellet was lysed with 0.1 mL of 1× radioimmunoprecipitation assay lysis buffer [50 mM Tris (pH 7.5), 150 mM sodium chloride, 0.5% sodium deoxycholate, 1% Nonidet P-40] containing 1× cOmplete EDTA-free Protease inhibitor mixture tablets (Roche Diagnostics), 1× Phosphatase Inhibitor Mixture 2 (Sigma-Aldrich), 1 mM sodium orthovanadate (Sigma-Aldrich), 25 mM sodium fluoride (Sigma-Aldrich), and 1 mM phenylmethylsulfonyl fluoride (Sigma-Aldrich). Protein concentration was quantified by using the Pierce BCA Protein Assay Kit per the manufacturer’s instructions; 100 μg of total protein was loaded per sample on a 10% polyacrylamide gel and run at 150 V for 1 h using the Bio-Rad Mini-PROTEAN Tetra Cell. Proteins from the gel were transferred to nitrocellulose using a Trans-Blot SD Semi-Dry Transfer Cell (Bio-Rad) at 15 V for 1 h. Membranes blocked with 5% nonfat milk in 1× TBS-T [20 mM Tris Base, 150 mM sodium chloride, 0.05% Tween-20 (pH 7.6)]. Then, the membrane was cut into sections to allow for primary antibody detection.
Coimmunoprecipitation experiments were performed as described previously (2). Briefly, ∼2 × 10⁶ 293T were transfected with indicated plasmids. Cells were subsequently collected, washed once with PBS, lysed in IP lysis buffer [20 mM Tris⋅HCl (pH 7.4), 150 mM NaCl, 0.5% Nonidet P-40, and 1× protease inhibitor mixture], and centrifuged at 20,000 × g for 20 min at 4 °C. The supernatants were mixed with primary antibody and Dynabeads Protein G (Life Technology) and incubated overnight at 4 °C. The fallowing day, the beads were washed once with IP buffer and then twice with high-salt IP buffer (500 mM NaCl) and finally once with low-salt IP buffer (50 mM). Immunocomplexes were eluted in 3× sample buffer and boiled at 95 °C for 10 min. Samples were analyzed by immunoblotting.
Body Composition Analysis, Computed Topography, and Metabolism Assay.
The Whole Body Composition Analyzer (Minispec mq10; Bruker) was used to quantify total body fat, lean body mass, and fluid contents. For in vivo micro-CT scanning, mice were anesthetized with 1% isoflurane inhalation, and a whole-body scan was performed at a resolution of 93 μm (80 kV; 450 μA; and 100-ms integration time) using an eXplore Locus Micro-CT scanner (GE Healthcare). The micro-CT scanner was calibrated according to the protocols provided by the manufacturer. The high-resolution images from the micro-CT scanner were used for quantification of whole-body, subcutaneous, and visceral fat mass. For real-time analysis of the ECAR and OCR, cells were analyzed with XF-24-3 extracellular flux analyzer (Seahorse Bioscience) according to the manufacturer’s recommendations. [13C]glucose-tracing experiments and metabolites analysis were performed as described previously (11). Serum NEFA measurements were done using the Wako diagnostics assay kit; triglyceride and cholesterol measurements were done using the Vitros 250 Chemistry System at the UT Southwestern Medical Center Mouse Metabolic and Phenotyping Core.
Tumor Xenograft Model.
E0771 cells were grown in DMEM plus 10% (vol/vol) FBS; 5 × 10⁵ cells were implanted in the mammary pad of mice with indicated genotypes and followed over a period of 4 wk. Tumor size was measured weekly.
Statistical Methods.
Data are presented as the means ± SEM. GraphPad Prism 6 was used for statistical analysis. Statistical tests performed were indicated in the figure legends (*P < 0.05; **P < 0.01; ***P < 0.001).
Acknowledgments
We thank Beth Levine (University of Texas Southwestern Medical Center) for the E0771 cells and expression plasmids for mTOR and TBK1, Philipp Scherer (University of Texas Southwestern Medical Center) for Ob/Ob mice, Min Ae Lee-Kirsch (Technische Universität Dresden) for TREX1 patient cells, and Charles Fermaintt for technical assistance. We also thank members of the N.Y. laboratory for helpful discussions. This work was supported by US National Institutes of Health Grants AI098569 and AR067135 (to N.Y.), the Alliance for Lupus Foundation (N.Y.), and Welch Foundation Grant I-1831 (to N.Y.).
Footnotes
The authors declare no conflict of interest.
This article is a PNAS Direct Submission.
This article contains supporting information online at www.pnas.org/lookup/suppl/doi:10.1073/pnas.1611113114/-/DCSupplemental.
References
- 1.Hasan M, et al. Trex1 regulates lysosomal biogenesis and interferon-independent activation of antiviral genes. Nat Immunol. 2013;14(1):61–71. doi: 10.1038/ni.2475. [DOI] [PMC free article] [PubMed] [Google Scholar]
- 2.Hasan M, et al. Cytosolic nuclease TREX1 regulates oligosaccharyltransferase activity independent of nuclease activity to suppress immune activation. Immunity. 2015;43(3):463–474. doi: 10.1016/j.immuni.2015.07.022. [DOI] [PMC free article] [PubMed] [Google Scholar]
- 3.Stetson DB, Ko JS, Heidmann T, Medzhitov R. Trex1 prevents cell-intrinsic initiation of autoimmunity. Cell. 2008;134(4):587–598. doi: 10.1016/j.cell.2008.06.032. [DOI] [PMC free article] [PubMed] [Google Scholar]
- 4.Crow YJ, Rehwinkel J. Aicardi-Goutieres syndrome and related phenotypes: linking nucleic acid metabolism with autoimmunity. Hum Mol Genet. 2009;18(R2):R130–R136. doi: 10.1093/hmg/ddp293. [DOI] [PMC free article] [PubMed] [Google Scholar]
- 5.Gall A, et al. Autoimmunity initiates in nonhematopoietic cells and progresses via lymphocytes in an interferon-dependent autoimmune disease. Immunity. 2012;36(1):120–131. doi: 10.1016/j.immuni.2011.11.018. [DOI] [PMC free article] [PubMed] [Google Scholar]
- 6.Gao D, et al. Activation of cyclic GMP-AMP synthase by self-DNA causes autoimmune diseases. Proc Natl Acad Sci USA. 2015;112(42):E5699–E5705. doi: 10.1073/pnas.1516465112. [DOI] [PMC free article] [PubMed] [Google Scholar]
- 7.Gray EE, Treuting PM, Woodward JJ, Stetson DB. Cutting edge: cGAS is required for lethal autoimmune disease in the Trex1-deficient mouse model of Aicardi-Goutières syndrome. J Immunol. 2015;195(5):1939–1943. doi: 10.4049/jimmunol.1500969. [DOI] [PMC free article] [PubMed] [Google Scholar]
- 8.Polak P, et al. Adipose-specific knockout of raptor results in lean mice with enhanced mitochondrial respiration. Cell Metab. 2008;8(5):399–410. doi: 10.1016/j.cmet.2008.09.003. [DOI] [PubMed] [Google Scholar]
- 9.Um SH, et al. Absence of S6K1 protects against age- and diet-induced obesity while enhancing insulin sensitivity. Nature. 2004;431(7005):200–205. doi: 10.1038/nature02866. [DOI] [PubMed] [Google Scholar]
- 10.Chen Z, et al. Mutation of mouse Samd4 causes leanness, myopathy, uncoupled mitochondrial respiration, and dysregulated mTORC1 signaling. Proc Natl Acad Sci USA. 2014;111(20):7367–7372. doi: 10.1073/pnas.1406511111. [DOI] [PMC free article] [PubMed] [Google Scholar]
- 11.Cheng T, et al. Pyruvate carboxylase is required for glutamine-independent growth of tumor cells. Proc Natl Acad Sci USA. 2011;108(21):8674–8679. doi: 10.1073/pnas.1016627108. [DOI] [PMC free article] [PubMed] [Google Scholar]
- 12.Kim JK, et al. TBK1 regulates prostate cancer dormancy through mTOR inhibition. Neoplasia. 2013;15(9):1064–1074. doi: 10.1593/neo.13402. [DOI] [PMC free article] [PubMed] [Google Scholar]
- 13.Dobbs N, et al. STING activation by translocation from the ER is associated with infection and autoinflammatory disease. Cell Host Microbe. 2015;18(2):157–168. doi: 10.1016/j.chom.2015.07.001. [DOI] [PMC free article] [PubMed] [Google Scholar]
- 14.Pereira MJ, et al. The immunosuppressive agents rapamycin, cyclosporin A and tacrolimus increase lipolysis, inhibit lipid storage and alter expression of genes involved in lipid metabolism in human adipose tissue. Mol Cell Endocrinol. 2013;365(2):260–269. doi: 10.1016/j.mce.2012.10.030. [DOI] [PubMed] [Google Scholar]
- 15.Düvel K, et al. Activation of a metabolic gene regulatory network downstream of mTOR complex 1. Mol Cell. 2010;39(2):171–183. doi: 10.1016/j.molcel.2010.06.022. [DOI] [PMC free article] [PubMed] [Google Scholar]
- 16.Umemura A, et al. Liver damage, inflammation, and enhanced tumorigenesis after persistent mTORC1 inhibition. Cell Metab. 2014;20(1):133–144. doi: 10.1016/j.cmet.2014.05.001. [DOI] [PMC free article] [PubMed] [Google Scholar]
- 17.Vander Heiden MG, Cantley LC, Thompson CB. Understanding the Warburg effect: the metabolic requirements of cell proliferation. Science. 2009;324(5930):1029–1033. doi: 10.1126/science.1160809. [DOI] [PMC free article] [PubMed] [Google Scholar]
- 18.Ewens A, Mihich E, Ehrke MJ. Distant metastasis from subcutaneously grown E0771 medullary breast adenocarcinoma. Anticancer Res. 2005;25(6B):3905–3915. [PubMed] [Google Scholar]
- 19.Ou Y-H, et al. TBK1 directly engages Akt/PKB survival signaling to support oncogenic transformation. Mol Cell. 2011;41(4):458–470. doi: 10.1016/j.molcel.2011.01.019. [DOI] [PMC free article] [PubMed] [Google Scholar]
- 20.Yu J, et al. Regulation of T-cell activation and migration by the kinase TBK1 during neuroinflammation. Nat Commun. 2015;6:6074. doi: 10.1038/ncomms7074. [DOI] [PMC free article] [PubMed] [Google Scholar]
- 21.Hasan M, et al. Cutting edge: inhibiting TBK1 by compound II ameliorates autoimmune disease in mice. J Immunol. 2015;195(10):4573–7. doi: 10.4049/jimmunol.1500162. [DOI] [PMC free article] [PubMed] [Google Scholar]
- 22.Konno H, Konno K, Barber GN. Cyclic dinucleotides trigger ULK1 (ATG1) phosphorylation of STING to prevent sustained innate immune signaling. Cell. 2013;155(3):688–698. doi: 10.1016/j.cell.2013.09.049. [DOI] [PMC free article] [PubMed] [Google Scholar]
- 23.Wang F, et al. S6K-STING interaction regulates cytosolic DNA-mediated activation of the transcription factor IRF3. Nat Immunol. 2016;17(5):514–522. doi: 10.1038/ni.3433. [DOI] [PMC free article] [PubMed] [Google Scholar]
- 24.Chen H, et al. Activation of STAT6 by STING is critical for antiviral innate immunity. Cell. 2011;147(2):436–446. doi: 10.1016/j.cell.2011.09.022. [DOI] [PubMed] [Google Scholar]
- 25.Bennett L, et al. Interferon and granulopoiesis signatures in systemic lupus erythematosus blood. J Exp Med. 2003;197(6):711–723. doi: 10.1084/jem.20021553. [DOI] [PMC free article] [PubMed] [Google Scholar]
- 26.Becker AM, et al. SLE peripheral blood B cell, T cell and myeloid cell transcriptomes display unique profiles and each subset contributes to the interferon signature. PLoS One. 2013;8(6):e67003. doi: 10.1371/journal.pone.0067003. [DOI] [PMC free article] [PubMed] [Google Scholar]


