Significance
We show that calsequestrin, the main Ca2+ storing protein of muscle, is polymerized inside the sarcoplasmic reticulum (SR) and its mobility increases greatly upon SR depletion, indicating depolymerization. Deep depletion causes massive calsequestrin migration and radical SR remodeling, often accompanied by a surge in intra-SR free Ca2+. The changes in calsequestrin polymerization observed in aqueous solutions therefore also occur in vivo. These changes help explain some uniquely advantageous properties of the SR as a source of calcium for contractile activation. The results support untested hypotheses about additional calsequestrin roles in the control of channel gating and facilitation of calcium flux. They also provide insights on the consequences of calsequestrin mutations for functional competence and structural stability of skeletal and cardiac muscle.
Keywords: skeletal muscle, excitation/contraction coupling, cardiac muscle, muscle diseases, catecholaminergic polymorphic ventricular tachycardia
Abstract
Calsequestrin, the only known protein with cyclical storage and supply of calcium as main role, is proposed to have other functions, which remain unproven. Voluntary movement and the heart beat require this calcium flow to be massive and fast. How does calsequestrin do it? To bind large amounts of calcium in vitro, calsequestrin must polymerize and then depolymerize to release it. Does this rule apply inside the sarcoplasmic reticulum (SR) of a working cell? We answered using fluorescently tagged calsequestrin expressed in muscles of mice. By FRAP and imaging we monitored mobility of calsequestrin as [Ca2+] in the SR--measured with a calsequestrin-fused biosensor--was lowered. We found that calsequestrin is polymerized within the SR at rest and that it depolymerized as [Ca2+] went down: fully when calcium depletion was maximal (a condition achieved with an SR calcium channel opening drug) and partially when depletion was limited (a condition imposed by fatiguing stimulation, long-lasting depolarization, or low drug concentrations). With fluorescence and electron microscopic imaging we demonstrated massive movements of calsequestrin accompanied by drastic morphological SR changes in fully depleted cells. When cells were partially depleted no remodeling was found. The present results support the proposed role of calsequestrin in termination of calcium release by conformationally inducing closure of SR channels. A channel closing switch operated by calsequestrin depolymerization will limit depletion, thereby preventing full disassembly of the polymeric calsequestrin network and catastrophic structural changes in the SR.
To start physiological contraction in striated muscles, a large amount of calcium moves from storage in the sarcoplasmic reticulum (SR) to the cytosol. Inside the SR, calcium is stored largely bound to calsequestrin, the only known protein dedicated to reversible ion buffering (1). In addition to storing calcium, calsequestrin has been proposed to mediate multiple functions (2). Although none of these proposed functions are proven, the likelihood that calsequestrin does more than buffering is supported by the widespread distribution of calsequestrin and calsequestrin-like orthologs in various cells, tissues, and organisms of Animalia and Plantae (reviewed in ref. 3), as well as the diversity of cardiac (4, 5) and skeletal muscle (6, 7) diseases linked to its mutations. Because the mutants show altered calcium release timing, calsequestrin is believed to modulate gating of ryanodine receptor (RyR) release channels. Because it forms long polymeric tendrils [also known as calcium wires (8)] ending near the SR channel mouth (9), calsequestrin is proposed to lead calcium toward the channel (8, 10), a speculation that assumes (as first done in ref. 11) that reduction of dimensionality enhances diffusion.
Most importantly, calsequestrin is unique as a calcium buffer. Buffering power B, the incremental ratio of bound over free ligand concentration, is maximal at zero ligand concentration, when the buffer is ligand-free, for most buffers. The buffering power of calsequestrin measured in vitro instead increases with the concentrations of free and bound calcium (6). This increase in buffering ability occurs because the loci for most calcium binding are at the interfaces between calsequestrin monomers, requiring two monomers to achieve useful binding affinity (12). It follows that higher [Ca2+] will promote polymerization, which, in turn, will provide additional sites for calcium binding. If adequately tuned, this cooperative feature will provide optimal calcium release ability at physiological [Ca2+]SR (2).
[Ca2+]SR decreases moderately (13) during normal skeletal muscle function; depletion is greater in cardiac muscle, where it reaches 50–90% (14). As crucial as polymerization appears to be for storage, and putatively other functions, its corollary, depolymerization, has never been demonstrated in a working cell upon depletion of the calcium store. Depolymerization would not just alter the buffer function of the protein; given the mechanical link of calsequestrin with other proteins in the couplon (15, 16), including the calcium release channels of the SR (RyRs), depolymerization could be sensed as an allosteric signal by the RyRs, thereby providing a physical mechanism for their control. Depolymerization would derail the hypothetical diffusional enhancement by destroying the calcium wires; it might also allow migration of calsequestrin away from triads, with damaging targeting and functional repercussions. Finally, all calsequestrin mutations associated with diseases of skeletal muscle (6) and many of the known calsequestrin mutations linked to cardiac diseases (17) are known or predicted to alter its polymerization; therefore, it can be anticipated that any changes that hinder normal polymerization of this protein [including the posttranslational modifications recently studied (18)] will have deleterious functional consequences. Whether and to what extent calsequestrin depolymerizes in situ, in working cells, is the central question of muscle function tested in the present work.
In single fibers of adult mouse muscle, we first characterize a kinetic feature of calcium release consistent with calsequestrin depolymerization and then evaluate the effects of calcium depletion on the intra-SR diffusional mobility of calsequestrin, which should increase upon depolymerization. We do it in myofibers of adult mice by imaging the fluorescence of tagged calsequestrin and its fluorescence recovery after photobleaching (FRAP) as a measure of the protein’s mobility. Fluorescence tagging is achieved by fusion of calsequestrin (the skeletal isoform Casq1) with EYFP or with a calcium biosensor, which also provides a continuous readout of [Ca2+]SR. Depleting interventions include drugs that open the SR calcium release channel or inhibit the sarco/endoplasmic reticulum calcium (SERCA) pump, and fatiguing electrical stimulation. EM imaging, probing possible structural changes in depleted muscles, completes the study.
Results
A Kinetic Hallmark of Calsequestrin Function.
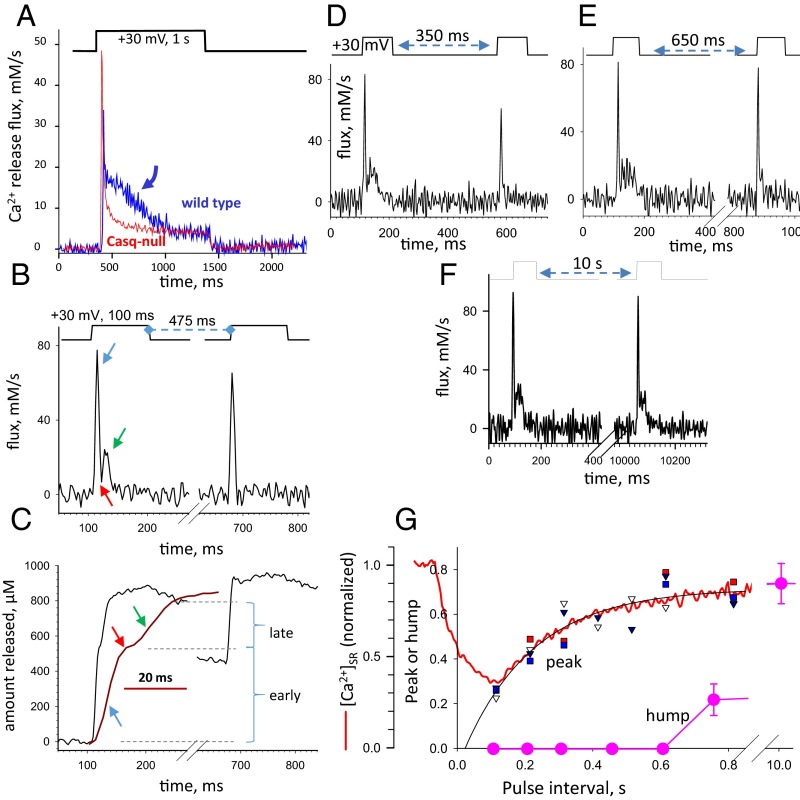
Fig. 1A (also Figs. S1 and S2) demonstrates a basic readout of calsequestrin function. The traces, reproduced from earlier work of our laboratory, are of calcium release flux elicited by a large depolarization imposed by patch-clamping; flux was derived from confocal images of [Ca2+]cyto in wild-type (WT) mouse myofibers (blue) and a mouse null for both calsequestrin isoforms (red). As previously reported (19), the waveforms start with a sharp peak and then decay, rapidly in the calsequestrin-null model but going through a characteristic “hump” in the WT model. This feature strictly requires calsequestrin to be present (19) and can be restored by exogenous expression (Figs. S1 and S2). In all other experiments illustrated in Fig. 1A, the fast calcium buffer BAPTA [1,2-bis(o-aminophenoxy)ethane-N,N,N′,N′-tetraacetic acid] was present in the internal solution to reduce calcium-dependent inactivation of the RyR channels (20). The presence of BAPTA increases the flux of calcium release and results in a sharper hump, which can be revealed using much briefer pulses, in turn, making elaborate kinetic studies feasible. Additionally, the sharply demarcated hump becomes quantifiable, as shown in Fig. 1C, in terms of the amount of released calcium on a time integral of calcium flux.
Fig. 1.
Kinetic properties of the hump (also Figs. S1 and S2). (A) Ca2+ release flux elicited in FDB muscle fibers under patch voltage clamp by the depolarization pulse at the top, derived from a WT (blue) or a Casq-2–null (red) mouse. Traces are reproduced from earlier work of our laboratory (19). The arrow indicates the hump component. (B) Ca2+ release flux elicited by a two-pulse protocol illustrated at the top. At variance with the conditions in A, BAPTA (5 mM) was present in the pipette. Note in the response to the first pulse the greater peak flux and the sharper, much briefer hump. The second pulse elicits a sharp flux devoid of a hump. (C) Time integrals of the flux record in B (the trace in red is the first part at an expanded time scale, with arrows corresponding to the arrows in B). Horizontal lines mark the amplitudes of two stages: “early” and “late.” The latter measures the magnitude of the hump as the amount of calcium released. It is zero in the rise caused by the second pulse, because no late component is visible in the integral. (D–F) Kinetics of flux recovery probed with three pairs of pulses at different intervals, applied on the same myofiber. (G) Dependence of the peak and hump on the conditioning interval. Small symbols depict peak flux amplitude (normalized to unconditioned value) in four myofibers. Large symbols represent averages of hump magnitude (evaluated as described in C) in six cells. The point at 10 s represents an average of four values at intervals between 5.5 and 15 s. The black curve, , is a fit to peaks. The curve in red represents [Ca2+]SR(t) measured in a myofiber expressing D4cpV-Casq1, plotted on the same time axis. In eight cells studied similarly, the recovery was well fit with a single exponential function of time; the average τ of [Ca2+]SR restoration was 230 ms (SEM = 37 ms).
Fig. S1.
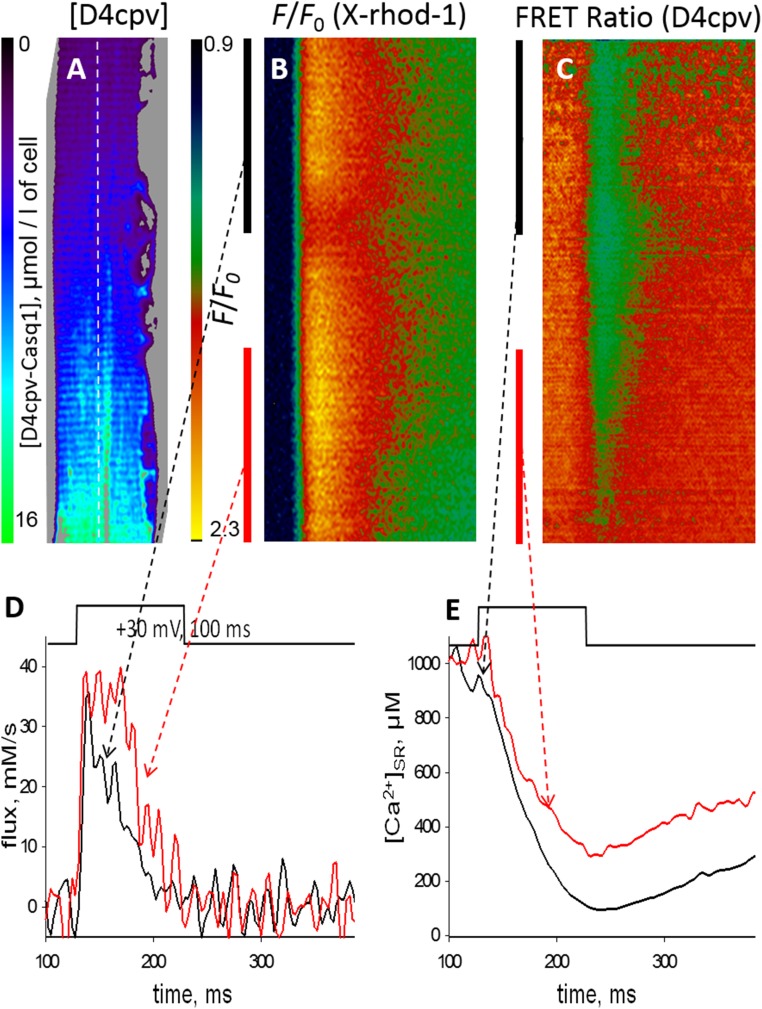
Further evidence on the source of the hump (supports Fig. 1). (A) Concentration of exogenous fusion protein D4cpV-Casq1 in a FDB myofiber of a Casq1-null mouse, evaluated from the “invariant” fluorescence of D4cpV measured as described (24). The protein expression (all of which was inside the SR) was spatially heterogeneous, reaching a maximum in this field of 15 μM (micromoles per liter of fiber volume). At the opposite end of the field, the concentration of the protein was close to 1 μM. (B and C) Confocal line scan images of the fluorescence of a cytosolic Ca2+ monitor and the FRET ratio of D4cpV-Casq1, which monitors [Ca2+]SR. The red and black vertical segments in B and C mark two regions of the fiber with, respectively, high and low concentrations of the exogenous Casq1 (∼12 and 2 μM, respectively). (D) Ca2+ release derived from the cytosolic Ca2+ transient in B, separately for the segments marked in red and black. The flux from the region with high [Casq1] (red trace) was greater than the flux from the region of low [Casq1] (black trace). The difference appeared to arise later than the initial maximum, which suggests that the exogenous Casq, when present in high concentration, restores a hump that was absent in the Casq-null muscle. (E) Records of [Ca2+]SR(t) derived from two regions of the line scan in C, showing a deeper depletion in the low [Casq] region (black trace) despite the greater flux of release derived from the high [Casq] side. In sum, the same depolarization caused more Ca2+ to be released from the region with higher [Casq], with a lesser reduction in free [Ca2+]SR. Together, these two facts imply that the extra released Ca2+ came from a bound fraction in the store, which indicates that Casq1 was the source of the additional Ca2+. At 20–30 Ca2+ per Casq1 molecule, an extra 10 μM Casq1 per liter of fiber would contribute an additional 200–300 μM to released Ca2+ [calculations in ref. (24)], in rough agreement with the present observations.
Fig. S2.
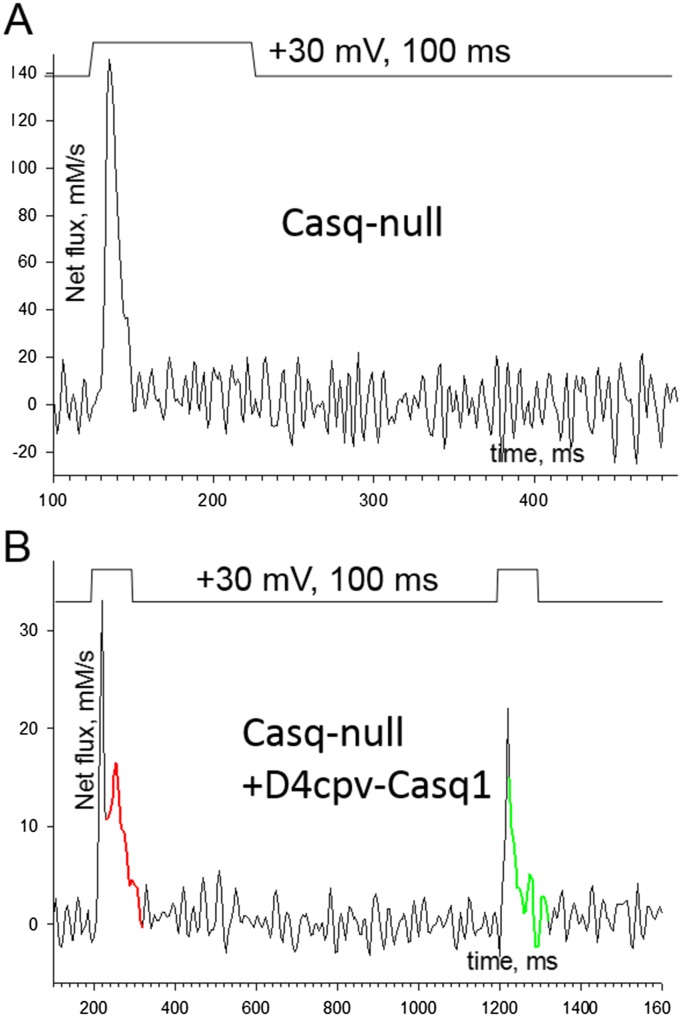
Restoration of the hump (supports Fig. 1). A comparison of Ca2+ release flux between two myofibers of the same Casq-null mouse with different density of expression of exogenous Casq1-D4cpV. (A) Flux plotted in a fiber with no expression, which exhibits the absence of a hump characteristic of Casq-null muscle. (B) Flux obtained from a fiber with an average [Casq1-D4cpV] of 15 μM in the imaged region. The fiber was subjected to a double-pulse stimulus. The response to the first pulse has a peak and a small hump marked in red. This component is missing in the response to the second pulse (compare portion in green trace). In conclusion, exogenous Casq1, fused with D4cpV, is capable of restoring a hump component of Ca2+ release that shares with the hump of WT cells the property of inactivating, becoming temporarily unavailable after an occurrence. If, as we propose, the transient unavailability reflects depolymerization of Casq1, this result implies that exogenous Casq1 is capable of polymerization and that it depolymerizes in the same way as the native Casq1.
A kinetic feature of the hump illuminates its molecular mechanism. In Fig. 1 B–F, release flux is elicited by pairs of pulses. Flux in the second pulse is reduced, and its kinetics are modified. At very short intervals, thoroughly explored in other works (21, 22), the peak of flux is absent. At intervals between 350 and 500 ms (Fig. 1 B–E), the peak is largely recovered but the hump is absent. As shown in Fig. 1G, the peak recovers with a time constant τ of ∼200 ms, although it takes 10 s for the hump to show substantial recovery and more than 30 s for its full restitution. The red trace in Fig. 1G shows [Ca2+]SR measured after an unconditioned depolarization in a separate experiment. The average τ of [Ca2+]SR restoration was 230 ms. The similarity of recovery time constants of peak flux and [Ca2+]SR suggests that the refilling of the SR with restoration of the [Ca2+] gradient is an important determinant of recovery of peak flux. Restoration of the hump is instead a much slower process, not limited by recovery of [Ca2+]SR.
These experiments (and others documented in Figs. S1 and S2) confirm that calcium released in the hump phase is supplied by calsequestrin. After this contribution, calsequestrin temporarily loses this function. Based on the requirement of calsequestrin polymerization for high-capacity calcium binding in vitro, we propose that this functional impairment reflects depolymerization of calsequestrin in situ, upon loss of calcium.
FRAP of Tagged Calsequestrin Reveals Changes in Its Diffusional Mobility.
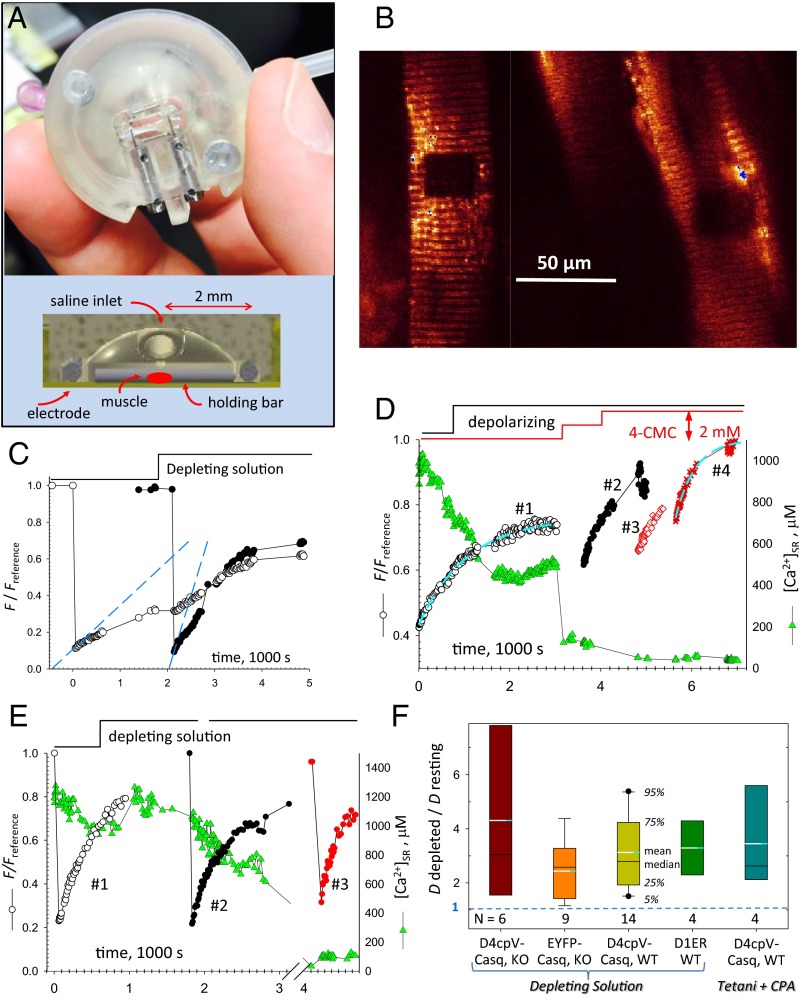
If calsequestrin depolymerizes inside the depleted SR, it should become more mobile than in the rested muscle. This prediction was tested by comparing FRAP of various luminal SR probes in myofiber bundles in resting and calcium-depleted conditions. Fig. 2A shows a small bundle of fibers from mouse flexor digitorum brevis (FDB) muscle inside the miniature chamber developed for this test. Slender bars attached eccentrically to rotary cylinders hold the bundle against the coverglass bottom, immobilized by stretch and N-benzyl-p-toluenesulfonamide (BTS). Fig. 2B shows a raw confocal image of the fluorescence of Casq1 fused with EYFP in cells of a calsequestrin-null mouse. EYFP-Casq1 fluorescence forms two bands per sarcomere, consistent with the location previously found for native Casq1 (23), and for Casq1 fused with D4cpV (24). The agreement indicates that Casq1 fused to either tag traffics in the same way as native Casq1, to SR terminal cisternae (TC). Each band of fluorescence therefore originates from the two TC in a triad, which cannot be resolved optically.
Fig. 2.
FRAP properties of tagged Casq1 (also Figs. S3 and S4 and SI Appendix). (A) Experimental chamber with FDB bundle in place (Top) and cutoff view of the 3D printed file (Bottom). (B) Confocal image of fluorescence of FDB bundle expressing EYFP-Casq1, showing two regions bleached before (Right) and after (Left) perfusion with solution 2. (C) Normalized fluorescence in the two bleached regions. Note the change in (slope of dashed lines) in depleting solution. (D) FRAP of D4cpV-Casq1. As illustrated by the green symbols, [Ca2+]SR measured by the biosensor. Other symbols plot in regions bleached successively as increasingly depleting solutions were applied. The red steps at the top indicate successive applications of 1 and 2 mM 4-CMC. The dashed cyan curves represent exponential fits used to determine the immobile fraction of fluorescence (Methods). The rates were 0.8, 2.1, 1.35, and 3.1 (1,000 s)−1, respectively, in regions 1–4. (E) FRAP of biosensor D1ER. The rates were 1.25, 1.59, and 2.53 (1.000 s)−1 in regions 1–3. (F) Summary of depletion effects, expressed as Ddepleted/Dresting, equal to . N, numbers of region pairs, usually located on the same cell, for each condition. Quantifiers are keyed by the central box. The calculation of levels 5% and 95% (represented by the bars) requires n ≥ 9, and was therefore not possible in all cases.
The dark rectangular areas shown in Fig. 2B were bleached by laser light at two different times: the one at the right while the fibers were at rest and the one at left 30 min later, 2 min after perfusion with depleting solution 2. A supporting time-lapse movie (Movie S1) illustrates the full experiment and demonstrates the performance of a custom program that automatically locates the bleached region for continued measurement in the presence of contractile or perfusion movements (of which the experiment is a most severe example). Fluorescence measured within the bleached areas is plotted in Fig. 2C. Recovery in the area to the right (region 1, open circles) was slow while the muscle was at rest and accelerated when the depleting solution was applied. Recovery in the area to the left (region 2, closed circles), bleached while in depleting solution, was visibly faster. Recovery is quantified in terms of the normalized fluorescence . We show in SI Appendix and Fig. S3 that the initial rate of change of , denoted as and always given in units of (1,000 s)−1, is proportional to the effective diffusion coefficient of the fluorescent species, D. We also establish the applicable value of the proportionality constant, which results in a D of 0.05 μm2⋅s−1 when equals 1. As shown in Fig. 2, was 0.23 for the bleached region 1 and increased to 0.88 in region 2. The increase upholds the hypothesis that calsequestrin depolymerizes upon SR depletion (statistics are presented in Fig. 2F and Table 1).
Fig. S3.
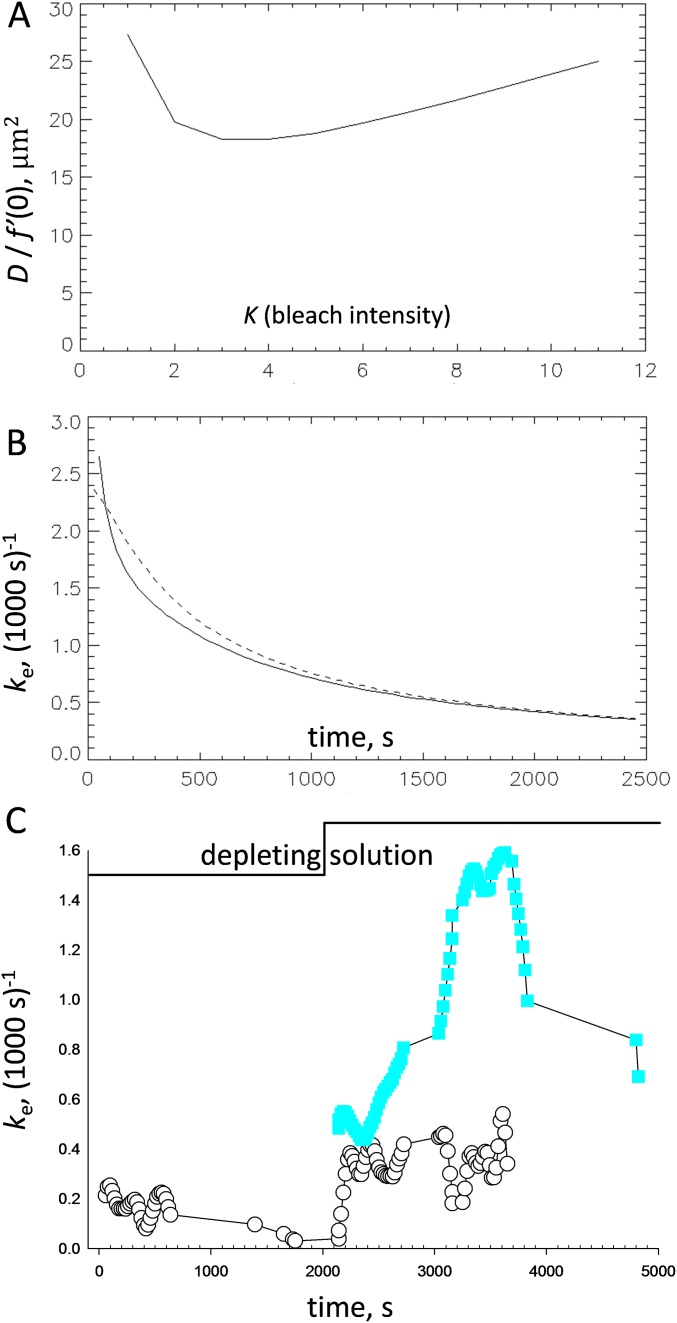
FRAP theory and simulation (supports Figs. 2 and 3 and SI Appendix). (A) Proportionality constant [] relating the effective diffusion coefficient D with the initial rate of FRAP recovery, plotted vs. the FRAP intensity parameter K [approximately equal to ]. The calculation used SI Appendix, Eq. S6. Our average rates for D4cpV-Casq were 0.63 and 1.37 (1,000 s)−1, respectively, in WT and null mice (Table 1). An initial rate of 1 (1,000 s)−1 at K = 10 therefore corresponds approximately to a diffusion coefficient of 0.025 μm2⋅s−1. (B) Solid curve shows the normalized rate of recovery , calculated using SI Appendix, Eq. S2 in with parameters valid for our measurements with D4cpV-Casq1 (D = 0.025 μm2⋅s−1; r = 6 μm). The dashed curve represents an alternative calculation using SI Appendix, Eq. S1 (derived with the assumption of homogeneous bleaching, which is better suited to the present experiments) and the same parameters. The result in both cases is a monotonically decreasing function. (C) Experimental example: is calculated from the traces in Fig. 2C. Note the generally decaying evolution in bleached region 1, followed by a large increase upon application of depleting solution. For the second bleached region, starts high, revealing that D increased in both myofibers after perfusion with depleting solution.
Table 1.
Effect of depleting operations on FRAP rate and SR calcium concentration
| Diffusing molecule | Mouse | Depleting operation | f′(0) (1,000s)−1 Avg (SEM) | [Ca2+]SR, μM [average (SEM)] | No. of cells |
| EYFP- Casq1 | Casq1-null | None | 0.38 (0.09) | n.a.† | 6 |
| Solution 2 | 0.87 (0.14)* | n.a.† | 13 | ||
| D4cpV- Casq1 | None | 1.37 (0.26) | 368 (46) | 5 | |
| Solution 2 | 3.44 (1.02)* | 68 (27) | 6 | ||
| WT | None | 0.64 (0.07) | 681 (112) | 15 | |
| Solution 2 | 1.85 (0.28)* | 64 (14) | 14 | ||
| None | 1.45 (0.28) | 524 (117) | 4 | ||
| Tetani | 2.92 (0.37)* | 145 (71) | 4 | ||
| D1ER | None | 1.84 (0.16) | 850 (106) | 4 | |
| Solution 2 | 4.24 (0.38)* | 100 (30) | 4 |
Column 3 provides initial FRAP rates , where . FRAP rates in multiple bleached regions of the same cell were averaged for individual cells. The values listed are equal-weight means of the individual cell averages. Column 4 lists average [Ca2+]SR as determined by the biosensor at the time of bleaching. Column 5 gives numbers of cells used in the measurements. n.a., not available.
Significance of the effect of the depleting intervention at P < 0.05 in a two-tailed t test of differences of averages. Fig. 2F provides an alternative comparison of effects, as differences paired in individual fibers.
No biosensor was present.
Although provides a measure of D immediately after bleaching, the “normalized rate of recovery” was used as a proportional measure of D beyond the initial times (Methods). With Fig. S4, we show that will decay monotonically with time if D is constant; instead, and as also shown in Fig. S4, it increased markedly in the first bleached region of Fig. 2C upon application of depleting solution. The result is again consistent with an increase in D (and depolymerization of Casq1).
Fig. S4.
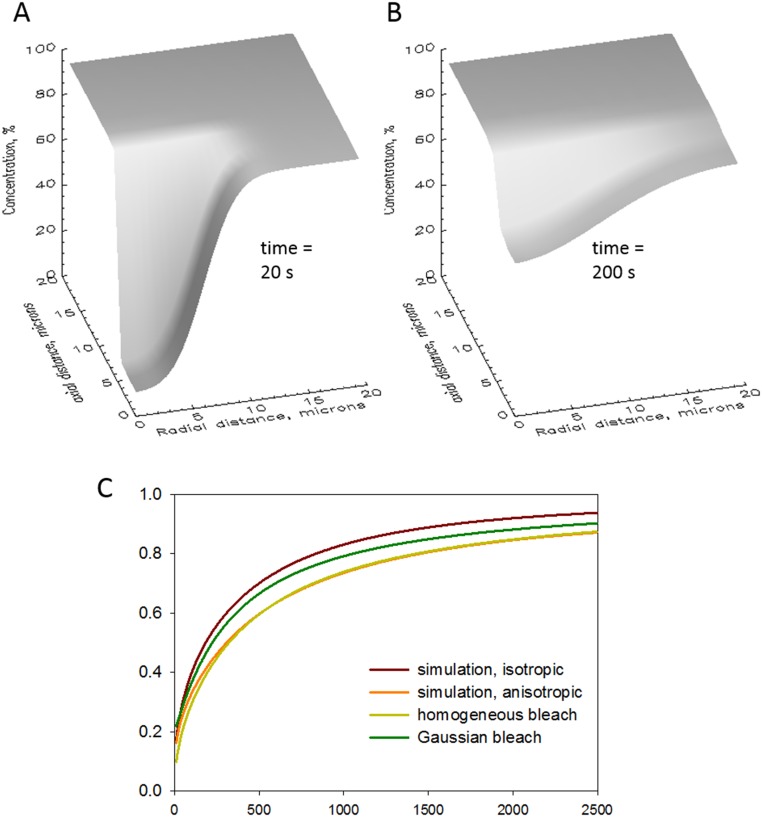
Simulations with realistic geometry (supports Figs. 2 and 3 and SI Appendix). (A and B) Numerical simulations that avoid two premises in the theory. One is the assumption of an infinite volume of the diffusant, and the other is isotropy in the diffusion coefficient. Simulations assumed a cylindrical volume with the dimensions of the cell (500 μm long, 40 μm in diameter). At time 0, the concentration of diffusant was reduced to = 0.1 in a cylindrical region of 12 μm in length and 12 μm in diameter. Either the same or different values of D (Dy and Dr) were used to compute flux in the transversal and radial directions. Shown are two “snapshots” of the simulation as diffusant concentration vs. axial and radial distances at two times under the assumption that Dy is equal to 0.05 Dr. (C) plots comparing theory and numerical simulations. The rate was calculated as integral of the concentration of diffusant in the bleached region using four approaches: two analytical solutions, with homogeneous or Gaussian bleaching (using SI Appendix, Eqs. S1 and S2), and two simulations assuming isotropic or anisotropic diffusion. The calculations show, as expected, that anisotropy in diffusion causes a sizable delay in recovery and, unexpectedly, a good agreement between the results of the detailed simulation with anisotropy and the analytical solution for a homogeneously bleached region. A similar agreement with the Gaussian bleaching solution required halving D in the simulation, which implies that the FRAP rate predicted using the Gaussian assumption is too fast by a factor of 2. A suitable correction for this error is provided in SI Appendix, Eq. S7.
Calcium Biosensors Used as FRAP Probes.
To have a measure of [Ca2+]SR simultaneous with FRAP, we used as FRAP probe the calcium biosensor D4cpV-Casq1 (24). For comparison with the results obtained with EYFP-Casq1, some experiments were done on Casq-null mice. Most, however, were done on WT mice; therefore, the exogenous Casq1 (which was expressed at 2–5 μmol/L cytosol) was less than 10% of the total [estimated at 50 μM or greater (25, 26)]. The evolution of in a representative case is shown in Fig. 2D: Triangles plot [Ca2+]SR, which was reduced to ∼50% of the initial value by a depolarizing solution, and later to nearly zero by increasing concentrations of 4-chloro-M-cresol (4-CMC), a drug that opens the calcium release channel. The in region 1 (bleached at rest) was 0.8; the FRAP recovery time course was apparently not affected when [Ca2+]SR was decreased to 500 μM. After [Ca2+]SR was reduced further, increased, reaching a maximum of 3.1 in region 4 (bleached when [Ca2+]SR was nearly zero). Meanwhile, the “immobile fraction” (determined as described in Methods) was reduced to zero, which implies that all of the tagged Casq1 became mobile.
Bleaching in the four regions illustrated in Fig. 2D was achieved with the same amount of irradiation. Additional obvious evidence of the increase in mobility is the change in the value of , the first recorded value of fluorescence after the bleaching irradiation is applied. The monotonic increase of in the successively bleached regions (regions 1 to 4) reflects increased mobility, which resulted in greater recovery of fluorescence during the several seconds needed for irradiation and to switch from bleaching to the imaging mode. The same criterion is not applicable in cases (e.g., Fig. 2C) where the intensity of the bleaching irradiation was adjusted so that the comparison of rates was done at the same value of .
The calcium biosensor D1ER, which is not fused to calsequestrin, was used as an alternative FRAP probe and [Ca2+]SR reporter. In the example of Fig. 2E, increased slightly upon partial depletion (region 2, black) and twofold when [Ca2+]SR went under 100 µM (region 3, red). In the framework of the depolymerization hypothesis, the increase in mobility of D1ER indicates that the network of polymeric Casq1 hinders diffusion of proteins other than calsequestrin. The relative increase in diffusional mobility () in a variety of conditions is summarized in Fig. 2F. Both central measures and distribution outliers of this variable had values greater than the null effect (). An alternative analysis, which compares values pooled in different conditions, is shown in Table 1. From an average of 1.37 (1,000 s)−1, an estimate of 0.069 μm2⋅s−1 is derived for D of D4cpV-Casq1 in cells at rest. This value is extremely low, even for molecules diffusing inside the endoplasmic reticulum/SR.
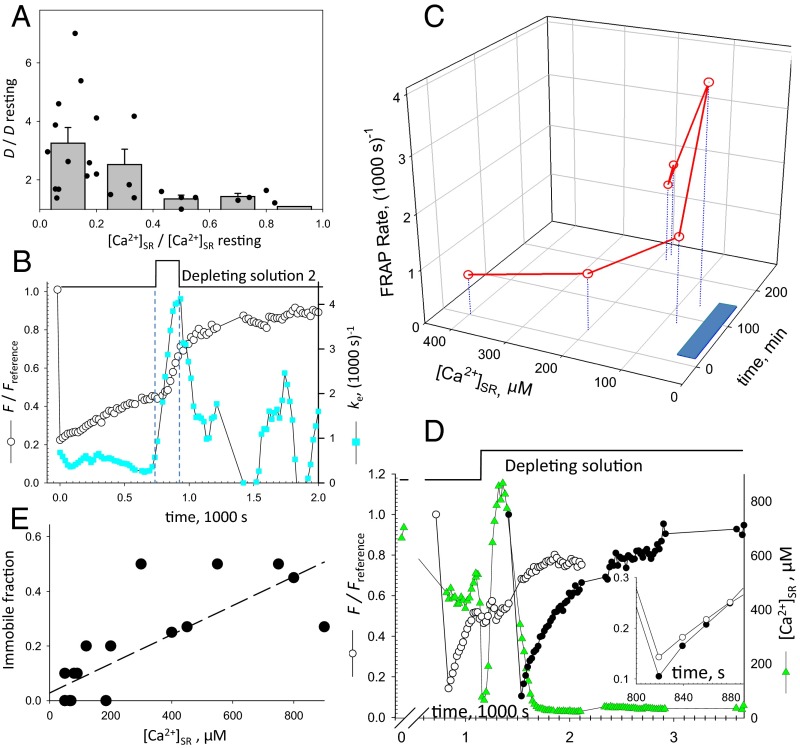
Other features of the change in mobility are illustrated in Fig. 3. Fig. 3A summarizes the relationship between the reduction in [Ca2+]SR (represented as a fraction of the initial value) and the magnitude of the effect, plotted for both individual experiments and their averages. The summary upholds the observation in the experiment of Fig. 2C that reduction in [Ca2+]SR below a threshold causes a large and abrupt increase in D. This threshold was near 200 μM, or about 40% of [Ca2+]SR at rest. The observed abrupt change at very low [Ca2+]SR did not preclude smaller, graded changes in D when [Ca2+]SR was closer to its value at rest.
Fig. 3.
FRAP indicators of reversible protein depolymerization (also Figs. S3C and S5). (A) Increase in FRAP rate of D4cpV-Casq1 () vs. reduction in [Ca2+]SR for individual experiments (symbols) and averages over 0.2-wide bins in abscissa. (B) Reversibility of the effect of exposure to solution 2. Circles represent the evolution of of EYFP-Casq1 in a bleached region. Note the change in the slope of recovery after solution change. Squares represent the normalized recovery rate , showing reversion of effect on washout. (C) Initial rate of D4cpV-Casq1 in six successively bleached regions, and simultaneously measured [Ca2+]SR. The blue bar on time axis marks the application of depleting solution 0. The rate increases as [Ca2+]SR slowly decreases, and recovers on washout. The large increase in lags behind the decay in [Ca2+]SR. (D) Green symbols show that [Ca2+]SR undergoes a large oscillation upon exposure to solution 5 (additional examples are provided in Fig. S5). went from 0.85 in a cell at rest (open circles) to 1.8 upon depletion (filled circles. (Inset) Details of initial recovery. (E) Relationship between [Ca2+]SR and the immobile fraction of fluorescence, defined as , where is the limit value of at long times. The linear correlation coefficient ρ2 is 0.61.
Reversibility is a requirement for this change in Casq1, putatively depolymerization, to occur physiologically. We therefore checked whether the effects of depleting solutions on protein mobility were reversible. Fig. 3B graphs FRAP in a fiber expressing EYFP-Casq1 (open circles). The FRAP rate (i.e., the slope of the line determined by the open symbols) was initially low, as usual in a fiber at rest; it increased greatly upon exposure to solution 2 and appeared to decrease rapidly on washout. The evolution is best shown with the “normalized rate” (blue squares).
The return to low protein mobility required recovery from calcium depletion. This recovery is shown in the experiment of Fig. 3C, which consisted of measuring FRAP rate of D4cpV-Casq1 in six regions, bleached successively in the same muscle bundle under different conditions. The bundle was exposed to the reversible SERCA inhibitor 2.5-di(tert-butyl)-1,4-hydroquinone (TBQ) during the time marked by the blue bar, causing [Ca2+]SR to decrease slowly, whereas increased, up to fourfold after 2 h. The changes reversed partially upon washout.
Two other observations were indicative of calsequestrin depolymerization. Depleting solutions often produced an oscillation in [Ca2+]SR (examples are shown in Fig. 3D and Fig. S5). As shown in Fig. 3D, the oscillations started with a decay, followed by an upswing that surpassed the resting [Ca2+]SR value in some cases and a final fall to near zero. As illustrated in Fig. 3D and Fig. S5, the magnitudes of the upswing and initial decay were correlated, and both increased with the dose of 4-CMC. A large increase in [Ca2+]SR while calcium release channels are open can only be due to a large decay in SR calcium buffering power, such as the decay that follows full depolymerization of Casq1. The association between the magnitude of the upswing in [Ca2+]SR and its preceding dip suggests that the depletion is the cause of the polymeric network’s collapse.
Fig. S5.
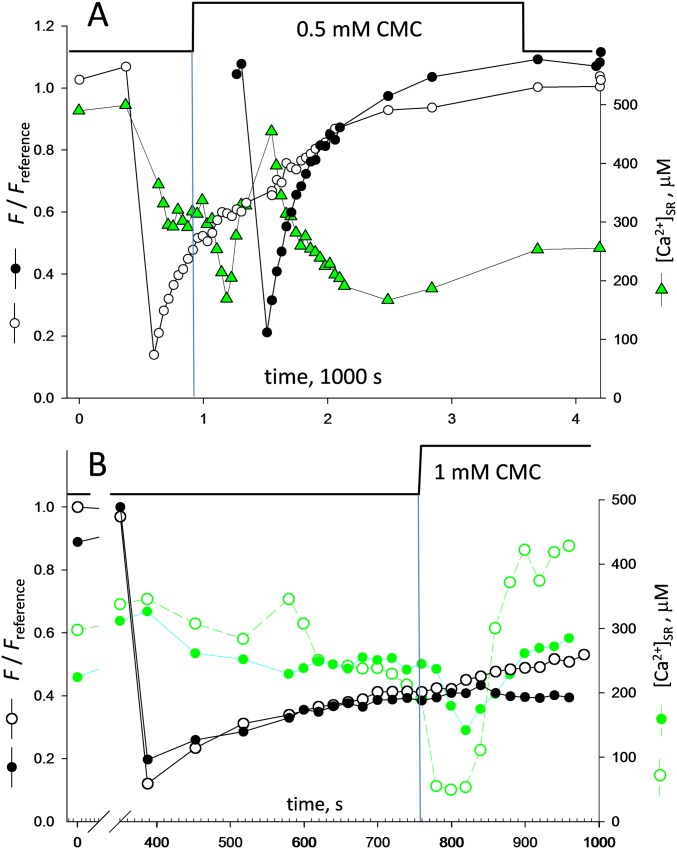
Examples of oscillations in [Ca2+]SR (supports Fig. 3D). (A) Example of oscillation of moderate amplitude in [Ca2+]SR. The oscillation was observed after the decay in [Ca2+]SR caused by the application of a depleting solution with a moderate concentration of 4-CMC. Compared with the case illustrated in Fig. 3D, the initial dip in [Ca2+]SR is less steep, and so is the ensuing surge. (B) Two myofibers were imaged in the same field and were bleached simultaneously. Upon application of a depleting solution, the fibers responded differently, perhaps because the depleting drug reached them at different rates. In both fibers, [Ca2+]SR oscillated (green symbols, open or filled); again, the depth and steepness of the initial decay correlated positively with the reach of the surge that followed. Note also that FRAP recovery, which had progressed to a similar extent in both fibers before depletion, evolved differently afterward, with fluorescence undergoing further recovery only in the fiber that experienced the greater oscillation (open circles).
In nearly every experiment, a fraction of the bleached fluorescence was unrecoverable (examples are shown in Figs. 2 C and D and 3 B and D). As documented in the collective plot of Fig. 3E, this fraction, which presumably represents Casq1 fully immobilized in the polymeric lattice, was large at high [Ca2+]SR and decreased with depletion, which is evidence of a weaker retention of Casq1 in the lattice.
These observations indicate that up to 60% of the tagged protein is immobile in the time scale of our experiments in cells at rest, and that part of it becomes mobile as [Ca2+]SR is reduced. When the depletion is slow in onset, the increase in mobility is gradual and reversible. When the depletion is fast, the oscillation in free [Ca2+]SR suggests widespread collapse of the calsequestrin network, leading to sudden loss of calcium buffering capacity and a corresponding surge in [Ca2+]SR.
Electrical Stimulation Increased Calsequestrin Mobility.
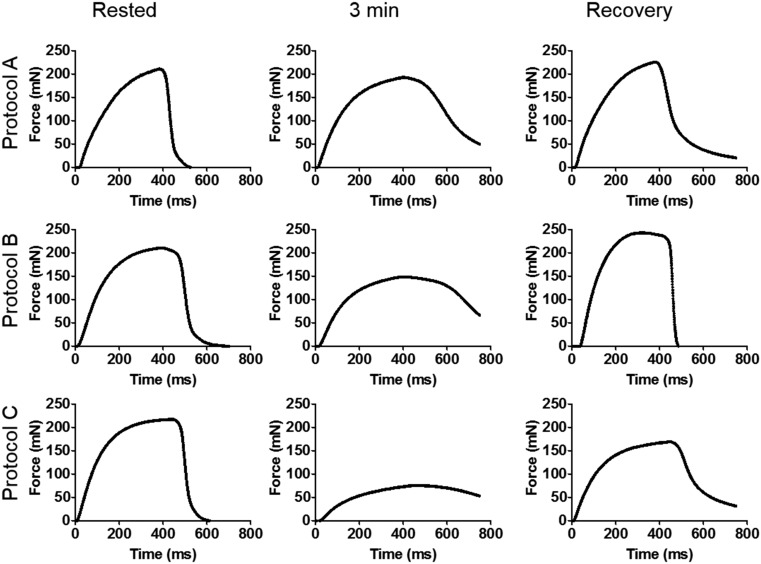
SR depletion was also induced by “fatiguing” field stimulation patterns, confirmed to cause mechanical fatigue in separate experiments (Fig. S6). Fatiguing stimulation achieved a reduction in [Ca2+]SR of 30–40% in 20 min of application and caused a twofold to threefold increase in . However, for the reduction in [Ca2+]SR to be sustained while FRAP was measured, stimulation had to continue, often resulting in movement. In alternative experiments, a low dose of the SERCA inhibitor cyclopiazonic acid (CPA; 0.5 mM) was added to Tyrode. Fatiguing stimulation then caused a decrease in [Ca2+]SR that was larger (nearly 70% of resting value) and sustained, so that stimulation could be stopped during FRAP measurement. The increase in calsequestrin mobility in these tests was similar to the increase in mobility induced with depleting drugs ( = 3.3; Fig. 2F).
Fig. S6.
Stimulation protocols cause mechanical fatigue (supports Figs. 2F and 6 and Table 1). The field stimulation patterns used in FRAP experiments described in the main text were tested for mechanical effects in separated experiments, with the results shown. FDB muscles dissected from adult mice (killed by protocols described in Methods) were placed in a Tyrode bath at 23 °C, suspended between an ergometer motor (Cambridge Technology Model 352) and a fixed post using 4-0 silk thread. The muscle length was adjusted to optimal by administering a series of tetanic contractions (supramaximal voltage applied via platinum wire electrodes using a 100-Hz train of 800 ms) and selecting the length and resting tension that elicited peak force. The muscle was then stimulated with pulses of 0.5-ms duration for 5 min with one of three protocols: protocol A: 40-Hz, 350-ms trains delivered once every 3 s; protocol B: 60-Hz, 350-ms trains delivered once every 3 s; and protocol C: 70-Hz, 500-ms trains delivered once every 2 s. Force signals were acquired every 10 s, starting at time = 0 min, referred to as the “Rested” condition. Following application of the fatiguing set of stimuli, the muscle was rested for 10 min before the stimulation was applied to record recovery. In FRAP experiments, which were conducted under similar conditions except for the use of thin bundles of fibers instead of whole muscles, protocol B was applied with slight adjustments (including a reduction in frequency to 50 Hz when we found evidence of action potential failure or an increase in duty cycle to up to 50% to increase the observed depletion).
Displacement of Calsequestrin Demonstrated by Imaging.
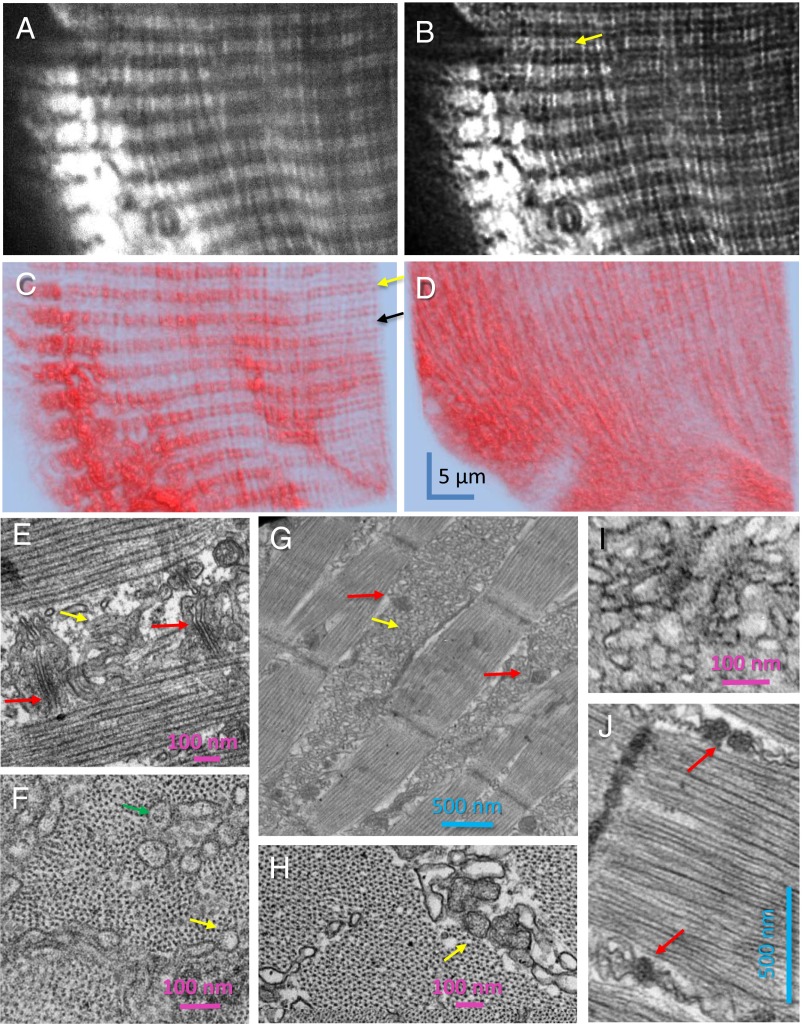
Fig. 4 shows D4cpV-Casq1 fluorescence in the muscle of a WT mouse before and after chemical depletion, together with EM images of the same muscle. In Fig. 4A is one member of a “z-stack,” consisting of 30 images at 100 nm of vertical separation. The numerical aperture of the objective, voxel dimensions, and confocal pinhole radius were all set to optimize spatial resolution. Fig. 4B is the result of deblurring Fig. 4A (a procedure that uses all members of the stack), and Fig. 4C is a 3D rendering of the deblurred stack. The images confirm the observation (24) that in cells at rest, D4cpv-tagged Casq1 resides mostly in two bands per sarcomere. Fluorescence costaining (23, 24) has shown that the bands correspond to triads, each with two TC not resolved in these images. The narrow and wide spaces between these calsequestrin bands correspond respectively to the I and A bands of the sarcomere (24).
Fig. 4.
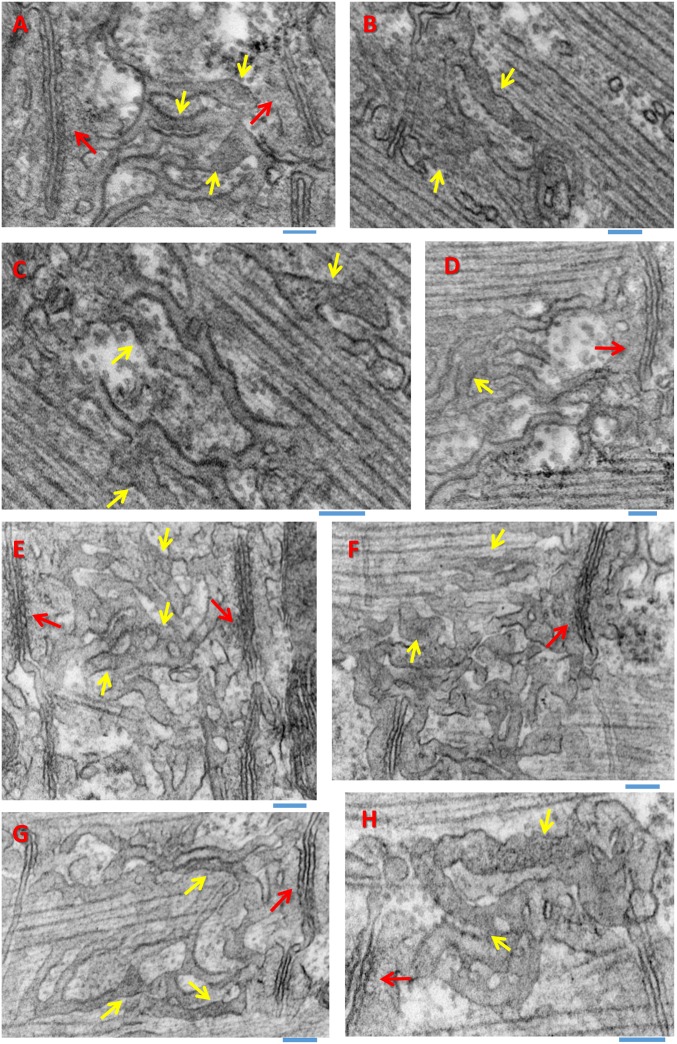
Consequences of depletion on SR structure (also Figs. S7 and S8). (A–D) D4cpV-Casq1 images with a high numerical aperture oil immersion objective. One image of a 30-image z-stack, raw (A) and deblurred (B), showing the double-band location of Casq1. (C) Three-dimensional rendering of the deblurred stack by the simulated fluorescence process algorithm. The yellow arrow indicates the location of the Z disk at the center of the double band (24). The black arrow marks the center of the A band. (D) Three-dimensional rendering of a z-stack acquired on same myofiber after 20 min in solution 5. (E) Representative EM image of a longitudinal section of a resting myofiber, showing triads (red arrows) constituted by two TC with dense granular content and a transverse tubule, and longitudinal SR cisternae, which usually appear empty (yellow arrow) or with finely granular content. (F) Transversal section of resting fiber near the Z disk showing sectioned longitudinal SR elements, which may be empty (yellow arrow) or may show granular content (green arrow) suggesting an extratriadic location of Casq1. (G and H) Sections from the muscle in A–D imaged after depletion. Large aggregations of membrane in intermyofibrillar spaces, corresponding to the longitudinal structures formed by fluorescent Casq1 in D, are shown in G and I. The cross-section in H, comparable to F, includes interfibrillar elements with calsequestrin-like content (arrow). (I and J) High-magnification views in a second muscle, equally treated. The details of altered triads in J (red arrows), visible also in G, allow identification of the intricate membrane structures as SR. Additional details are provided in Fig. S8.
The effect of deep depletion is demonstrated in Fig. 4D, a 3D rendering of a z-stack acquired on the same fiber after exposure to solution 5. The treatment, which reduced [Ca2+]SR to between 0 and 20 μM in three experiments, caused a major relocation of the fluorescent species into largely longitudinal structures.
The nature of these structures was explored in EM images of sections of the same depleted muscles. Fig. 4E, from a muscle at rest expressing the biosensor, shows the normal arrangement of triads (indicated here and elsewhere by red arrows). Calsequestrin is visible as the granular content of the two TC in a triad (27, 28) and is mostly absent in longitudinal SR (indicated by the yellow arrow in Fig. 4E). In cross-sections (Fig. 4F), the longitudinal SR is largely empty (yellow arrow), but it occasionally exhibits calsequestrin-like granular content as well (green arrow), particularly at the level of the I band as illustrated here. Fig. 4 G and H show longitudinal and transversal sections from the muscle in Fig. 4 A–D, fixed after depletion. The images in Fig. 4 G and H show intermyofibrillar spaces occupied by a labyrinthine array of membranes with an occasional granular content, presumably representing polymerized Casq1 (yellow arrows; details are shown in Fig. 4 I and J). The array of membranes includes denser areas, often in pairs, which are recognizable by size and placement as remnants of triads, devoid of their transverse tubule (red arrows in Fig. 4 G and J). The presence of these elements identifies the intermyofibrillar array of membranes as displaced, morphologically altered SR. By shape, size, and orientation, they correspond to the longitudinal structures in the fluorescence images. Because it is visible by fluorescence, the content in these structures must include D4cpV-Casq1. As explained in an earlier section, the exogenous Casq1 is, on average, not more than 10% of the endogenous Casq1; therefore, the massive displacement of volume and content from triadic toward intermyofibrillar structures must involve the native Casq1 as well.
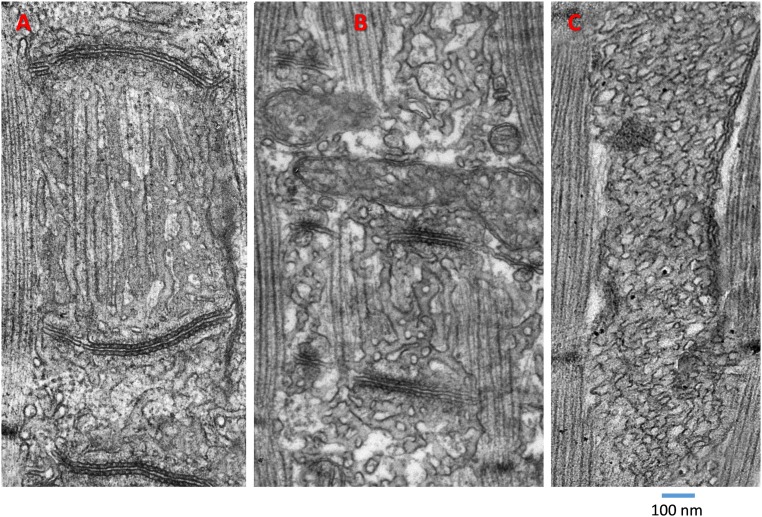
The intricacy of the SR structures in the depleted cells gives the impression of growth in SR area. To test this possibility, we computed the ratio of intersected SR membrane length and image area, which is equivalent to SR membrane area density [area per unit volume (29)]. Details of the comparison are provided in Fig. S8. The SR area density was smaller in the depleted condition, albeit not significantly so. The result of the comparison suggests redistribution of SR membrane upon deep Ca2+ depletion.
Fig. S8.
Example images used to quantify SR membrane area density (supports Figs. 4–6). (A) Image from control muscle. (B) Muscle treated with solution 1 (causing mild depletion). (C) Muscle treated with solution 5 (full depletion). The length of every continuous SR membrane intersection visible in regions like those regions pictured was measured, and the sum was normalized to the area of the image. Ratios obtained in this way in five regions in five sections from the same or comparably treated muscles were averaged. The results were 23.5 (μm)−1 (SEM = 2.21) in control images and 20.1 (μm)−1 (SEM = 3.97) in fully depleted cells (the comparison was not extended to mildly depleted cells). The difference is not significant.
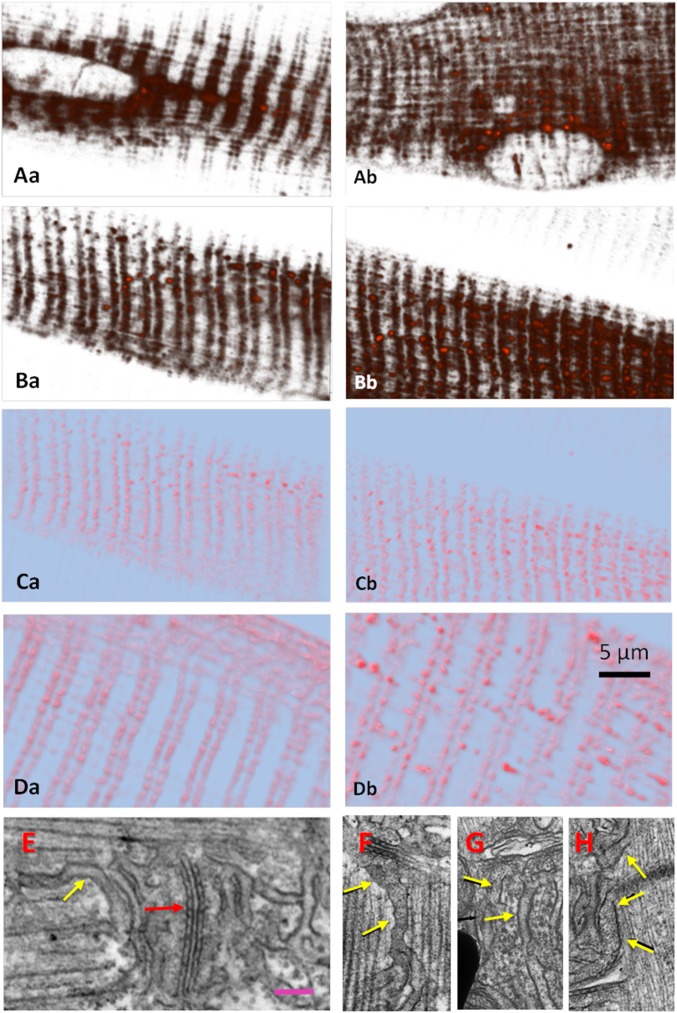
The structural consequences of milder depleting solutions are documented in Fig. 5. Fig. 5 A–D compares fluorescence in the same fiber before (Fig. 5 A, a–D, a) and after (Fig. 5 A, b–D, b) treatment with solution 2, which caused a reduction in [Ca2+]SR to less than 40% of its resting value. Fig. 5 A and B shows unprocessed z-stacks. Fig. 5 A, a–B, b shows collective views of the stacks, generated by overlapping all sections. Fig. 5 A, b and B, b shows that the treatment results in blurring of the distribution of fluorescence, which moves slightly away from triads. Fig. 5 C and D, comparing the effects of exposures of different duration to the same solution, shows that the displacement becomes more evident as exposure time increases.
Fig. 5.
Structural effects of a mild depleting solution (also Fig. S8). (A and B) Transparency presentations of z-stacks of D4cpV-Casq1 high-resolution images in two WT myofibers at rest (a) and after 15 min in solution 2 (b). (C, a and b) Three-dimensional renderings of the stacks in B, a and b, after deblurring. (D) Three-dimensional renderings of stacks from a different myofiber at rest and after 30 min in solution 2. Longer exposure times allow greater displacements of the tagged protein. (E) EM image of a longitudinal section in resting muscle, showing granular content in triadic SR cisternae (red arrow) and longitudinal SR with homogeneous, lightly stained content (yellow arrow). (F–H) Images of solution 2-treated muscles, showing granular content in extratriadic SR (yellow arrows). The bar in E, valid for panels E–H, spans 100 nm.
The effects of this milder treatment were also explored with electron microscopy. Fig. 5E illustrates a WT myofiber at rest, expressing D4cpV-Casq1. Two TC in the image (Fig. 5E, red arrow) have granular content, previously identified as polymeric calsequestrin, whereas longitudinal SR elements appear empty or have unstructured content (Fig. 5E, yellow arrow). Fig. 5 F–H is from different muscles fixed after 25 min in solution 2; these images illustrate the observation of Casq1-like granular content in longitudinal SR (arrows), which, however, was not very frequent. The occasional presence of such content in extratriadic SR of untreated muscle, plus the abundance of SR elements with content of ambiguous density and texture (Fig. S7), made it impossible to decide, based on EM images alone, whether the depleting treatment caused a significant increase in extratriadic Casq1.
Fig. S7.
Casq1-like content in extratriadic SR (supports Figs. 4–6). (A–C) Examples of cisternae with granular content attributed to polymeric Casq1. Red arrows indicate their presence in TC, and yellow arrows indicate their presence in longitudinal extratriadic SR cavities. (D) Arrows indicate examples of SR content of an ambiguous nature. In all cases, muscles had not been stimulated or subjected to chemical depletion. (E–H) Examples of structure in muscles fixed after fatiguing stimulation that led to partial depletion ([Ca2+]SR measured at 45% of resting level 5 min before fixation). The granular content outside triads, again indicated by yellow arrows, appears to be greater in the stimulated cells, but the abundance of SR cisternae with ambiguous content precluded the quantification of differences. (Scale bars: 0.1 μm.)
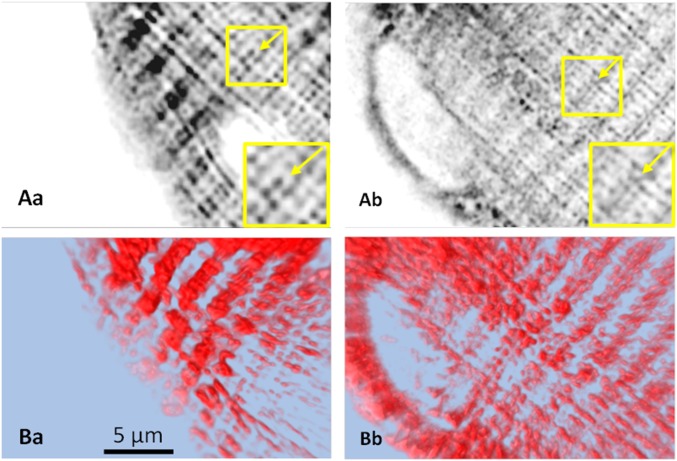
The structural effects of fatiguing stimulation are illustrated in Fig. 6. As stated before, stabilizing the depletion due to tetanic activity required stimulating in the presence of CPA. Images in Fig. 6 compare the same myofiber before (Left) and after (Right) stimulation. The pattern changed subtly, from having two triadic bands per sarcomere at rest (as in Fig. 5 A, a–D, a) to a more diffuse appearance consistent with displacement of the protein. In these and other images obtained similarly, the displaced calsequestrin appears to occupy preferentially the narrow space between triadic bands, marked by a yellow arrow in Fig. 6 A, a and b, a space known to correspond to the sarcomeric I band (24).
Fig. 6.
Structural effects of fatiguing stimulation. (A) Deblurred high-resolution images of D4cpV-Casq1 in z-stacks of the same cell at rest (a) and after 20 min of application of stimulation pattern 2 in Tyrode with 0.5 mM CPA (b). (Inset) Arrows in A in the boxed region magnified indicate location of the Z disk relative to the double-band pattern of tagged Casq1 expression. After stimulation, this region is occupied by a band of fluorescence. (B, a and b) Three-dimensional rendering of same stacks.
EM images of myofibers fixed after fatiguing stimulation (shown in Fig. S8) have clear examples of displaced Casq1: extratriadic SR with dense granular content. There are also many examples where it is not clear whether the content visible inside SR elements can be attributable to Casq1. Seeking a clearer distinction, we compared systematically images of transversal sections (as in Fig. 4 F and H), but we did not find significant differences in the frequency of “filled” SR elements between resting and stimulated muscles.
Discussion
Being a calcium-binding protein, calsequestrin might have a number of signaling roles; its sole demonstrated function in cells, however, is reversible calcium storage (19, 25). Calsequestrin’s unique buffer properties appear well-suited for this role; they include a high calcium-binding capacity and a buffering power B that increases at increasing [Ca2+], as reflected in a binding curve of positive curvature (or cooperativity > 1). In studies in vitro, the increase in B occurs in the same range of [Ca2+] that induces polymerization (6, 30), which implies that polymerization is crucial for effective buffering. The potential implications for physiology of this property (reviewed in ref. 2) have been the subject of much speculation, all of which remains untested.
Calsequestrin Undergoes Major Conformational Changes upon Calcium Release.
Given that Casq1 provides much of the calcium that signals muscle contraction (25, 26), the buffering features found in solution should transfer to the storage properties of the SR in cells. Indeed, strongly cooperative calcium buffering by the SR was first documented by Pape et al. (31), who showed with frog muscle that the calcium buffering power of the empty SR is negligible compared with the value at rest, a property they attributed to calsequestrin. Working on mouse muscle, Royer et al. (19) confirmed the attribution, quantified the contribution by Casq1 at 75% of released calcium (26), and equated it to the hump of calcium flux caused by a large depolarization (19). Here, we characterized this component further (Fig. 1), showing that it becomes unavailable at short times after one occurrence and that its restoration proceeds more slowly than recovery of free [Ca2+]SR, and is therefore not limited by it. The delay implies that Casq1 undergoes major changes in conformation when cycling calcium on and off, and that the off change disables its function temporarily. The observation is consistent with the notion that calsequestrin must polymerize to achieve high-capacity calcium binding and depolymerize as it loses bound calcium.
Diffusional Mobility of Casq1 Increases upon Depletion of Calcium in SR.
The present FRAP measurements show that the mobility of Casq1 inside the SR increases several fold upon reduction in [Ca2+]SR. That the effect is graded with [Ca2+]SR and accompanies depletion induced by diverse means indicates that it is due to the reduction in [Ca2+]SR rather than the interventions that lowered it. That the observed change is reversible, conditional on reversion of the change in [Ca2+]SR, also evinces a causal link between depletion and the increase in mobility.
The Changes in Calsequestrin Mobility Are Explained by Its Depolymerization.
Both the changes in mobility and the exhaustion and delayed recovery of the hump of calcium release can be justified simply as consequences of depolymerization of Casq1 upon [Ca2+]SR depletion. To begin with, Casq1 appears to be polymerized in the cell at rest. Mean initial rates of recovery, , of D4cpV-Casq1 fluorescence were 0.63 and 1.37, respectively, in WT and calsequestrin-null mice (Fig. 3F and Table 1). A value of 1 for corresponds to D = 0.05 µm2⋅s−1 (SI Appendix and Figs. S3 and S4). This value is extremely low in comparison to other large molecules inside the endoplasmic reticulum [e.g., 0.5 µm2⋅s−1 for elastase-GFP (32), reviewed in ref. 33].
The low estimates of D and the observation that tagged Casq1 is partly immobile agree with the consensus that Casq1 constitutes the dense polymeric network visible inside TC in EM images (9, 27). The detailed similarity in structure of calsequestrin polymers in crystals (12) and in vivo (34) provides additional evidence and supports the extrapolation to cells of calsequestrin properties observed in solution, including the close association between polymerization and calcium binding.
That the increase in probe mobility upon [Ca2+]SR reduction is accompanied by a decrease of the immobile fraction of fluorescence (Fig. 3E), that it takes longer than the changes in [Ca2+]SR (Fig. 3C), and that it appears to accelerate at [Ca2+]SR below a threshold (Fig. 3A) are all indications that the polymeric network weakens and eventually comes apart upon depletion. That the mobility of another protein, D1ER, is also increased (Fig. 2 E and F) shows that a barrier to diffusion of all large molecules is lowered when [Ca2+]SR falls, consistent with weakening of a structure that fills the TC.
A large-scale change in the calsequestrin lattice upon major depletion also explains the production of [Ca2+]SR upswings (presumably by calcium that massively leaves the calsequestrin network as it disassembles) and specifically justifies the observed correlation between amplitude of intra-SR transients and strength of the depleting stimulation. Intra-SR calcium transients were first reported in vesicular SR fractions (35) and studied in detail in the rat (36). With simultaneous measurements of FRAP rate and [Ca2+]SR, we now show that they coexist with an increase in Casq1 mobility, confirming that they are associated with and, in all likelihood, due to changes in the polymeric network of Casq1, as proposed by Launikonis et al. (37).
Tagged Casq1 Moves Away from TC upon Depletion.
The change in the mobility and polymerization state of Casq1 should allow its movement away from TC into extratriadic SR. Such movement was observed in images of muscles depleted pharmacologically (Figs. 4 and 5). The EM images of SR structures, in which polymerized Casq1 is visible as dense granular content, demonstrated massive movement in muscles treated with high 4-CMC (e.g., Fig. 4G). In these muscles, the gross morphology of the SR changed, in agreement with the notion that polymerized calsequestrin is a determinant of normal SR morphology in skeletal and cardiac muscle (38, 39).
There were no obvious changes in EM images of muscles subjected to the milder depleting solution 2, even though the fluorescently tagged Casq1 was displaced (Fig. 5). The discrepancy may reflect a requirement of polymerization for calsequestrin to be visible in EM images. EM visualization of displaced calsequestrin may therefore be limited to conditions in which dissociated calsequestrin migrates away from triads and reconstitutes polymers elsewhere or the polymeric network breaks into pieces that can diffuse, conditions only met in muscles treated with the higher dose of 4-CMC. Such rearrangements are probably irreversible and unlikely to occur physiologically.
Fatiguing Stimulation Causes Minor Displacement of Casq1.
Tetanic stimulation caused moderate, rapidly recovering SR depletion. Mobility increased in these cases, but its evaluation required maintaining the stimuli during FRAP, which elicited contractions and required continued perfusion, both sources of artifact. A greater increase in mobility was recorded after electrical stimulation in the presence of CPA, which made the depletion sustained, so that FRAP rates could be determined without movement artifact. The magnitude of the increase in mobility was then comparable to the magnitude caused by chemical depletion (Fig. 2F). By contrast, a systematic examination of EM images of transversal sections of electrically stimulated muscles found no changes in the dense content of longitudinal SR elements, identified as polymeric calsequestrin. This negative result is consistent with our failure to demonstrate displacement of dense content in EM images of cells subjected to mild depleting solutions and may again reflect the impossibility to visualize monomeric calsequestrin by EM. Therefore, we conclude that the Casq1 network is not grossly disassembled by fatiguing stimulation as applied here.
Findings in vitro help interpret the present observations; indeed, it has been shown that the crystal lattices of calsequestrin and their asymmetrical units establish order of longer range as [Ca2+] increases (18). Thus, upon moderate alteration of [Ca2+] and [K+], order may decrease or increase in a gradual manner, without total breakdown or reconstruction of the basic lattice. Extrapolating to cells, and in line with the observed limited displacement of Casq1 and the increase in its mobility, we propose that limited changes in [Ca2+]SR weaken the Casq1 network, without full disassembly.
The argument for gradual change, rather than a binary alternative of polymerization or depolymerization, can also be cast in terms of diffusion with binding. If the binding affinity K of Casq1 to the fixed polymeric network decreases in a continuous manner as [Ca2+] is reduced, the effective diffusion coefficient of Casq1, , will increase gradually as [Ca2+] and K decrease.
Casq1 Depolymerization as a Possible Contributor to Muscle Fatigue.
Depletion of calcium in the SR is believed to contribute to muscle fatigue because it reduces the [Ca2+] gradient driving calcium release, possibly reducing contractile activation (e.g., ref. 40). The present results suggest a second mechanism: The changes in the Casq1 network induced by the mild depletion associated with fatiguing activity will reduce the buffering power of the SR, and thus contribute to the reduction in calcium flux.
A Self-Protecting Calsequestrin Switch on Calcium Release?
Sztretye et al. (20) showed that long-lasting membrane depolarization in myofibers under voltage clamp causes only partial calcium store depletion; their finding is in agreement with the present evidence that depolymerization may be graded and remains limited during normal muscle function. The same work showed that depletion is partial because RyR channels close before the SR is fully depleted. The closure may be mediated by Casq, because in Casq-null muscles, RyRs stay open, allowing for full depletion. Here, we show that complete depletion often leads to abrupt, large-scale depolymerization (as reflected in the oscillations in [Ca2+]SR observed under these conditions; Fig. 3D and Fig. S5) and, ultimately, to major alterations in SR structure (Fig. 4). If, as proposed by Sztretye et al. (20), changes in the Casq1 lattice due to partial SR depletion constitute the conformational signal that close RyR channels, the ultimate benefit of this modulation would be to prevent both full emptying of the calcium store and catastrophic disassembly of the Casq1 network.
Polymerization Defects of Calsequestrin as Causes of Disease.
Studied in vitro, two disease-linked variants of Casq1, D244G (7) and M87T (41), show altered polymerization, which requires higher [Ca2+], leads to abnormal polymeric structure, and reduces calcium binding in solution in both cases (6). The present evidence that Casq1 undergoes depolymerization in vivo supports the view that muscle weakness in patients with the D244G mutation is due to reduced calcium storage and release (6, 42). Additionally, changes in the structure of the polymer (6) may explain the abnormal assembly of SR components characteristic of “surplus protein” or “vacuolar aggregate” myopathies (43, 44).
Although M87T is not causative of disease per se, it increases penetrance of RyR1 mutations linked to malignant hyperthermia (MH) (41), a disease characterized by events of uncontrolled calcium release that cause hyperpyrexia and rhabdomyolysis. We now show that conditions favoring RyR channel opening and rapid calcium release cause oscillations in [Ca2+]SR, presumably due to disassembly of the Casq1 lattice. As reported by Cully et al. (36), these [Ca2+]SR transients are regenerative; therefore, they may be a factor, as yet unrecognized, precipitating the MH event. Variants that destabilize the Casq1 lattice, including M87T (41), could aggravate the MH condition by this means.
The present findings have implications for cardiac physiology and disease. Depolymerization should be more complete in the heart, because the SR appears to deplete more fully there than in skeletal muscle (e.g., refs. 45, 46). Because TC are smaller in cardiac cells and connect more sparsely to longitudinal SR (47), the loss of calsequestrin (Casq2) from these TC would be limited and easier to reverse, even after full disassembly of the polymeric network. The present findings therefore support the idea that Casq2 detachment from cardiac couplons constitutes a signal for closing RyR2 channels and termination of SR calcium release (reviewed in ref. 48).
Disrupted polymerization has been demonstrated for three missense mutations of Casq2. Mutations R33Q and D307H, associated with a severe form of catecholaminergic polymorphic ventricular tachycardia, yield monomers that form an altered dimer, whereas mutant L167H has a disrupted hydrophobic core in an internal domain, resulting in random aggregates that do not respond to varying calcium concentration (17). These alterations will interfere with beat-to-beat cycling of calcium. Additionally, by interfering with Casq2 trafficking and retention in TC (49), weaker polymerization may explain the reduction in Casq2 content that accompanies most of its mutations (4). If, as suggested by the present results, polymerization and depolymerization are dynamic processes that repeat with every heartbeat, any hindrance to these processes will have repercussions on calsequestrin endowment and structural stability of the cardiac SR.
In sum, the present work establishes calcium-dependent polymerization and depolymerization of calsequestrin as a critical hub for modulation of function, trafficking, correct couplon assembly, stability of SR structure, and their alterations in human disease (50–52).
Methods
Preparation of Plasmids.
Preparation of plasmids was as described by Sztretye et al. (24). Briefly, two D4cpv fusion plasmids were assembled: D4cpV-Casq1, combining cDNA of mouse Casq1 (53) with pBAD/D4cpv (54), and EYFP-Casq1, combining fusion plasmid pEYFP-N1-dogCasq2 (55) and mouse Casq1 (53). The D1ER gene (56) was inserted in pcDNA3 for transfection.
Animal use protocols were found consistent with ethical standards and approved by the Institutional Animal Care Use Committee of Rush University. Transfection and isolation of muscle followed methods adapted from DiFranco et al. (57), and described by Royer et al. (19). Four to seven days after transfection, the animals were killed by CO2 inhalation, and FDB muscles were removed for imaging or functional studies. In experiments with single cells, the methods of cell separation and patch voltage clamping were as described (58).
Calcium Concentration Measurements.
Cytosolic transients were recorded in isolated cells under whole-cell patch-clamp with rhod-2 introduced via the patch pipette. The [Ca2+]cyto and calcium release flux were derived by conventional procedures (58) from line scan and x–y confocal images (SP2 acousto-optical beam splitter; Leica). Single-cell flux measurements were performed at 20–22 °C in “external” solution. The [Ca2+]SR was determined from suitable Förster resonant energy transfer (FRET) ratios, from which [Ca2+]SR was derived as published (24).
FRAP Measurements.
FRAP measurements were done in thin bundles dissected from FDB muscles and mounted in a custom 3D-printed chamber (Fig. 2A; patent PCT/US16/26097) designed to fit inside a 35-mm thermostatic jacket. Miniaturization, flow streamlining, and a built-in inlet manifold, made possible by the 3D printing technique, accomplish rapid, turbulence-free perfusion and solution exchange. Thin stainless wires attached eccentrically to rotary cylinders allow stretching and pressing the muscle bundle to the coverglass chamber bottom for immobilization (completed by BTS in the perfusing solution) and imaging with high numerical aperture objectives. Trains of stimuli applied with built-in platinum electrodes under continuous perfusion produce a measured current of steady amplitude. The chamber can be built to order (Department of Molecular Physiology and Biophysics, Loyola University, Chicago; available upon request from pjcaron@lumc.edu).
Muscles expressed Casq1 tagged by EYFP or the biosensors D4cpV-Casq1 or D1ER. Photobleaching was achieved by joint irradiation with 351-, 364-, and 488-nm laser lines at full power, high zoom, and repeated application, resulting in ∼40,000-fold the energy density of fluorescence excitation, which bleached ∼90% of fluorescence. FRAP was monitored by fluorescence of the bleached region, excited at 458 nm, and emitted in the 470- to 580-nm range. If the fibers moved during recovery, FRAP was evaluated using a custom program (FRAPAN_cdark.pro; code is available upon request), which located the center of mass of the bleached region. An extreme example of movement is illustrated in Movie S1, which is supplemental to Fig. 2B. The measured fluorescence, , is a function of time after bleaching. The commonly used metric to evaluate recovery, , where is fluorescence before bleaching, was replaced by , where , measured in a close unbleached region, may vary with time, thus correcting for long-term changes. Two metrics were used to evaluate mobility of the bleached species: the initial rate of change of , denoted as , and the normalized rate of recovery . We show in SI Appendix and Fig. S3 that is proportional to the effective diffusion coefficient of the fluorescent species, D. The relationship derived from theory is D = 0.05 μm2⋅s−1 × . Although provides a measure of D immediately after bleaching, the metric was defined to have a measure of D beyond the initial times ( would be the rate constant of the process if recovered as an exponential function of time). Again, from theory developed in SI Appendix, is expected to decay monotonically with time if D is constant.
The immobile fraction of fluorescence was calculated as , where is the final steady level of fluorescence, read directly from the measurements when reached a steady value (examples in Fig. 3D) or obtained from a fit (examples in Fig. 2D).
Solutions.
The measurements on single cells under voltage clamp used the external solution and the pipette solution containing BAPTA described by Sztretye et al. (24). FRAP measurements and imaging used Tyrode (58) and four depleting solutions named “0,” “2,” “5,” and “TBQ.” Solutions 0, 2, and 5 consisted of Tyrode plus 0.05 mM TBQ; 0.5 mM CPA; and 0, 2, or 5 mM 4-CMC. TBQ solution had 0.05 mM TBQ as the sole depleting drug. The contraction inhibitor BTS was present in all solutions at 0.05–0.1 mM. The pH was 7.2, and the osmolality was 320 mOsm. For fixation and EM imaging, the experimental solutions had 4% (vol/vol) glutaraldehyde added and aspartate substituted for glutamate.
High-Resolution Imaging of Fluorescence.
High-resolution imaging of fluorescence was done with EYFP-Casq1 or D4cpV-Casq1, combining high-intensity illumination, a high numerical aperture objective (coverglass-corrected, 1.4 numerical aperture, oil immersion, 63× magnification), optimal confocal pinhole size (1 Airy disk), collection of light in an extended range (470–580 nm), long integration time at each pixel (5 ms per 512 pixel line), and acquisition of z-stacks at oversampled x–y–z voxel dimensions (62 × 62 × 100 nm), which allowed for offline deblurring by all-neighbors deconvolution (59). For this purpose, the point spread function of the system was determined using 170-nm beads. FWHM was 350 nm in x–y and 480 nm in z. The deblurred set was represented or “rendered” in three dimensions using the “simulated fluorescence process” algorithm (60). Determination of the point spread function (PSF) of the imaging system, deblurring, and rendering were done in the HuPro (SVI) programming environment.
EM Imaging.
Extensor digitorum longus (EDL) muscles were fixed in the observation chamber and shipped to the EM laboratory. Upon arrival, bundles were postfixed in OsO4, stained with uranyl acetate, and embedded in Epon. Thin sections were imaged after staining with lead acetate. The techniques are detailed by Boncompagni et al. (9). Morphometry (determination of areas and lengths of membrane intersections) was done with ImageJ (NIH).
Quantification and Statistical Analysis.
Kinetic parameters of release flux (peak amplitude and hump area) were averaged in repeated trials in four to six separate animals. Peak flux vs. (t) in two-pulse experiments was fitted by a custom least-squares routine.
The significance of differences in (Table 1) were evaluated by two-tailed t tests of differences of averages. Additionally, the ratios (Fig. 2F) were evaluated nonparametrically for difference with a value of 1, corresponding to the null effect. The significance was established by range tests.
Software.
Release D4.pro is a computer program that calculates [Ca2+]cyto(t) from fluorescence images of cytosolic indicators. Ratio image series D4.pro is a computer program that calculates [Ca2+]SR(t) from FRET pairs of images. FRAPan_Cdark.pro calculates and associated metrics from series of fluorescence images. FRAPmodel PADE.pro and FRAPmodel Gauss.pro compute the analytical solutions for two FRAP models (Figs. S3 and S4). Diffusion bleach.pro computes FRAP numerically in models with realistic geometry. All programs are written in the IDL environment (Harris Geospatiale). All are available upon request.
Supporting Information.
Eight figures, SI Appendix (theory of FRAP) and one movie (Movie S1) time-lapse movie of FRAP sequence) have been provided to support this article.
Supplementary Material
Acknowledgments
We thank S. Györke (Ohio State University), D. H. Kim [Gwangju Institute of Science and Technology (GIST)], the late R. Y. Tsien, (University of California, San Diego), and A. E. Palmer (University of Colorado Boulder) for the gift of clones used in this work, and P. D. Allen (University of California, Davis) for the gift of calsequestrin-null mice. This work was supported by Grant GM111254 (to E.R. and C.K.) from the National Institute of General Medical Sciences, NIH. D.G. was supported by Grant AR054098 (to Michael Fill, Rush University) from the National Institute of Arthritis and Musculoskeletal and Skin Diseases, NIH.
Footnotes
The authors declare no conflict of interest.
This article contains supporting information online at www.pnas.org/lookup/suppl/doi:10.1073/pnas.1620265114/-/DCSupplemental.
References
- 1.MacLennan DH, Wong PT. Isolation of a calcium-sequestering protein from sarcoplasmic reticulum. Proc Natl Acad Sci USA. 1971;68(6):1231–1235. doi: 10.1073/pnas.68.6.1231. [DOI] [PMC free article] [PubMed] [Google Scholar]
- 2.Royer L, Ríos E. Deconstructing calsequestrin. Complex buffering in the calcium store of skeletal muscle. J Physiol. 2009;587(Pt 13):3101–3111. doi: 10.1113/jphysiol.2009.171934. [DOI] [PMC free article] [PubMed] [Google Scholar]
- 3.Novák P, Soukup T. Calsequestrin distribution, structure and function, its role in normal and pathological situations and the effect of thyroid hormones. Physiol Res. 2011;60(3):439–452. doi: 10.33549/physiolres.931989. [DOI] [PubMed] [Google Scholar]
- 4.Faggioni M, Knollmann BC. Calsequestrin 2 and arrhythmias. Am J Physiol Heart Circ Physiol. 2012;302(6):H1250–H1260. doi: 10.1152/ajpheart.00779.2011. [DOI] [PMC free article] [PubMed] [Google Scholar]
- 5.Maclennan DH, Zvaritch E. Mechanistic models for muscle diseases and disorders originating in the sarcoplasmic reticulum. Biochim Biophys Acta. 2011;1813(5):948–964. doi: 10.1016/j.bbamcr.2010.11.009. [DOI] [PubMed] [Google Scholar]
- 6.Lewis KM, Ronish LA, Ríos E, Kang C. Characterization of two human skeletal calsequestrin mutants implicated in malignant hyperthermia and vacuolar aggregate myopathy. J Biol Chem. 2015;290(48):28665–28674. doi: 10.1074/jbc.M115.686261. [DOI] [PMC free article] [PubMed] [Google Scholar]
- 7.Rossi D, et al. A mutation in the CASQ1 gene causes a vacuolar myopathy with accumulation of sarcoplasmic reticulum protein aggregates. Hum Mutat. 2014;35(10):1163–1170. doi: 10.1002/humu.22631. [DOI] [PMC free article] [PubMed] [Google Scholar]
- 8.MacLennan DH, Reithmeier RA. Ion tamers. Nat Struct Biol. 1998;5(6):409–411. doi: 10.1038/nsb0698-409. [DOI] [PubMed] [Google Scholar]
- 9.Boncompagni S, et al. Triadin/Junctin double null mouse reveals a differential role for Triadin and Junctin in anchoring CASQ to the jSR and regulating Ca(2+) homeostasis. PLoS One. 2012;7(7):e39962. doi: 10.1371/journal.pone.0039962. [DOI] [PMC free article] [PubMed] [Google Scholar]
- 10.Wang S, et al. Crystal structure of calsequestrin from rabbit skeletal muscle sarcoplasmic reticulum. Nat Struct Biol. 1998;5(6):476–483. doi: 10.1038/nsb0698-476. [DOI] [PubMed] [Google Scholar]
- 11.Adam G, Delbruck M. Reduction of dimensionality in biological diffusion processes. In: Rich A, Davidson N, editors. Structural Chemistry and Molecular Biology. Freeman; San Francisco: 1968. pp. 198–215. [Google Scholar]
- 12.Sanchez EJ, Lewis KM, Danna BR, Kang C. High-capacity Ca2+ binding of human skeletal calsequestrin. J Biol Chem. 2012;287(14):11592–11601. doi: 10.1074/jbc.M111.335075. [DOI] [PMC free article] [PubMed] [Google Scholar]
- 13.Allen DG, Lamb GD, Westerblad H. Skeletal muscle fatigue: Cellular mechanisms. Physiol Rev. 2008;88(1):287–332. doi: 10.1152/physrev.00015.2007. [DOI] [PubMed] [Google Scholar]
- 14.Sobie EA, Lederer WJ. Dynamic local changes in sarcoplasmic reticulum calcium: Physiological and pathophysiological roles. J Mol Cell Cardiol. 2012;52(2):304–311. doi: 10.1016/j.yjmcc.2011.06.024. [DOI] [PMC free article] [PubMed] [Google Scholar]
- 15.Ríos E, Figueroa L, Manno C, Kraeva N, Riazi S. The couplonopathies: A comparative approach to a class of diseases of skeletal and cardiac muscle. J Gen Physiol. 2015;145(6):459–474. doi: 10.1085/jgp.201411321. [DOI] [PMC free article] [PubMed] [Google Scholar]
- 16.Stern MD, Pizarro G, Ríos E. Local control model of excitation-contraction coupling in skeletal muscle. J Gen Physiol. 1997;110(4):415–440. doi: 10.1085/jgp.110.4.415. [DOI] [PMC free article] [PubMed] [Google Scholar]
- 17.Kim E, et al. Characterization of human cardiac calsequestrin and its deleterious mutants. J Mol Biol. 2007;373(4):1047–1057. doi: 10.1016/j.jmb.2007.08.055. [DOI] [PubMed] [Google Scholar]
- 18.Lewis KM, et al. Characterization of post-translational modifications to calsequestrins of cardiac and skeletal muscle. Int J Mol Sci. 2016;17(9):E1539. doi: 10.3390/ijms17091539. [DOI] [PMC free article] [PubMed] [Google Scholar]
- 19.Royer L, et al. Paradoxical buffering of calcium by calsequestrin demonstrated for the calcium store of skeletal muscle. J Gen Physiol. 2010;136(3):325–338. doi: 10.1085/jgp.201010454. [DOI] [PMC free article] [PubMed] [Google Scholar]
- 20.Sztretye M, et al. Measurement of RyR permeability reveals a role of calsequestrin in termination of SR Ca(2+) release in skeletal muscle. J Gen Physiol. 2011;138(2):231–247. doi: 10.1085/jgp.201010592. [DOI] [PMC free article] [PubMed] [Google Scholar]
- 21.Schneider MF, Simon BJ. Inactivation of calcium release from the sarcoplasmic reticulum in frog skeletal muscle. J Physiol. 1988;405:727–745. doi: 10.1113/jphysiol.1988.sp017358. [DOI] [PMC free article] [PubMed] [Google Scholar]
- 22.Jong DS, Pape PC, Baylor SM, Chandler WK. Calcium inactivation of calcium release in frog cut muscle fibers that contain millimolar EGTA or Fura-2. J Gen Physiol. 1995;106(2):337–388. doi: 10.1085/jgp.106.2.337. [DOI] [PMC free article] [PubMed] [Google Scholar]
- 23.Pouvreau S, et al. Ca(2+) sparks operated by membrane depolarization require isoform 3 ryanodine receptor channels in skeletal muscle. Proc Natl Acad Sci USA. 2007;104(12):5235–5240. doi: 10.1073/pnas.0700748104. [DOI] [PMC free article] [PubMed] [Google Scholar]
- 24.Sztretye M, et al. D4cpv-calsequestrin: A sensitive ratiometric biosensor accurately targeted to the calcium store of skeletal muscle. J Gen Physiol. 2011;138(2):211–229. doi: 10.1085/jgp.201010591. [DOI] [PMC free article] [PubMed] [Google Scholar]
- 25.Murphy RM, Larkins NT, Mollica JP, Beard NA, Lamb GD. Calsequestrin content and SERCA determine normal and maximal Ca2+ storage levels in sarcoplasmic reticulum of fast- and slow-twitch fibres of rat. J Physiol. 2009;587(2):443–460. doi: 10.1113/jphysiol.2008.163162. [DOI] [PMC free article] [PubMed] [Google Scholar]
- 26.Manno C, Sztretye M, Figueroa L, Allen PD, Ríos E. Dynamic measurement of the calcium buffering properties of the sarcoplasmic reticulum in mouse skeletal muscle. J Physiol. 2013;591(2):423–442. doi: 10.1113/jphysiol.2012.243444. [DOI] [PMC free article] [PubMed] [Google Scholar]
- 27.Franzini-Armstrong C, Kenney LJ, Varriano-Marston E. The structure of calsequestrin in triads of vertebrate skeletal muscle: A deep-etch study. J Cell Biol. 1987;105(1):49–56. doi: 10.1083/jcb.105.1.49. [DOI] [PMC free article] [PubMed] [Google Scholar]
- 28.Meissner G. Isolation and characterization of two types of sarcoplasmic reticulum vesicles. Biochim Biophys Acta. 1975;389(1):51–68. doi: 10.1016/0005-2736(75)90385-5. [DOI] [PubMed] [Google Scholar]
- 29.Weibel ER. Stereological principles for morphometry in electron microscopic cytology. Int Rev Cytol. 1969;26:235–302. doi: 10.1016/s0074-7696(08)61637-x. [DOI] [PubMed] [Google Scholar]
- 30.Park H, Wu S, Dunker AK, Kang C. Polymerization of calsequestrin. Implications for Ca2+ regulation. J Biol Chem. 2003;278(18):16176–16182. doi: 10.1074/jbc.M300120200. [DOI] [PubMed] [Google Scholar]
- 31.Pape PC, Fénelon K, Lamboley CRH, Stachura D. Role of calsequestrin evaluated from changes in free and total calcium concentrations in the sarcoplasmic reticulum of frog cut skeletal muscle fibres. J Physiol. 2007;581(Pt 1):319–367. doi: 10.1113/jphysiol.2006.126474. [DOI] [PMC free article] [PubMed] [Google Scholar]
- 32.Subramanian K, Meyer T. Calcium-induced restructuring of nuclear envelope and endoplasmic reticulum calcium stores. Cell. 1997;89(6):963–971. doi: 10.1016/s0092-8674(00)80281-0. [DOI] [PubMed] [Google Scholar]
- 33.Snapp EL, Altan N, Lippincott-Schwartz J. Measuring protein mobility by photobleaching GFP chimeras in living cells. Curr Protoc Cell Biol. 2003;21:Unit 21.1. doi: 10.1002/0471143030.cb2101s19. [DOI] [PubMed] [Google Scholar]
- 34.Perni S, Close M, Franzini-Armstrong C. Novel details of calsequestrin gel conformation in situ. J Biol Chem. 2013;288(43):31358–31362. doi: 10.1074/jbc.M113.507749. [DOI] [PMC free article] [PubMed] [Google Scholar]
- 35.Ikemoto N, Antoniu B, Kang JJ, Mészáros LG, Ronjat M. Intravesicular calcium transient during calcium release from sarcoplasmic reticulum. Biochemistry. 1991;30(21):5230–5237. doi: 10.1021/bi00235a017. [DOI] [PubMed] [Google Scholar]
- 36.Cully TR, Edwards JN, Launikonis BS. Activation and propagation of Ca2+ release from inside the sarcoplasmic reticulum network of mammalian skeletal muscle. J Physiol. 2014;592(17):3727–3746. doi: 10.1113/jphysiol.2014.274274. [DOI] [PMC free article] [PubMed] [Google Scholar]
- 37.Launikonis BS, et al. Depletion “skraps” and dynamic buffering inside the cellular calcium store. Proc Natl Acad Sci USA. 2006;103(8):2982–2987. doi: 10.1073/pnas.0511252103. [DOI] [PMC free article] [PubMed] [Google Scholar]
- 38.Paolini C, et al. Reorganized stores and impaired calcium handling in skeletal muscle of mice lacking calsequestrin-1. J Physiol. 2007;583(Pt 2):767–784. doi: 10.1113/jphysiol.2007.138024. [DOI] [PMC free article] [PubMed] [Google Scholar]
- 39.Tijskens P, Jones LR, Franzini-Armstrong C. Junctin and calsequestrin overexpression in cardiac muscle: The role of junctin and the synthetic and delivery pathways for the two proteins. J Mol Cell Cardiol. 2003;35(8):961–974. doi: 10.1016/s0022-2828(03)00181-0. [DOI] [PubMed] [Google Scholar]
- 40.Allen DG, Lamb GD, Westerblad H. Impaired calcium release during fatigue. J Appl Physiol 1985. 2008;104(1):296–305. doi: 10.1152/japplphysiol.00908.2007. [DOI] [PubMed] [Google Scholar]
- 41.Kraeva N, et al. CASQ1 gene is an unlikely candidate for malignant hyperthermia susceptibility in the North American population. Anesthesiology. 2013;118(2):344–349. doi: 10.1097/01.anes.0000530185.78660.da. [DOI] [PubMed] [Google Scholar]
- 42.D’Adamo MC, et al. A calsequestrin-1 mutation associated with a skeletal muscle disease alters sarcoplasmic Ca2+ release. PLoS One. 2016;11(5):e0155516. doi: 10.1371/journal.pone.0155516. [DOI] [PMC free article] [PubMed] [Google Scholar]
- 43.Morandi L, et al. A benign vacuolar myopathy with dilated sarcoplasmic reticulum cisternae positive to Serca 1 and calsequestrin. Neuromuscul Disord. 2000;10:384. [Google Scholar]
- 44.Tomelleri G, et al. SERCA1 and calsequestrin storage myopathy: A new surplus protein myopathy. Brain. 2006;129(Pt 8):2085–2092. doi: 10.1093/brain/awl128. [DOI] [PubMed] [Google Scholar]
- 45.Stern MD, Ríos E, Maltsev VA. Life and death of a cardiac calcium spark. J Gen Physiol. 2013;142(3):257–274. doi: 10.1085/jgp.201311034. [DOI] [PMC free article] [PubMed] [Google Scholar]
- 46.Zima AV, Picht E, Bers DM, Blatter LA. Termination of cardiac Ca2+ sparks: Role of intra-SR [Ca2+], release flux, and intra-SR Ca2+ diffusion. Circ Res. 2008;103(8):e105–e115. doi: 10.1161/CIRCRESAHA.107.183236. [DOI] [PMC free article] [PubMed] [Google Scholar]
- 47.Brochet DXP, et al. Ca2+ blinks: Rapid nanoscopic store calcium signaling. Proc Natl Acad Sci USA. 2005;102(8):3099–3104. doi: 10.1073/pnas.0500059102. [DOI] [PMC free article] [PubMed] [Google Scholar]
- 48.Györke S, Stevens SCW, Terentyev D. Cardiac calsequestrin: Quest inside the SR. J Physiol. 2009;587(Pt 13):3091–3094. doi: 10.1113/jphysiol.2009.172049. [DOI] [PMC free article] [PubMed] [Google Scholar]
- 49.McFarland TP, Milstein ML, Cala SE. Rough endoplasmic reticulum to junctional sarcoplasmic reticulum trafficking of calsequestrin in adult cardiomyocytes. J Mol Cell Cardiol. 2010;49(4):556–564. doi: 10.1016/j.yjmcc.2010.05.012. [DOI] [PMC free article] [PubMed] [Google Scholar]
- 50.Axelrod D, Koppel DE, Schlessinger J, Elson E, Webb WW. Mobility measurement by analysis of fluorescence photobleaching recovery kinetics. Biophys J. 1976;16(9):1055–1069. doi: 10.1016/S0006-3495(76)85755-4. [DOI] [PMC free article] [PubMed] [Google Scholar]
- 51.Bender C, Orszag S. Summation of series. In: Bender C, Orszag S, editors. Advanced Mathematical Methods for Scientists and Engineers. McGraw–Hill; New York: 1978. pp. 383–410. [Google Scholar]
- 52.Padé H. Sur la répresentation approchée d’une fonction par des fractions rationelles. Annales scientifiques de l'École Normale Supérieure. 1892;9(3):1–93. French. [Google Scholar]
- 53.Shin DW, Ma J, Kim DH. The asp-rich region at the carboxyl-terminus of calsequestrin binds to Ca(2+) and interacts with triadin. FEBS Lett. 2000;486(2):178–182. doi: 10.1016/s0014-5793(00)02246-8. [DOI] [PubMed] [Google Scholar]
- 54.Palmer AE, et al. Ca2+ indicators based on computationally redesigned calmodulin-peptide pairs. Chem Biol. 2006;13(5):521–530. doi: 10.1016/j.chembiol.2006.03.007. [DOI] [PubMed] [Google Scholar]
- 55.Terentyev D, et al. Calsequestrin determines the functional size and stability of cardiac intracellular calcium stores: Mechanism for hereditary arrhythmia. Proc Natl Acad Sci USA. 2003;100(20):11759–11764. doi: 10.1073/pnas.1932318100. [DOI] [PMC free article] [PubMed] [Google Scholar]
- 56.Palmer AE, Jin C, Reed JC, Tsien RY. Bcl-2-mediated alterations in endoplasmic reticulum Ca2+ analyzed with an improved genetically encoded fluorescent sensor. Proc Natl Acad Sci USA. 2004;101(50):17404–17409. doi: 10.1073/pnas.0408030101. [DOI] [PMC free article] [PubMed] [Google Scholar]
- 57.DiFranco M, Neco P, Capote J, Meera P, Vergara JL. Quantitative evaluation of mammalian skeletal muscle as a heterologous protein expression system. Protein Expr Purif. 2006;47(1):281–288. doi: 10.1016/j.pep.2005.10.018. [DOI] [PubMed] [Google Scholar]
- 58.Royer L, Pouvreau S, Ríos E. Evolution and modulation of intracellular calcium release during long-lasting, depleting depolarization in mouse muscle. J Physiol. 2008;586(19):4609–4629. doi: 10.1113/jphysiol.2008.157990. [DOI] [PMC free article] [PubMed] [Google Scholar]
- 59.Van Der Voort HTM, Strasters KC. Restoration of confocal images for quantitative image analysis. J Microsc. 1995;178(2):165–181. [Google Scholar]
- 60.Messerli JM, van der Voort HT, Rungger-Brändle E, Perriard JC. Three-dimensional visualization of multi-channel volume data: The amSFP algorithm. Cytometry. 1993;14(7):725–735. doi: 10.1002/cyto.990140705. [DOI] [PubMed] [Google Scholar]
Associated Data
This section collects any data citations, data availability statements, or supplementary materials included in this article.


