Abstract
Pluripotency, the ability to generate any cell type of the body, is an evanescent attribute of embryonic cells. Transitory pluripotent cells can be captured at different time points during embryogenesis and maintained as embryonic stem cells or epiblast stem cells in culture. Since ontogenesis is a dynamic process in both space and time, it seems counterintuitive that these two temporal states represent the full spectrum of organismal pluripotency. Here we show that by modulating culture parameters, a stem-cell type with unique spatial characteristics and distinct molecular and functional features, designated as region-selective pluripotent stem cells (rsPSCs), can be efficiently obtained from mouse embryos and primate pluripotent stem cells, including humans. The ease of culturing and editing the genome of human rsPSCs offers advantages for regenerative medicine applications. The unique ability of human rsPSCs to generate post-implantation interspecies chimaeric embryos may facilitate our understanding of early human development and evolution.
Two types of pluripotent stem cells (PSCs) have been captured from early mouse embryos. Embryonic stem cells (ESCs) derived from the inner cell mass (ICM) of a pre-implantation blastocyst1,2 resemble naive epiblast3, and epiblast stem cells (EpiSCs) established from post-implantation epiblast are probably the in vitro counterparts of anterior primitive-streak cells4–6. While both are pluripotent, they bear striking differences in molecular signature, signalling dependency, colony morphology, cloning efficiency, metabolic requirements and epigenetic features7,8, which together with their ability to re-enter embryogenesis at different developmental time points (pre-implantation versus post-implantation, respectively) distinguish ESCs and EpiSCs as existing in two temporally distinct pluripotent states.
After embryo implantation, signals from regionalized extra-embryonic tissues guide pluripotent epiblast cells through dynamic changes to initiate the embryonic body plan that accommodates the diversified developmental fates that ensue upon gastrulation9. Heterotopic grafting experiments indicate that epiblast cells, regardless of their regional origins, can adopt the developmental fate characteristic of the cell population at the site of transplantation, illustrating their highly plastic nature10. Nonetheless, it is conceivable that epiblasts are subjected to regional influences and bear a multitude of pluripotent states with distinguishable molecular and functional signatures11. To date it remained unknown whether PSCs with distinct spatial identities could be stabilized in culture. By carefully examining the cellular response of the epiblast to different ex vivo environmental stimuli, we have isolated, with high efficiency, a stable primed pluripotent cell type from both pre- and post-implantation epiblasts that differs from EpiSCs in cloning efficiency, cell growth kinetics, transcriptomic, epigenomic and metabolic profiles. Notably, the newly identified PSCs selectively colonize the posterior region of post-implantation embryos and allow for efficient generation of ex vivo intra- and interspecies chimaeric embryos. Our study not only uncovers a novel spatially defined pluripotent cell type, but also opens up a new avenue for comparing early developmental programs across species.
Optimizing epiblast culture parameters
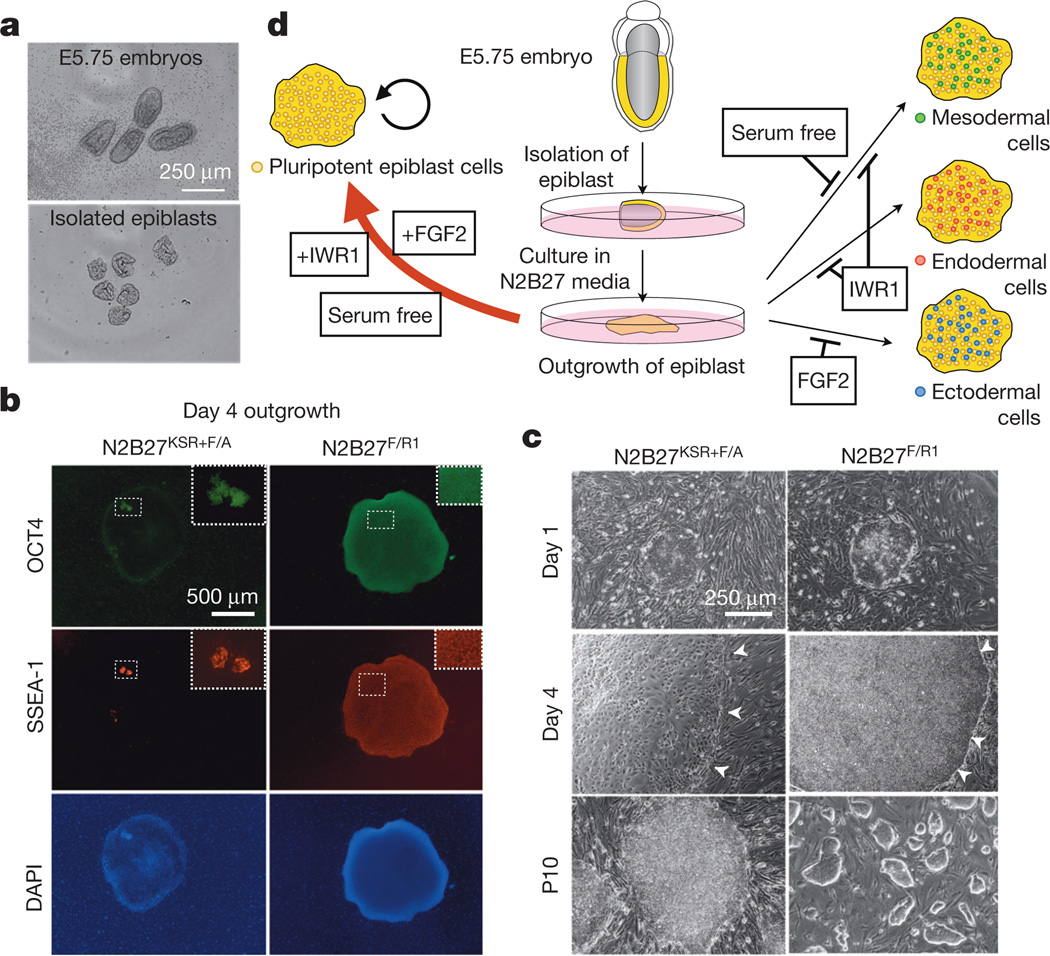
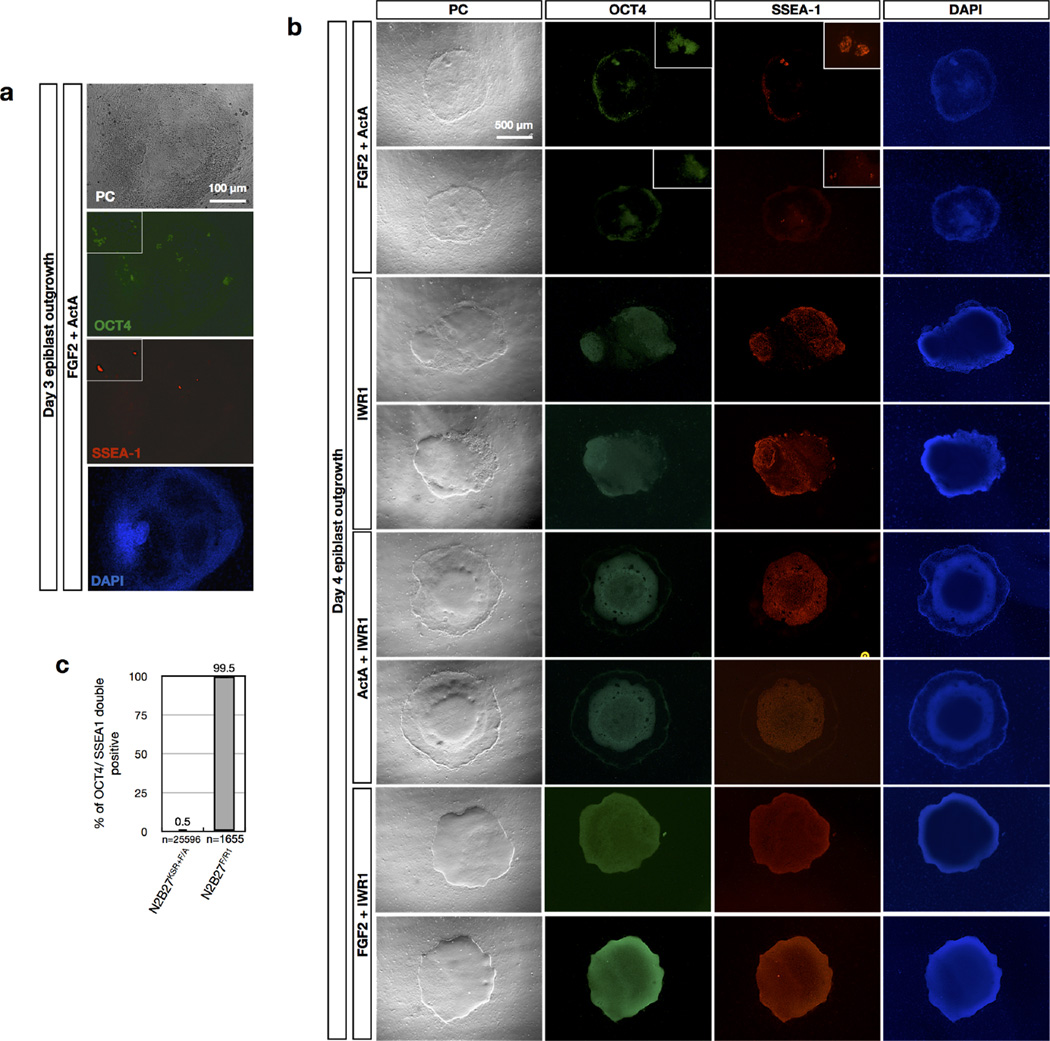
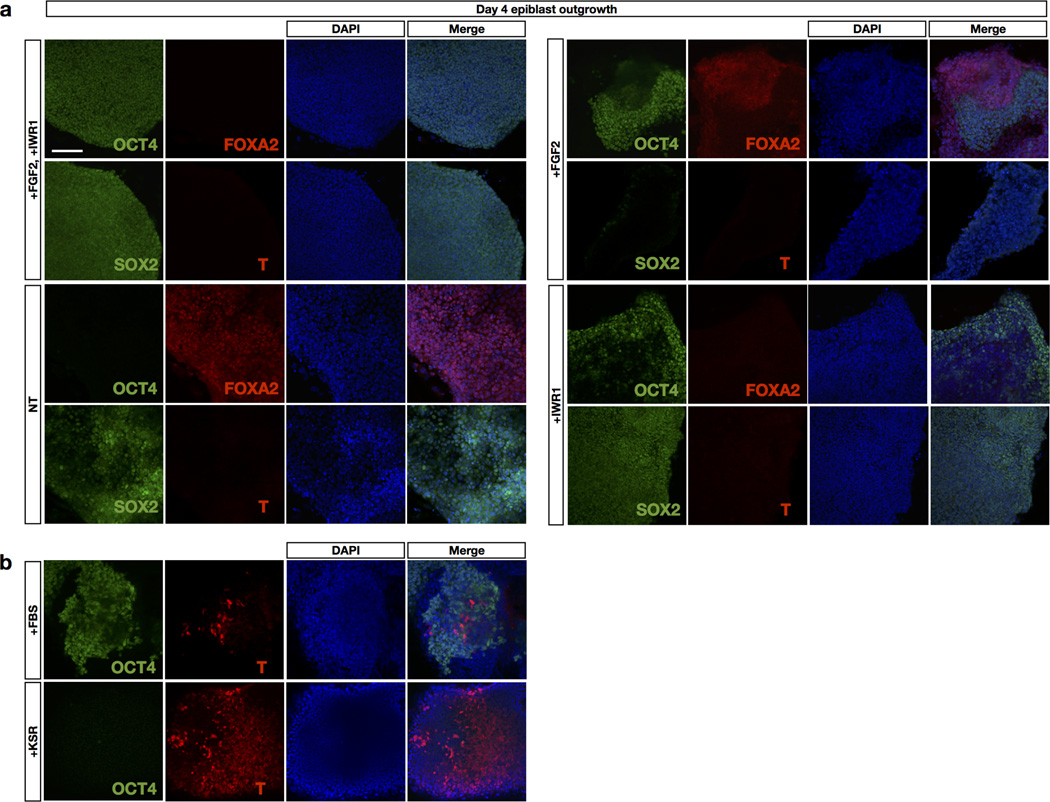
FGF2/Activin-A (F/A) signalling supports the derivation of EpiSCs4,5,12. While deriving EpiSCs using a F/A-based medium13, we observed cellular differentiation started around day 3 and by day 4 only a few undifferentiated epiblast cells remained (Fig. 1a, b and Extended Data Fig. 1a, b). This suggested to us that the pluripotent states of most of the cells present across the in vivo epiblast could not be maintained by F/A signalling. The canonical Wnt signalling pathway also has an important role in EpiSC self-renewal14–17. We tested the effect of a Wnt inhibitor IWR1 on epiblast explants. Isolated E5.75 epiblasts were cultured in a serum-free N2B27 medium18 on mitotically inactivated mouse embryonic fibroblasts (MEFs) supplemented with IWR1 (N2B27R1) (Fig. 1a, b). After 4 days in culture, we found the number of SSEA-1+/OCT4+ cells dramatically increased in N2B27R1 compared to F/A-based medium (Extended Data Fig. 1b). However, a significant fraction of SSEA-1−/OCT4− cells was still detected. Next we tested the combination of either Activin-A/IWR1 (N2B27A/R1) or FGF2/IWR1 (N2B27F/R1). Notably, while a comparable level of differentiation was observed in N2B27A/R1 versus N2B27R1, day 4 epiblast outgrowths in N2B27F/R1 showed homogenous morphology and little-to-no differentiation (Fig. 1b, c and Extended Data Fig. 1b, c). Mechanistically, the combination of the serum-free N2B27 medium, IWR1 and FGF2 suppressed lineage differentiation and arrested the majority of, if not all, epiblast cells in a proliferative state, with homogenous expression of the pluripotency markers OCT4 and SSEA-1 (Fig. 1d and Extended Data Fig. 2a, b).
Figure 1. The effects of culture parameters on epiblast explants.
a, Freshly collected E5.75 mouse embryos (top) and isolated E5.75 epiblasts (bottom). b, Immunostaining of day 4 epiblast outgrowths. KSR, KnockOut serum replacement. Green, OCT4; red, SSEA-1; blue, DAPI. Insets, higher-magnification images. c, Morphologies of epiblast outgrowths at day 1 and day 4 in EpiSC and rsEpiSC derivation medium. Bottom, EpiSCs and rsEpiSCs at passage 10 (P10). Arrowheads, edges of the epiblast outgrowths. d, Schematic model summarizing the effects of various culture parameters on epiblast explants.
A spatially defined pluripotent state
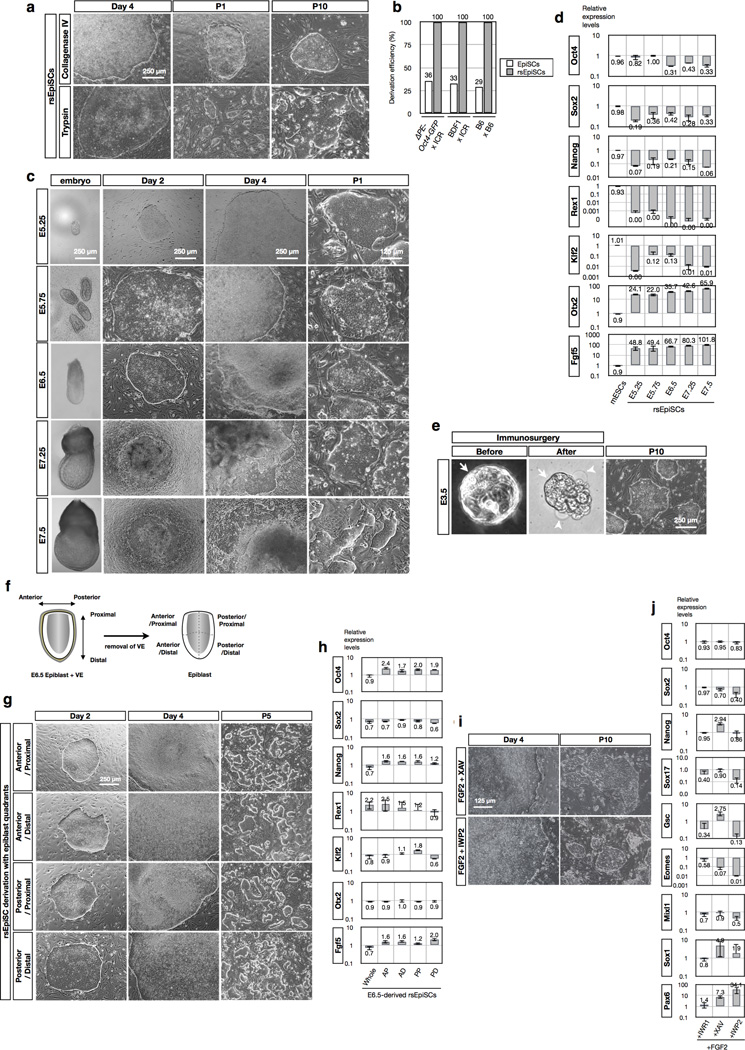
Upon passaging with collagenase type IV, traditionally used for EpiSCs, we could derive stable cell lines under N2B27F/R1, referred to as EpiSCsF/R1. Surprisingly, EpiSCsF/R1 could also be efficiently derived after trypsin disaggregation of day 4 epiblast outgrowths (Extended Data Fig. 3a). In addition to IWR1, we could also obtain stable cell lines using other Wnt inhibitors XAV939 and IWP2 (Extended Data Fig. 3i, j). In our experiments, the derivation success rate with F/A culture is around 33%, similar to a recent report6. In contrast, we could readily obtain stable EpiSCsF/R1 from different genetic backgrounds and different developmental stages of post-implantation as well as pre-implantation epiblasts, even after the first passage with a derivation success rate of 100% (Extended Data Fig. 3b, c, e), a feat not possible with F/A culture5,19. Moreover, N2B27F/R1 equally supported the derivation of EpiSCsF/R1 from four micro-dissected quadrants (anterior-proximal, anterior-distal, posterior-proximal and posterior-distal) of E6.5 epiblasts with a perfect success rate (Extended Data Fig. 3f, g). This uniform response suggests that N2B27F/R1 captures a pluripotent state accessible to all in vivo pluripotent epiblast cells of diverse spatiotemporal origins.
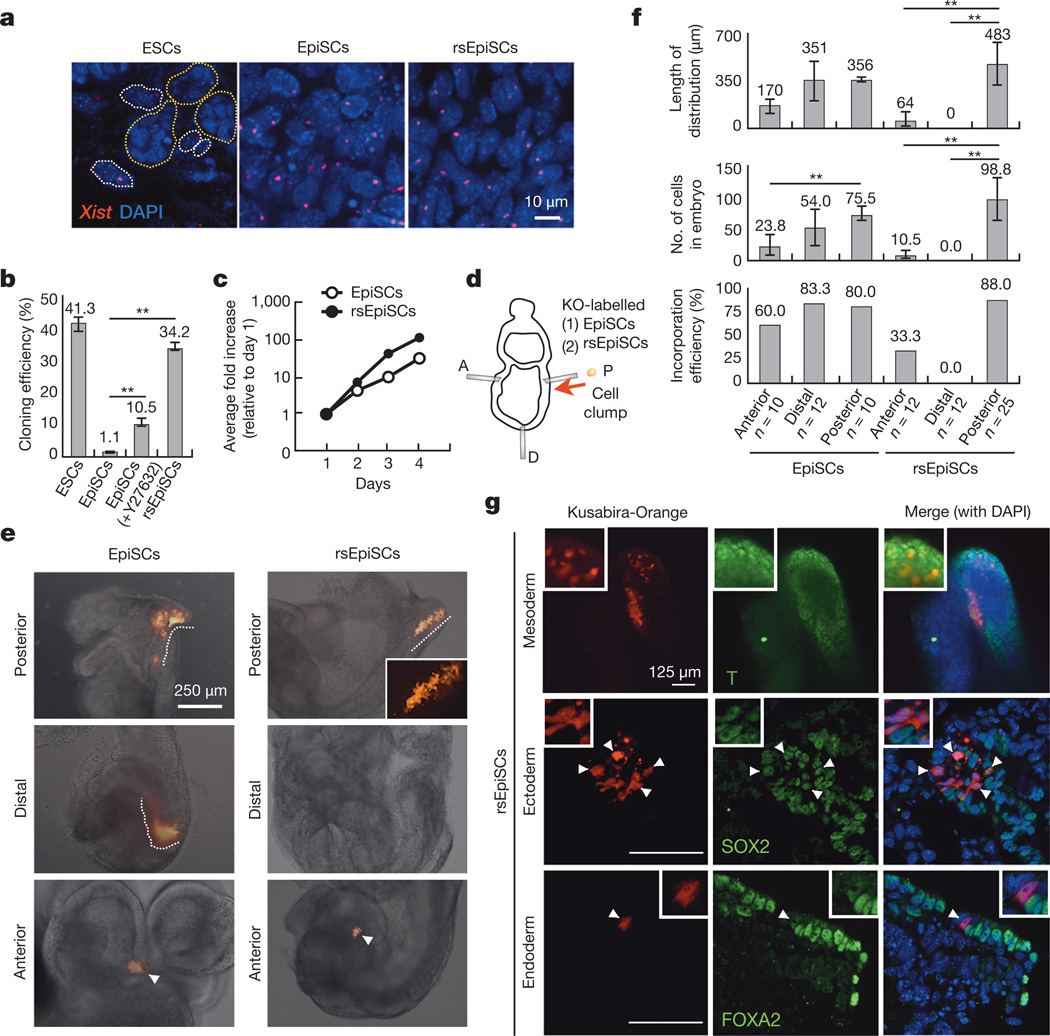
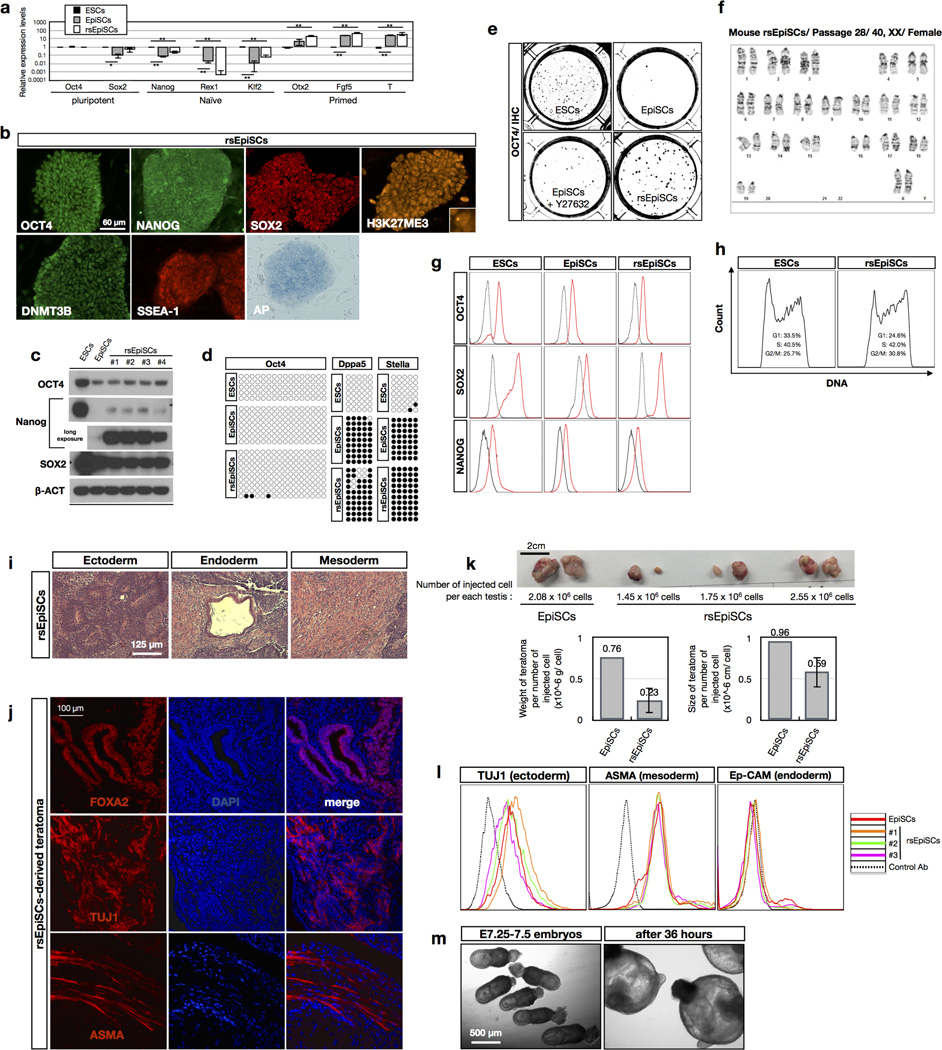
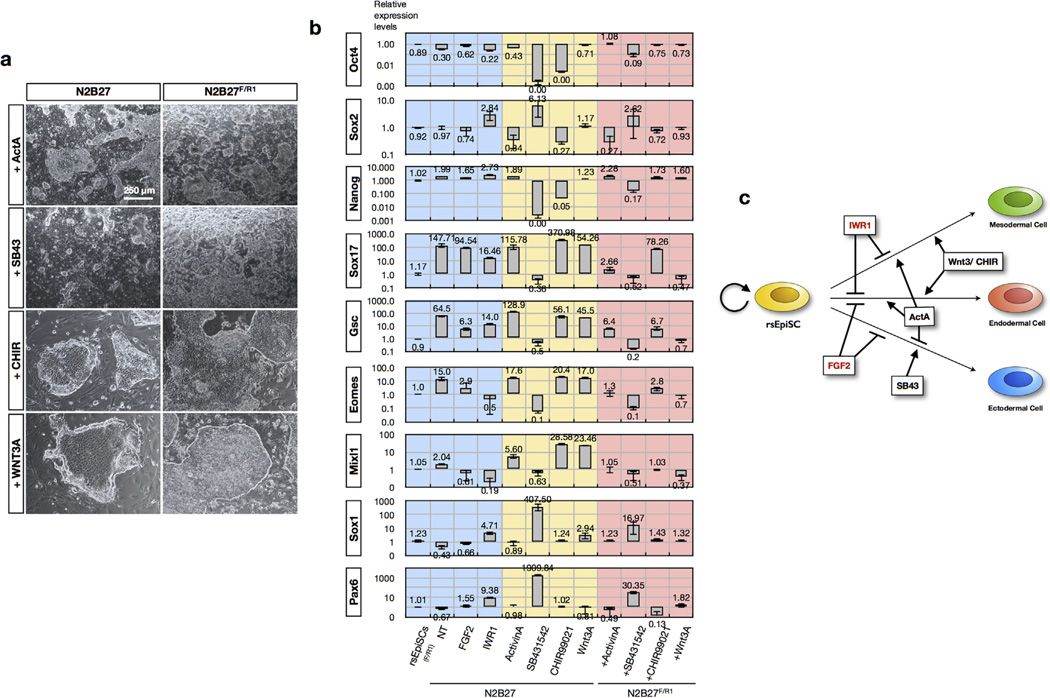
EpiSCsF/R1 could be maintained long term in culture while displaying homogenous morphology and a normal karyotype (Fig. 1c and Extended Data Fig. 4f). EpiSCsF/R1 derived from different developmental stages and different regions exhibited gene expression patterns characteristic of the primed-state PSCs (Extended Data Figs 3d, h and 4a). EpiSCsF/R1 expressed standard pluripotent protein markers and possessed weak alkaline phosphatase activity (Extended Data Fig. 4b, c, g). Epigenetically, EpiSCsF/R1 exhibited X-chromosome inactivation in female cells (Fig. 2a and Extended Data Fig. 4b), demethylated Oct4 (also known as Pou5f1) promoter and fully methylated Stella (also known as Dppa3) and Dppa5 promoters (Extended Data Fig. 4d). We found that self-renewal of EpiSCsF/R1 was dependent on balanced signalling of FGF2 and IWR1 (Extended Data Fig. 5a–c). Pluripotency of EpiSCsF/R1 was demonstrated with in vivo teratoma assays and we observed that the sizes of teratomas derived from EpiSCsF/R1 were smaller than those derived from EpiSCs (Extended Data Fig. 4i–k). Collectively, these results indicate that EpiSCsF/R1 bear properties characteristic of the primed pluripotent state.
Figure 2. Characterization of rsEpiSCs.
a, Xist RNA FISH signals in female mouse ESCs, EpiSCs and rsEpiSCs. Dotted circles: yellow, mESCs; white, MEFs. b, Cloning efficiencies of mESCs, EpiSCs and rsEpiSCs. c, Growth curve of EpiSCs and rsEpiSCs. d, Schematic representation of epiblast grafting experiments (please refer to Supplementary Fig. 1 for details). KO, Kusabira-Orange. A, anterior; P, posterior; D, distal. e, Representative images showing outcomes of grafted Kusabira-Orange-labelled EpiSCs and rsEpiSCs to different epiblast regions. Dashed lines, dispersed cells. Arrowheads, cell clumps. f, Distinct outcomes for EpiSCs and rsEpiSCs grafted to different epiblast regions. g, Whole-mount immunostaining of posterior grafted rsEpiSCs. Blue, DAPI. Arrowheads, SOX2 or FOXA2-positive derivatives of grafted cells. Top-middle, T (brachyury)-positive derivatives of grafted cells. Insets, higher-magnification images. Error bars, s.d.; t-test, **P < 0.01 (b, n = 6; c, n = 2; f, n indicated on the graph, independent experiments)
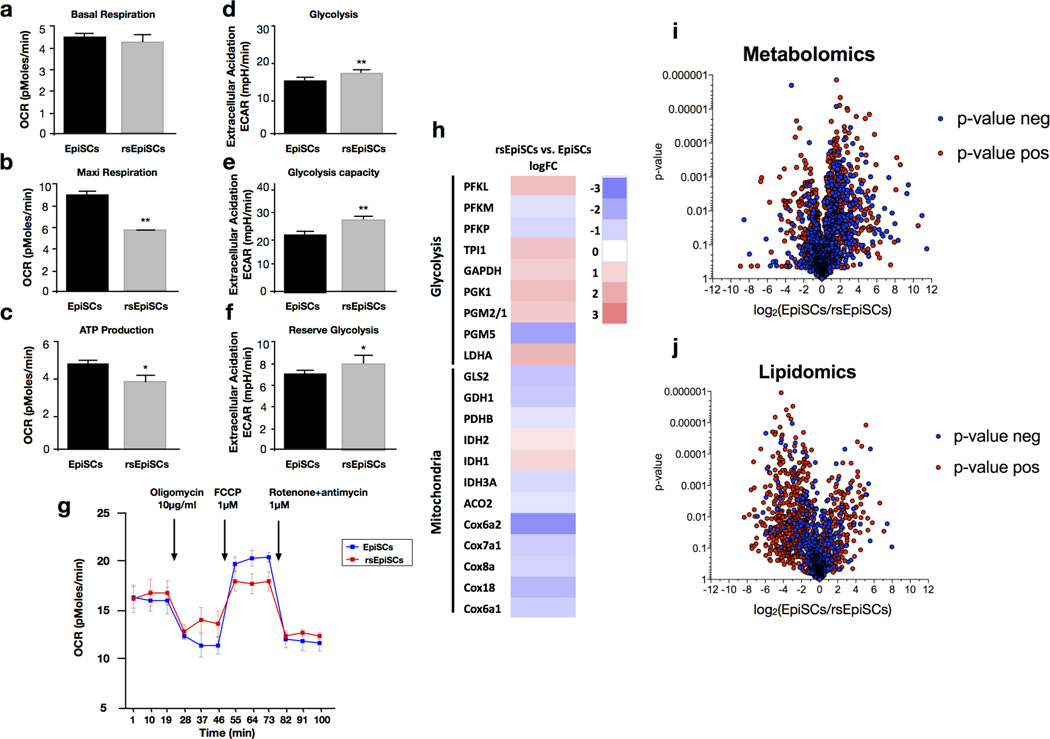
Low clonogenicity is regarded as one of the prominent features of primed EpiSCs. In contrast, EpiSCsF/R1 showed high cloning efficiency (~34.2%) at a comparable level to ESCs (~41.3%) and much higher than EpiSCs (~1.1%) (Fig. 2b and Extended Data Fig. 4e)15,20. Other notable differences between EpiSCsF/R1 and EpiSCs are proliferation rate and doubling time. EpiSCsF/R1 proliferate at a much faster pace than EpiSCs (Fig. 2c). The doubling time of EpiSCsF/R1 (8–10 h) is markedly shorter than that of EpiSCs (14–16 h) and this is probably due to a shortened G1 phase (Extended Data Fig. 4h). Metabolically, we found EpiSCsF/R1 were more dependent on glycolysis and less on mitochondrial respiration than already highly glycolytic EpiSCs8 (Extended Data Fig. 7a–g), which might support their fast growth rate. The high cloning efficiency, rapid proliferation rate and a more glycolytic metabolic profile suggest that EpiSCsF/R1 exist in a primed pluripotent state distinct from that of the conventional EpiSCs.
Naive mouse ESCs (mESCs) differ from primed EpiSCs in their ability to generate chimaeras following blastocyst injection. Post-implantation embryos, however, constitute a non-permissive environment for ICM-derived mESCs, and hence, grafted mESCs proliferate poorly21. To phenotypically evaluate the pluripotent state of EpiSCsF/R1, we first performed blastocyst injections. We did not observe any chimaera contribution from EpiSCsF/R1, further supporting the notion that EpiSCsF/R1 are in a primed pluripotent state. Although incapable of colonizing pre-implantation ICMs, EpiSCs could readily incorporate and generate chimaeras when grafted into post-implantation epiblasts followed by in vitro embryo culture21. To functionally define EpiSCsF/R1 we grafted Kusabira-Orange-labelled EpiSCsF/R1 into different regions of isolated, non-intact E7.5 embryos (anterior, distal and posterior) (Fig. 2d). Unlike conventional EpiSCs, which incorporated efficiently in the distal (10/12) and posterior (8/10) regions and to a lesser extent the anterior region (6/10), an observation consistent with previous reports6,15,21, EpiSCsF/R1 only integrated efficiently in the posterior epiblast (22/25). They poorly integrated in the anterior region (3/12) and not at all in the distal region (0/12). More importantly, after 36 h of embryo culture only EpiSCsF/R1 grafted to the posterior region could disperse from graft sites, proliferate and differentiate into the three germ layers in chimaeric embryos (Fig. 2e–g and Extended Data Fig. 4m). These results not only confirmed the pluripotency of EpiSCF/R1, but also revealed a preferential affinity and high compatibility between EpiSCsF/R1 and the posterior E7.5 epiblast. Based on this unique embryo grafting property, we named EpiSCsF/R1 as region-selective EpiSCs, or rsEpiSCs. Divergent grafting outcomes indicate that rsEpiSCs represent a class of primed-state PSCs with a new spatial identity distinct from conventional EpiSCs.
Multiple omics comparisons of PSCs
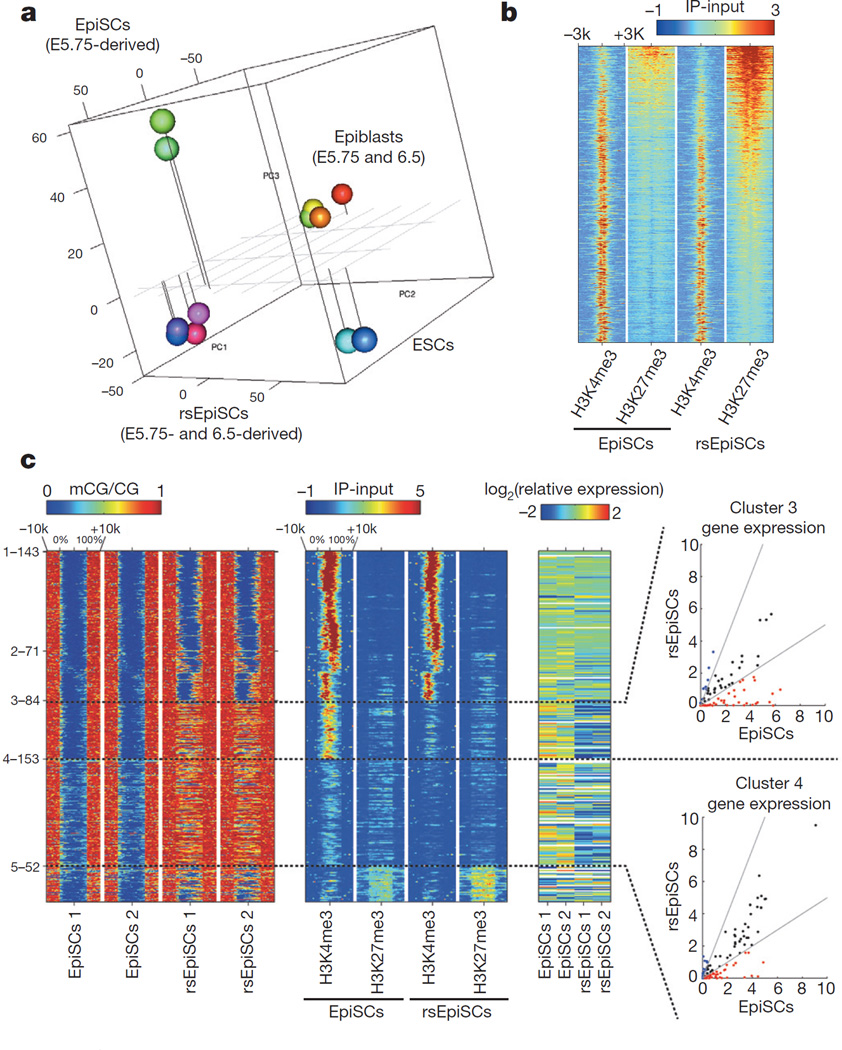
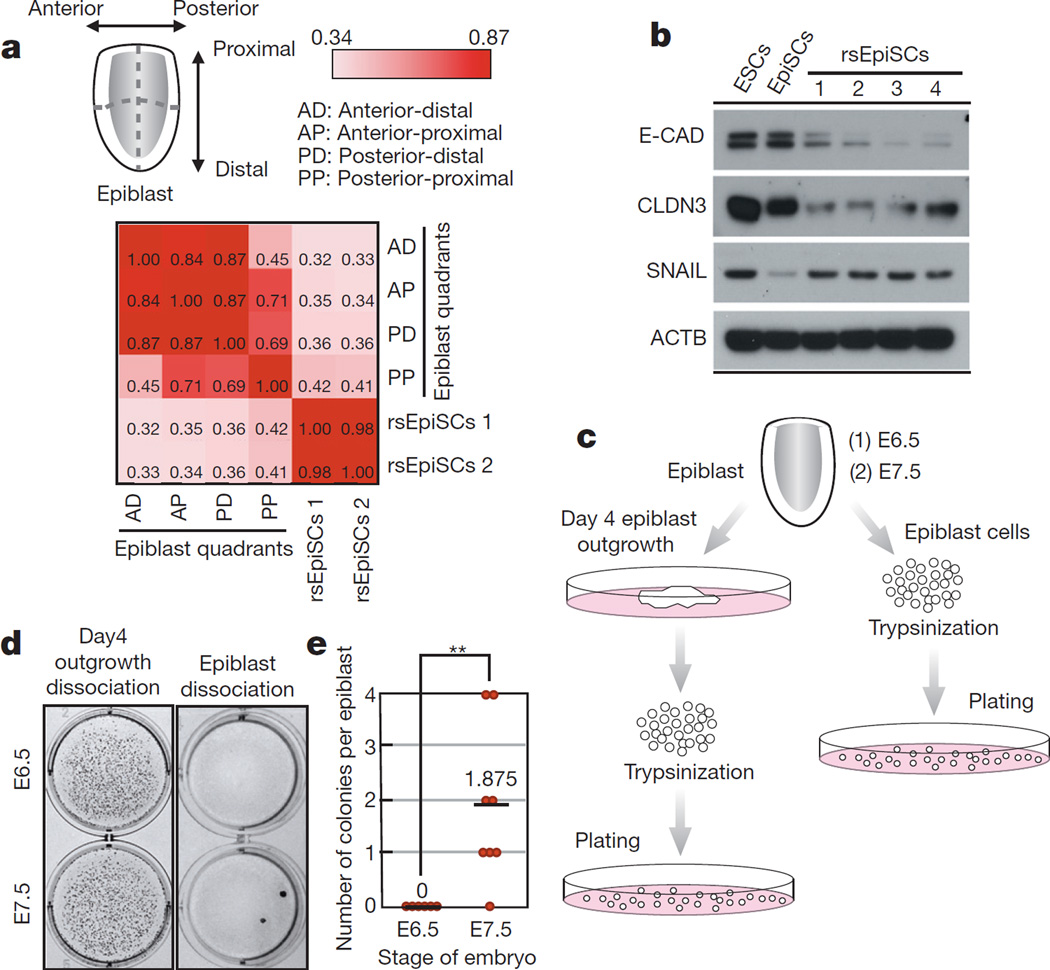
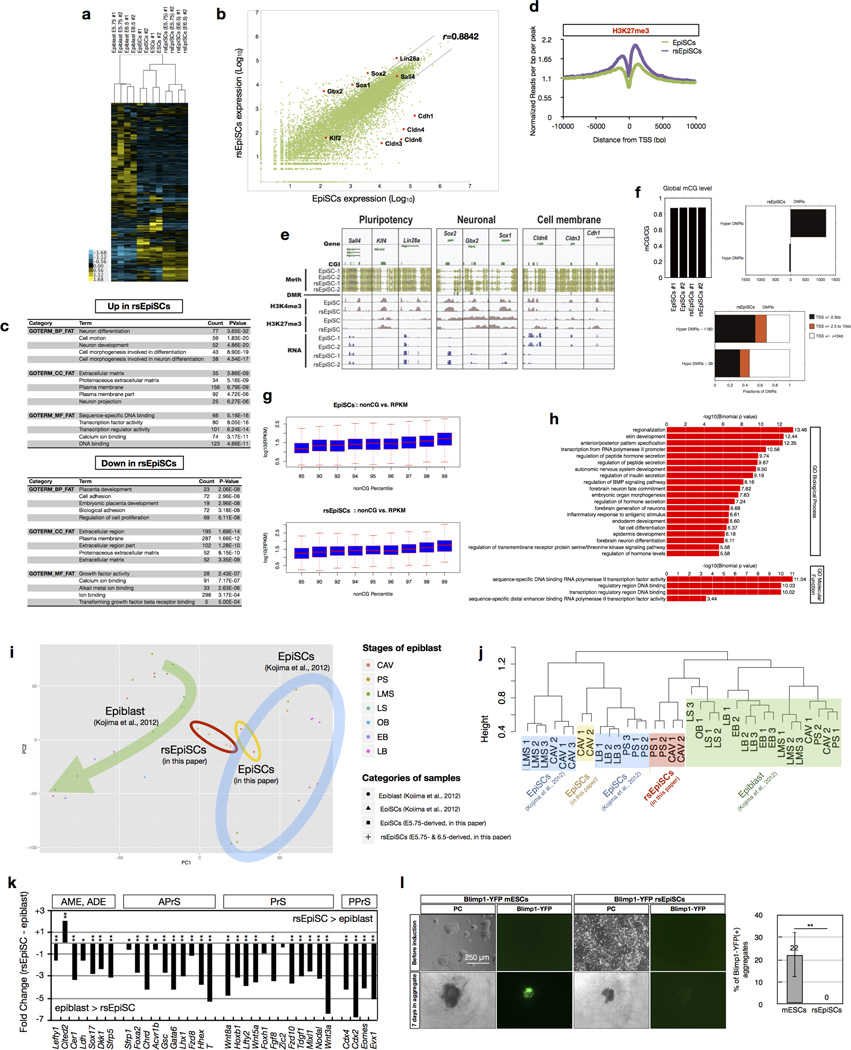
We compared the transcriptomes of mESCs, EpiSCs, rsEpiSCs and in vivo isolated epiblasts using microarrays. Principle component analysis (PCA) and unsupervised hierarchical clustering analysis showed that rsEpiSCs clustered tightly as a group separated from both mESCs and EpiSCs, indicating that rsEpiSCs acquired a distinct global transcriptome profile (Fig. 3a and Extended Data Fig. 6a). Comparative analysis of RNA-seq data identified 2,245 genes differentially expressed between rsEpiSCs and EpiSCs using a fourfold cut-off (FDR < 0.05, Extended Data Fig. 6b and Supplementary Table 1). Notable gene ontology (GO) terms enriched in genes upregulated in rsEpiSCs were related to neuron differentiation and development (Extended Data Fig. 6c). FACS analyses of teratomas, however, revealed no obvious lineage biases between EpiSCs and rsEpiSCs (Extended Data Fig. 4l). Other prevalent GO terms were associated with cell motion, extracellular matrix and plasma membrane. This is reminiscent of the epithelial to mesenchymal transition (EMT) that takes place during gastrulation. We further explored this possibility by analysing the levels of E-CADHERIN, CLAUDIN-3 and SNAIL, proteins integral to the EMT process. Notably, we detected reduced expressions of both E-CADHERIN and CLAUDIN-3 and a concomitant increase in SNAIL expression, suggesting that the EMT process might have been initiated in rsEpiSCs (Fig. 4b). It is interesting to note that, consistent with the metabolic flux analysis, gene expression levels of enzymes and complexes involved in glycolysis were higher in rsEpiSCs versus EpiSCs, and those related to mitochondrial function were lower in rsEpiSCs versus EpiSCs (Extended Data Fig. 7h).
Figure 3. Global transcriptomic and epigenomic analysis.
a, PCA of microarray data generated from ESCs, EpiSCs, rsEpiSCs and isolated epiblasts. b, H3K4me3 and H3K27me3 ChIP-seq signals at Polycomb target genes in EpiSCs and rsEpiSCs. c, Clustering of unmethylated regions associated with promoters that overlap with rsEpiSCs hyper-DMRs. CG methylation (mCG), H3K4me3 and H3K27me3 levels were plotted for scaled unmethylated regions and ± 10 kb regions surrounding the unmethylated regions. Dashed lines in the scatter plot indicate a twofold up (blue) or down (red) difference in RNA level in rsEpiSCs compared to EpiSCs. a, c, n = 2; b, n = 1, biological replicates.
Figure 4. In vivo relevance of rsEpiSCs.
a, Transcriptomically rsEpiSCs correlate better with the posterior-proximal than with other regions of epiblast. b, Protein expression of EMT markers, ACTB served as the loading control. c, Schematic workflow for the clonal derivation experiments. d, Representative images showing OCT4-positive colonies after trypsinizing day 4 epiblast outgrowths (left) and isolated epiblast (right) from E6.5 and E7.5 mouse embryos. e, Number of OCT4-positive colonies per embryo from clonal derivation of rsEpiSCs. Error bars indicate s.d. t-test, **P < 0.01. (E6.5, n = 6; E7.5, n = 8, independent experiments). For the full scan associated with b, refer to Supplementary Information.
ChIP-seq analysis revealed that the global histone 3 lysine 4 trimethylation (H3K4me3) distribution pattern was similar between EpiSCs and rsEpiSCs while a significant increase of H3K27me3 levels was detected at the transcription start site of polycomb group target genes in rsEpiSCs (Fig. 3b, Extended Data Fig. 6d, http://neomorph.-salk.edu/rsEpiSC/browser.html). The genomes of both EpiSCs and rsEpiSCs are highly methylated in CG contexts (~87%, Extended Data Fig. 6f). The genome-wide discovery of differentially methylated regions (DMRs) identified 1,336 DMRs between EpiSCs and rsEpiSCs with the vast majority (88.3%) showing hyper-methylation in rsEpiSCs. Of these rsEpiSCs hyper-DMRs, 53.8% (635/1,180) were located within 2.5 kilobases of the transcription start site (Extended Data Fig. 6f). rsEpiSCs hyper-DMRs were strongly enriched at CpG-island-containing promoters (P = 2.14 × 10−88). A subset of genes (cluster 3) associated with complete promoter methylation and concomitant loss of H3K4me3 in rsEpiSCs was accompanied by reduced expression levels (48% of genes in cluster 3, P = 1.6 × 10⁻⁸, Fig. 3c). Consistent with the selective engraftment of rsEpiSCs to the posterior epiblast, genes associated with rsEpiSCs hyper-DMRs were enriched for GO terms such as regionalization and anterior/posterior pattern specification (Extended Data Fig. 6h). In both EpiSCs and rsEpiSCs, we observed a positive correlation between gene expression and non-CG methylation levels in the gene body, characteristic of pluripotent cells22 (Extended Data Fig. 6g). Consistent with transcriptomic analysis, genes related to cell membrane and neuronal lineage exhibited distinct patterns while pluripotency- related genes remained comparable in DNA methylation and/ or histone methylation levels between EpiSCs and rsEpiSCs (Extended Data Fig. 6e).
Untargeted metabolomics and lipidomics analysis quantified differences in hydrophilic and hydrophobic metabolites, respectively, between EpiSCs and rsEpiSCs. Several hundred metabolites were identified as being different between the two cell lines using XCMS online23 and the METLIN database24 (Extended Data Fig. 7i, j and Supplementary Tables 2–7). The data show broad changes in metabolite levels including increased tricarboxylic acid cycle intermediates and lower levels of lipids in EpiSCs, indicating increased energy utilization in these processes. The increased tricarboxylic acid cycle usage is in line with a higher mitochondria respiration rate in EpiSCs than rsEpiSCs. Also, rsEpiSCs contained less glucose and more glucose-6-phosphate compared to EpiSCs, which correlates with the higher glycolytic activity in rsEpiSCs as determined by medium acidification measurements.
Collectively these multi-omic results distinguish rsEpiSCs from EpiSCs at the transcriptomic, epigenomic and metabolic levels, further underlining their contrasting attributes despite both existing in the primed pluripotent state.
In vivo relevance of rsEpiSCs
To investigate which region(s) of the in vivo epiblast rsEpiSCs may resemble, we performed RNA-seq on four dissected regions of the late E6.5 epiblast (anterior-proximal, anterior-distal, posterior-proximal and posterior-distal) and compared differentially expressed genes among in vivo samples with rsEpiSCs. Spearman’s rank correlation revealed that in vivo posterior-proximal epiblast had a higher correlation with rsEpiSCs than other epiblast quadrants, suggesting that rsEpiSCs might have acquired cellular properties characteristic of the posterior-proximal epiblast (Fig. 4a).
To reveal the temporal identity of rsEpiSCs, we first tested the ability of rsEpiSCs to be induced into primordial germ cells (PGCs). Epiblasts acquire the ability to adopt a PGC fate in response to BMP4 between developmental stages E5.5 and E6.525,26. We did not observe any PGC induction in rsEpiSCs following an established protocol13 (Extended Data Fig. 6l), suggesting that they do not resemble in vivo epiblasts during this period. To help dissect which developmental stage rsEpiSCs most closely relate to, we next compared the transcriptomes of rsEpiSCs to those of epiblasts isolated from different embryological timelines from a published data set6. PCA and hierarchical clustering analysis revealed that gene expression profiles of rsEpiSCs are similar to epiblast from late-streak/no-bud-stage embryos27 (Extended Data Fig. 6i, j). This prompted us to investigate whether rsEpiSCs acquired primitive streak cellular properties by comparing rsEpiSCs and in vivo late-streak epiblast transcriptomes for an annotated list of primitive marker genes6,28,29. We found almost all primitive streak-related genes were expressed at significantly lower levels in rsEpiSCs compared to in vivo late-streak epiblast, indicating rsEpiSCs had not acquired the molecular properties of primitive streak cells (Extended Data Fig. 6k).
To functionally time rsEpiSCs, we focused on their unusually high cloning efficiency and tested clonal derivation of rsEpiSCs by directly trypsinizing isolated epiblasts. When starting with E7.5 epiblasts, a few OCT4-positive colonies appeared after 7 day’s culture. In contrast, we did not observe any colony forming with E6.5 epiblasts (Fig. 4c–e). These results indicate that some in vivo E7.5 epiblast cells acquired resistance to apoptosis after single-cell enzymatic dissociation, a property shared by rsEpiSCs. This may be attributed to the EMT occurring during gastrulation when posterior-proximal epithelial epiblast cells delaminate and ingress through the primitive streak to form mesoendoderm30. Taken together, these findings suggest that rsEpiSCs may represent a subpopulation of cells from the late-streak/no-bud-stage epiblast undergoing EMT before their lineage commitment.
Primate region-selective PSCs
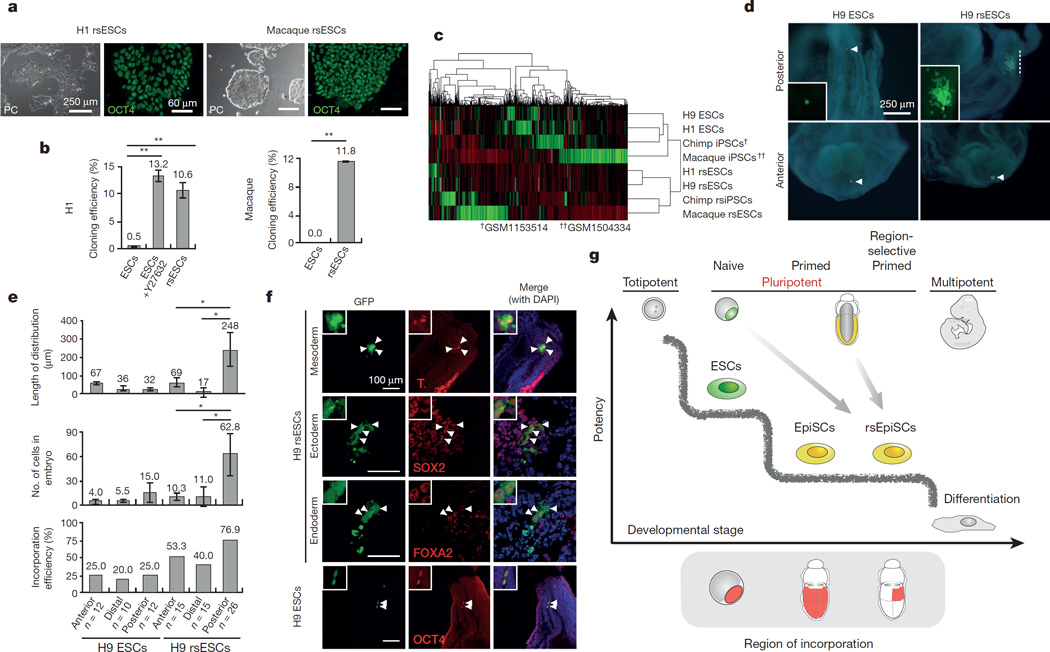
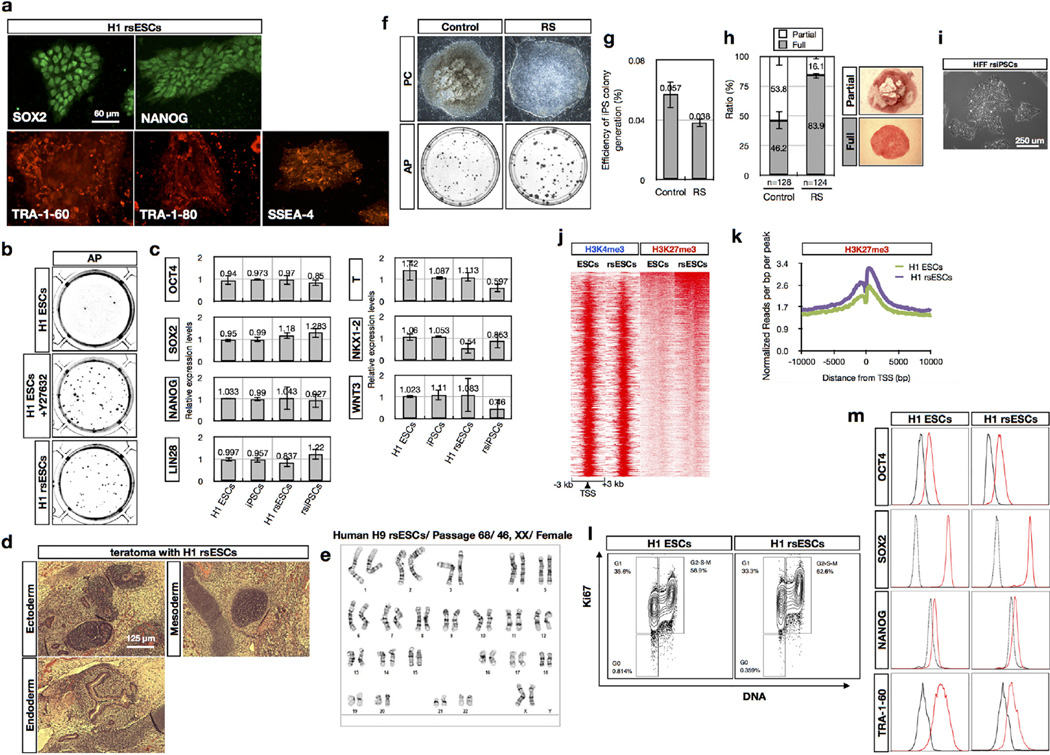
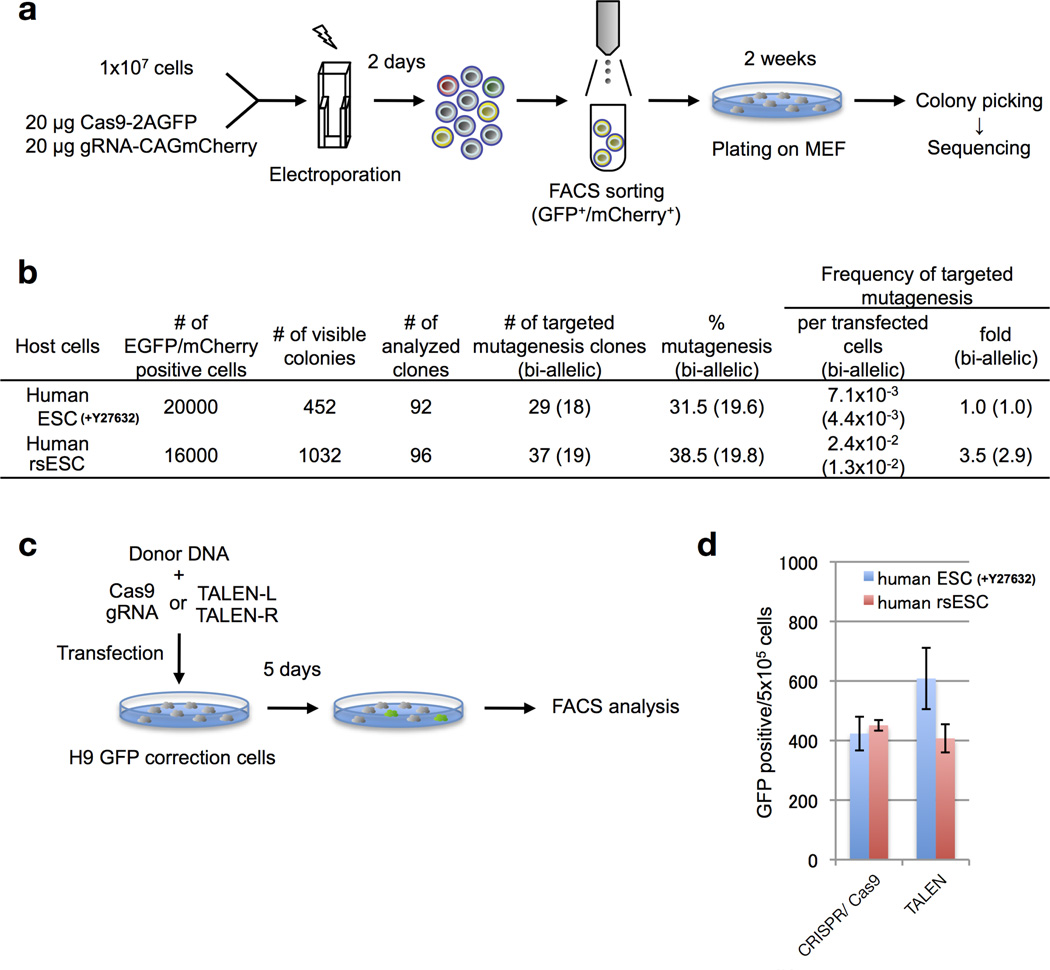
Notwithstanding their blastocyst origin, human ESCs exist in a primed pluripotent state similar to mouse EpiSCs, a state that suffers from several practical disadvantages, including low derivation and cloning efficiency. When human ESCs were cultured in F/R1 conditions we observed long-term self-renewal and karyotypic stability (Fig. 5a and Extended Data Fig. 8e). F/R1 human ESCs (designated as human region-selective ESCs, or human rsESCs) expressed standard pluripotency markers (Fig. 5a and Extended Data Fig. 8a, c, m), harboured a reduced population of cells retained at the G1 phase (Extended Data Fig. 8l) and generated teratomas in NOD/SCID mice comprising the three germ lineages (Extended Data Fig. 8d). Similar to mouse rsEpiSCs, the cloning efficiency of human rsESCs was significantly improved (Fig. 5b and Extended Data Fig. 8b), which greatly facilitated genome editing at a comparable level to Y27632- treated conventional human ESCs (Extended Data Fig. 9a–d). F/R1 culture also supported generation of human induced pluripotent stem cells (iPSCs). Notably, compared to F/A culture, putative iPSC-like colonies in F/R1 culture were more homogenous, bigger in size and contained less colonies with partial/absent alkaline phosphatase activity (Extended Data Fig. 8g–i).
Figure 5. Primate region specific PSCs.
a, Morphology and OCT4 immunostaining of human and rhesus macaque rsESCs. b, Cloning efficiency of human and macaque ESCs versus rsESCs. c, Unbiased cross-species hierarchical clustering of trancriptomes of primate PSCs and rsPSCs. d, Representative images showing outcomes of grafted GFP-labelled H9 ESCs and H9 rsESCs to different epiblast regions of non-intact and non-viable isolated E7.5 mouse embryos. Arrowheads, cell clumps. Dashed line, dispersed cells. Blue, DAPI. e, Outcomes of graftingH9 andH9 rsESCs to different mouse epiblast regions of non-intact and non-viable E7.5 mouse embryos. f, Immunostaining of posterior-grafted GFP-labelled H9 ESCs and H9 rsESCs. Blue, DAPI. Insets, high magnification views. Arrowheads indicate T (brachyury)-, SOX2-, FOXA2- or OCT4-positive derivatives of grafted cells. g, Schematic representation of distinct PSCs captured from early embryos and their specific timings and regions to re-enter embryogenesis. Error bars, s.d.; t-test, **P < 0.01, *P < 0.05. (b, n = 6; e, n indicated on the graph; independent experiments).
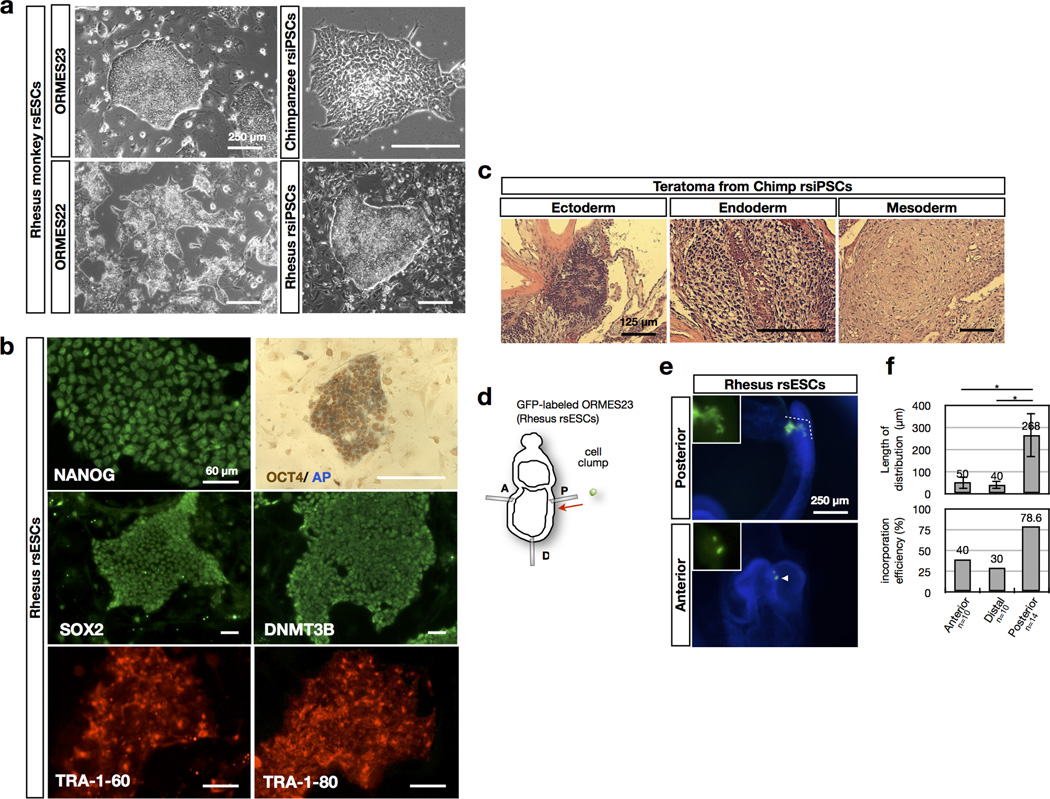
F/R1 culture also supported long-term culture of non-human primate (NHP) PSCs including rhesus macaque PSCs31 and chimpanzee iPSCs32 (Fig. 5a and Extended Data Fig. 10a, b). The cloning efficiency of NHP rsESCs was also improved (Fig. 5b). Hierarchical clustering of the trancriptome analysed using RNA-seq showed that primate rsPSCs were clustered together in a group distinct from conventional primate PSCs in F/A culture (Fig. 5c).
To functionally test whether primate rsPSCs acquired phenotypic properties characteristic of mouse rsEpiSCs, we grafted green fluorescent protein (GFP)-labelled human H9 ESCs or H9 rsESCs into the anterior, distal and posterior regions of epiblasts of isolated non-intact E7.5 mouse embryos (see Methods). Conventional H9 ESCs could not efficiently integrate and proliferate inside mouse epiblasts regardless of their grafting sites. In rare cases when few H9 ESCs were detected, they remained undifferentiated, as indicated by positive staining for OCT4 (Fig. 5d–f). This indicates that unlike mouse EpiSCs, human H9 ESCs are incompatible with mouse post-implantation epiblasts. In contrast, H9 rsESCs efficiently integrated, proliferated and differentiated into all three germ layers when grafted in the posterior region, remained undifferentiated as clusters in the anterior region and showed no incorporation in the distal region of the E7.5 mouse epiblasts, consistent with mouse rsEpiSCs (Fig. 5d–f). In addition to human cells, we observed similar engrafting patterns with GFP-labelled rhesus macaque rsESCs (Extended Data Fig. 10d–f), indicating that F/R1 culture endowed similar phenotypic features to NHP ESCs.
Pluripotency, an evanescent feature of early embryonic development, permeates epiblast cells of diverse spatiotemporal orgins33. Nevertheless, distinct pluripotent states have been described and distinguished along the embryological timeline without regard to spatial attributes. Although post-implantation pluripotent epiblast cells are not irreversibly committed, they are spatially polarized under the influence of local milieus provided by surrounding extra-embryonic tissues34. The regional properties of post-implantation epiblast cells have largely been overlooked in EpiSCs. By refining culture parameters, we have captured cells of spatially defined pluripotency that harbour molecular, epigenetic and metabolic signatures that differ from conventional EpiSCs. Our study sets a precedent for exploring other spatially distinct pluripotent states in the early embryo.
Compared to naive cells, primed PSCs exist in a more developmentally advanced state and are poised for rapid and efficient differentiation. This advantage, however, is overshadowed by the heterogeneity and poor cloning efficiency associated with the conventional F/A culture. F/R1 culture boosts cloning efficiency, simplifies routine cultivation, improves the quality of iPSC generations, and facilitates genome editing in primed human PSCs. These features are attractive for a myriad of applications such as synchronized and efficient differentiation, large-scale cell production, and gene-correction for disease modelling and therapeutic purposes. In addition, the ability of human rsESCs to differentiate into derivatives of all three embryonic germ layers in chimaeric embryos provides us with a novel platform to study early human developmental events that are otherwise difficult to investigate, such as gastrulation and early lineage commitment, presumed, but not yet fully proven, to be conserved between human and other animal model organisms. The capture and engineering of PSCs with distinct features35,36 may enrich our fundamental understanding of pluripotency in mammalian development and evolution, as well as expand the repertoire of cellular tools that can be harnessed for regenerative medicine applications.
METHODS
No statistical methods were used to predetermine sample size.
Mice
B6;CBA-Tg(Pou5f1-EGFP)2Mnn/J37 (The Jackson Laboratory, stock number: 004654) and B6.Cg-Tg(Prdm1-EYFP)1Mnz/J38 (The Jackson Laboratory, stock number: 008828) transgenic mice were maintained on the C57BL/6J background. To obtain embryos, ICR or C57BL/6J females were mated with males from ICR, BDF1 (a cross between C57BL/6J and DBA2), B6;CBA-Tg(Pou5f1-EGFP)2Mnn/J or B6.Cg-Tg(Prdm1-EYFP)1Mnz/J homozygous strains. B6 embryos were obtained by mating female C57BL/6J with male C57BL/6J. Both male and female mice were used at ages between 6 to 25 weeks. No randomization and no blinding were used. All the animal experiments were performed under the ethical guidelines of the Salk Institute, and animal protocols were reviewed and approved by the Salk Institute Institutional Animal Care and Use Committee (IACUC).
Epiblast isolation from post-implantation embryos
Timed-pregnant mice were euthanized for embryo collection at appropriate developmental stages between E5.25 and E7.75. To isolate epiblasts, embryos were first dissected out from decidua. Rechert’s membrane, extra-embryonic ectoderm and visceral endoderm were carefully removed mechanically with fine forceps and a tungsten needle. The embryo isolation procedures were performed in media containing DMEM (Gibco), 10% FBS (Hyclone) and 1 × penicillin–streptomycin (Gibco). For isolation of epiblast from stage E7.25 and E7.5 embryos, an additional step was taken to mechanically remove the mesodermal layer. Staging of embryos was performed as previously described26,39.
Derivation and culture of mouse rsEpiSC lines
For rsEpiSCs derivation, epiblasts from E5.25 to E7.5 post-implantation mouse embryos were isolated by mechanically removal of Rechert’s membrane, visceral endoderm as well as extra-embryonic ectoderm using fine forceps and a tungsten needle. In the case of stage E7.25 and E7.5 embryos, the mesodermal layer was also mechanically removed with a tungsten needle. Isolated epiblasts were placed on MEFs in chemically defined N2B27 medium40 supplemented with FGF2 (20 ng ml−1, Peprotech) and IWR1 (2.5 µM, Sigma Aldrich). After 4 day’s culture, epiblast outgrowths were dissociated with TrypLE (Life Technologies) and replated onto newly prepared MEFs in one well of a 12-well plate. rsEpiSCs were passaged every 3–4 days with TrypLE at a split ratio of 1:50. For clonal derivation of rsEpiSCs fromE6.5 and E7.5 embryos, isolated epiblasts were treated with trypsin-EDTA (0.25%, Life Technologies) for 10 min at 37 °C followed by repeated pipetting (~40 times) with a P200 pipette. Dissociated cells were passed through 40 µm cell strainer to obtain a single-cell suspension and cultured on MEFs in N2B27F/R1 media.
Derivation of rsEpiSCs from pre-implantation blastocysts
Timed-pregnant mice were euthanized for blastocyst collection at E3.5. Zona pellucidae were first removed from E3.5 blastocysts after brief treatment with acidic Tyrode’s solution (Millipore MR-004-D). ICMs were isolated using immunosurgery. In brief, to remove the trophectoderm layer, blastocysts were incubated with rabbit antimouse serum (Sigma-Aldrich) followed by guinea pig complement (Sigma-Aldrich) treatment. The trophectoderm layer was removed by repeated pipetting and ICMs were plated onto MEFs and cultured in N2B27F/R1 medium. After 5 day’s culture, ICM outgrowths were passaged using TrypLE (Life Technologies) and plated onto newly prepared MEFs.
Derivation and culture of mouse ESC lines
Embryo manipulations were performed under a dissecting microscope (Olympus SZX10). Blastocyst stage embryos were collected from timed-pregnant mice at E3.5 and used for ESC derivation. In brief, zona pellucidae were removed by brief treatment with acidic Tyrode’s solution (Millipore MR-004-D). After removing zona pellucidae, embryos were plated on MEF in N2B272ILIF medium: N2B27 basal medium supplemented with human leukemia inhibitory factor (LIF) (10 ng ml−1, Peprotech), 3 µM CHIR99021 (Selleckchem) and 1 µM PD035901 (Selleckchem). After 6 days in culture, ICM outgrowths were passaged using TrypLE and re-seeded onto newly prepared MEFs for further cultivation. Established mouse ESC lines were cultured either on MEF or poly-l-orinithine (Sigma-Aldrich) and laminin (BD Biosciences) coated plates and passaged every 3–4 days at a split ratio of 1:20.
Derivation and culture of mouse EpiSC lines
E5.75 and E6.5 embryos were used for EpiSCs derivation. In brief, isolated epiblasts were placed onto MEFs plates in EpiSC derivation media: N2B27 basal medium, 20% KnockOut serum replacement (Life Technologies), 20 ng ml−1 Activin-A (Peprotech) and 12 ng ml−1 FGF2 (Peprotech). After 3 days in culture, epiblast outgrowths were passaged as small clumps using collagenase IV (Life Technologies) and replated onto newly prepared MEFs. Established mouse EpiSCs were cultured in EpiSC culture media: N2B27 basal medium, 20% KnockOut serum replacement (KSR), 2 ng ml−1 Activin-A and 12 ng ml−1 FGF2. EpiSCs were cultured on MEF or FBS (Hyclone) coated plates and passaged using collagenase IV every 4–5 days.
Immunofluorescence
For immunofluorescence studies, isolated epiblasts and cells grown on chamber slides (BD Falcon) were fixed with freshly prepared 4% paraformaldehyde in PBS for 15 min at room temperature, and permeabilized/ blocked with 1% Triton-X in PBS-contained 10% FBS for 1 h at room temperature. The cells were incubated with primary antibodies in 1% FBS, 0.1% Triton-X in PBS overnight at 4 °C. The next day, cells were washed and incubated with fluorescent-labelled secondary antibodies (Molecular Probes) at 1:500 dilutions for 1 h at room temperature. Cells were washed and mounted in VECTASHIELD with DAPI (Vector Labs). Whole-mount staining of cultured embryos was performed as previously described26. Nuclei were counter stained with DAPI. Specimens were observed and visualized by a Zeiss LSM780 confocal microscope. Primary antibodies used in this study include: OCT-3/4 (1:200, Santa Cruz, SC-5279), BRACHYURY (T) (1:300, R&D, AF2085), SSEA-1 (1:50, DSHB, MC480), SSEA-4 (1:50, DSHB, MC-813-70), SOX2 (1:100, EMD Millipore, AB5603), NANOG (1:100, EMD Millipore, SC1000), FOXA2 (1:50, Santa Cruz, SC-6554), TUJI (1:1000, Sigma-Aldrich, T2200), α-SMA (1:600, Sigma-Aldrich, A5228), H3K27ME3 (1:100, Abcam, ab6002), TRA-1-60 (1:50, Santa Cruz, SC-21705), TRA-1-80 (1:50, Santa Cruz, SC-21706), DNMT3B (1:50, Santa Cruz, SC-10236).
RNA FISH
Mouse Xist probes with Quasar 570 dye were purchased from Biosearch Technologies (SMF-3011-1). FISH hybridization was performed following manufacture’s protocol (https://www.biosearchtech.com/assets/bti_stellaris_protocol_adherent_cell.pdf). Specimens were observed and visualized by a Zeiss LSM 780 confocal microscope.
Single-cell cloning assay
For mouse cell lines, 500 cells were seeded into 12-well plates on MEFs and cultured in mESC culture medium (N2B272ILIF), EpiSC culture medium (N2B27KSR+F/A with and without 10 µM Y-27632 treatment) and rsEpiSCs culture medium (N2B27F/R1), respectively. Five days after seeding, cells were fixed with 4% paraformaldehyde for 15 min at room temperature, and colonies were visualized by alkaline phosphatase staining (Vector Laboratories) and/or OCT4 (Santa Cruz, sc-5279) immunohistochemistry (DAB, sigma, D3939). For human cell lines, 500 cells were seeded into Matrigel-coated 12-well plates and cultured in mTeSR1 medium or human rsESC culture medium. Six days after seeding, cells were fixed with 4% paraformaldehyde for 15 min at room temperature, and colonies were visualized by alkaline phosphatase staining. For rhesus macaque cell lines, 500 cells were seeded into 12-well plates on MEFs and cultured in CDF12 medium or rhesus macaque rsESC culture medium. Six days after seeding, cells were fixed with 4% paraformaldehyde for 15 min at room temperature, and colonies were visualized by alkaline phosphatase staining and OCT4 immunohistochemistry.
Epiblast grafting and in vitro embryo culture
E7.5 mouse embryos (ICR) were dissected out from decidua. Reichert’s membrane, the parietal endoderm as well as the majority of the trophoblast layer, which is part of the parietal yolk sac, were completely removed from the embryos with fine forceps, resulting in a non-intact and non-viable embryo. Grafting cells into the non-intact embryo epiblast was performed manually with an aspirator tube assembly (Drummond) and a hand-pulled glass capillary (Drummond, Microcaps, 50 µl). Before grafting, cells were washed twice with PBS. The cells for grafting were scratched off culture plates using a 20 µl pipette tip, and then cut into small pieces containing 40–50 cells using a tungsten needle. The embryo was held loosely by forceps, and the pulled glass capillary was inserted into the indicated regions of the epiblast. A small volume of dissection medium was expelled out from the tip of the capillary to make an opening in the epiblast and sections of the epiblast/ectoderm, mesoderm and/or endoderm cells were removed from the embryo to further ensure the embryo is in a non-intact and non-viable status prior to grafting. A clump of cells was gently placed inside the opening and the glass capillary was slowly drawn out of the embryo. Injected non-intact embryos were applied to in vitro embryo culture in 50%commercial rat serum (Harlan, B.4520) as described previously41. After 36 h, cultured embryos were washed twice with PBS and fixed in 4% PFA overnight at 4 °C and subsequently used for immunohistochemical analysis, as described above. Kusabira-Orange-labelled mouse EpiSCs and rsEpiSCs, GFP-labelled human H9 ESC, H9 rsESC, and GFP-labelled rhesus macaque rsESC line ORMES23 were used for the grafting experiments. Please refer to Supplementary Fig. 1 for an illustrated diagram for the epiblast grafting procedure. The Wisconsin stem cell lines are not permitted for research involving mixing of Wisconsin Materials with an intact embryo, either human or non-human; implanting Wisconsin Materials or products of the Wisconsin Materials in a uterus; or attempting to make whole embryos with Wisconsin Materials by any method. Therefore, grafting of Wisconsin stem cell lines were performed only on non-intact, non-viable post-implantation mouse embryos in vitro. The experiments were approved by the Salk Institute embryonic stem cell research oversight committee.
Culture of primate PSCs and rsPSCs
Human ESC lines H1 (WA01) and H9 (WA09) were obtained from WiCell and authenticated by short tandem repeat (STR) profiling. Human and chimpanzee PSCs were cultured either on MEFs in CDF12 media containing DMEM/F12 (Life Technologies, 11330-032), 20% KnockOut serum replacement (Life Technologies, 10828), 2 mM Glutamax (Life Technolgies, 35050-061), 0.1 mM NEAA (Life Technologies, 11140-050), 0.1 mM β-mercaptoethanol (Gibco, 21985) and 4 ng ml−1 FGF2 (Peprotech), or on plates pre-coated with Matrigel (BD Biosciences) using mTeSR1 media42. Rhesus macaque PSCs were cultured on MEFs in CDF12 media. Conventional primate PSCs were passaged every 4–5 days either using collagenase IV (Life Technologies) (MEF) or Dispase (Sigma) (Matrigel) at a split ratio of 1:5. Human and chimpanzee rsPSCs were cultured either on MEFs or on plates pre-coated with Matrigel (BD Biosciences) using a customized mTeSR1 medium, where an mTeSR1 base medium42 lacking FGF2 and TGFβ1 was made in-house and was supplemented with 20 ng ml−1 FGF2 and 2.5 µM IWR1 to complete. rsPSCs were passaged every 4–5 days with TrypLE (Life Technologies) at a split ratio of 1:10. Rhesus macaque rsPSCs were cultured on MEF or plates pre-coated with FBS or Matrigel in a modified N2B27 medium: DMEM/F12 (Life Technologies, 11330-032) and Neurobasal medium (Life Technologies, 21103- 049) mixed at 1:1 ratio, 1 × N2 supplement (Life Technologies, 17502-048), 1 × B27 supplement (Life Technologies, 17504-044), 2 mM Glutamax (Life Technolgies, 35050-061), 0.1 mM NEAA (Life Technologies, 11140-050), 0.1 mM β-mercaptoethanol (Gibco, 21985) and 2 mg ml−1 BSA (Sigma), supplemented with FGF2 (Peprotech, 20 ng ml−1) and IWR1 (Sigma, 2.5 µM). Rhesus macaque rsPSCs were passaged every 4–5 days with TrypLE at a split ratio of 1:10. Tests for mycoplasma contamination were routinely performed for all the cell lines using PCR-based approach or MycoAlert mycoplasma detection kit (Lonza) following the manufacturer’s recommendation every ten passages.
Flow cytometry analysis
For intracellular FACS analysis, cells were first stained for cell surface markers and then fixed and permeabilized using the BD Cytofix/Cytoperm kit for staining of intracellular antigens. For cell-cycle analysis, human cells were fixed and permeabilized using the BD Cytofix/Cytoperm kit, stained with Alexa Fluor 647 anti-human Ki-67 (Biolegend) and DAPI and then analysed on a BD LSRFortessa cytometer. Mouse cells were fixed in cold 70% ethanol, stained with propidium iodide (ebioscience) and then analysed on a BD LSRFortessa cytometer. Other antibodies used for FACS analysis were: Stemgent StainAlive DyLight 488 anti-Human TRA-1-60 Antibody (09-0068), Stemgent StainAlive DyLight 488 Mouse IgM, κ Isotype Control (09-0072), R&D Systems anti-human/Mouse Oct-3/4 Allophycocyanin MAb (IC1759A), R&D Systems human/Mouse SSEA-4 Phycoerythrin MAb (FAB1435P), eBioscience anti-Human/Mouse SSEA-1 eFluor 660 (50-8813-41), Biolegend Alexa Fluor 488 anti-Tubulin Beta 3 (TUBB3) antibody (118213), Abcam anti-NANOG antibody (ab80892) and BD Pharmingen mouse anti-mouse NANOG antibody (560259).
Metabolic flux analysis
Seahorse bioscience extracellular flux (XF96) analyser was used to measure oxygen consumption rate and extracellular acidification rate of EpiSCs and rsEpiSCs. Cells were plated in XF96 Cell Culture Microplates (Seahorse bioscience, no. 101084-004) pre-coated with FBS at a density of 3–4 × 10⁴ per well. The next day cells were treated with XF Cell Mito Stress Test Kit (10 µgml−1 Oligomycin, 1 µM FCCP, 1 µM antimycin + 1 µM rotenone) or XF Glycolysis Stress Test Kit (10 mM Glucose, 10 µg ml−1 Oligomycin, 10 mM 2 Deoxy-d-glucose) and measured following the manufacturer’s instructions.
Primordial germ cell induction
PGC induction from mESCs was performed following a published protocol43. In brief, mESCs maintainted in N2B272ILIF media on poly-l-orinithine (Sigma-Aldrich) and laminin (BD Biosciences) coated plates were trypsinized, counted and about 1 × 10⁵ cells were seeded into one well of a 12-well plate pre-coated with human plasma fibronectin (15.7 µg ml−1, Millipore) in N2B27 medium containing 20 ng ml−1 Activin-A (Peprotech), 12 ng ml−1 FGF2 (Peprotech) and 1% KnockOut serum replacement (Life Technologies). The medium was changed daily. After 2 days in culture, PGC-Like Cells (PGCLCs) were induced by plating 1.0 × 10³ cells per well of low-cell-binding U-bottom 96-well plate (NUNC) in GK15 medium containing GMEM (Sigma), 15% KnockOut serum replacement, 0.1 mM sodium pyruvate, 0.1 mM NEAA, 0.1 mM β-mercaptoethanol, 2 mM Glutamax and 100 U ml−1 penicillin and 0.1 mg ml−1 streptomycin supplemented with BMP4 (500 ng ml−1; R&D Systems), BMP8B (500 ng ml−1; R&DSystems), LIF (10 ng ml−1; Peprotech), SCF (100 ng ml−1; Peprotech), and EGF (50 ng ml−1; Peprotech).
DNA constructs
For packaging of lentiviral vectors, pMDLg/pRRE, pRSV-Rev and pMD2.G plasmids were purchased from Addgene (12251, 12253 and 12259). To assess the efficiency of targeted mutagenesis at the LRRK2 locus, we purchased CAS9 expression (hCas9) and guide RNA cloning (gRNA_Cloning Vector) plasmids from Addgene (41815 and 41824)44. To construct the mCherry expression gRNA cloning vector (pCAGmCherry-gRNA), the CAG promoter driven mCherry expression cassette was subcloned into the gRNA cloning vector. The LRRK2 target chosen (AGATTCTTTAGATACTCTAG) is 20 bp in length, has a NGG protospacer adjacent motif (PAM) sequence at the downstream position, and was subcloned into pCAGmCherry-gRNA as per the following protocol (http://www.addgene.org/static/data/93/40/adf4a4fe-5e77-11e2-9c30-003048dd6500.pdf) using the following primers (5′-TTTCTTGGCTTTATATATCTTGTGGAAAG GACGAAACACCGGATTCTTTAGATACTCTAG-3′ and 5′-GACTAGCCTTA TTTTAACTTGCTATTTCTAGCTCTAAAACCTAGAGTATCTAAAGAAT CC-3′). To assess the frequency of homologous recombination mediated gene targeting, we purchased pCas9_GFP (Addgene 44719), pEGIP*35 (Addgene 26776) and tGFP (Addgene 26864). To construct the mutated GFP target gRNA expression vector, the mutated GFP target sequence (CAGGGTAATCTCGA GAGCTT) was subcloned into the gRNA_Cloning Vector as described above using the following primers (5′-TTTCTTGGCTTTATATATCTTGTGGAAAGGACG AAACACCGAGGGTAATCTCGAGAGCTT-3′ and 5′-GACTAGCCTTATTTT AACTTGCTATTTCTAGCTCTAAAACAAGCTCTCGAGATTACCCTC-3′). TALENs recognizing the target site were constructed using the Golden Gate Assembly method with the TALE Toolbox kit from Addgene (cat. no.1000000019)45. The constructed TALEN pair targeting the mutated GFP gene was named TALEN-L and TALEN-R.
Generating of a mutant eGFP human ESC reporter
To assess the efficiency of gene targeting in human ESCs and rsESCs, we established a mutated GFP gene-based reporter system, similar to one previously described56. In brief, pEGIP*35 was cotransfected with pMDLg/pRRE, pRSV-Rev and pMD2.G, and packaged and purified as lentiviral vectors according to a published protocol57. H9 human ESCs cultured on Matrigel were incubated with 10 µM Y-27632 overnight and then individualized with Accumax (Innovative Cell Technologies). Cells were transduced in suspension with lentiviral EGIP*35 vector in the presence of Y-27632 and 4 µg ml−1 polybrene for 1 h. After brief centrifugation to remove any residual lentiviral vector, the cells were seeded on irradiated DR4MEF feeders (ATCC) in CDF12 media containing 10 µM Y-27632. Three days after transduction, puromycin (1 µgml−1; Invitrogen) was added to the medium. After 2 weeks, ESC colonies were manually picked onto fresh MEF feeders and expanded as mutant eGFP reporter human ESC lines. To generate corresponding rsESCs, the mutant eGFP reporter ESCs were first converted to rsESCs after culturing in human rsESC medium for five passages before lentiviral infection.
Measurement of targeted mutagenesis with CRISPR/Cas9 in human ESCs and rsESCs
To compare the targeted mutagenesis efficiency in human H1 ESCs and rsESCs, 1.5 × 10⁷ feeder-free cultured cells were dissociated by TrypLE (Invitrogen), and resuspended in 1 ml of medium with or without 10 µM ROCK inhibitor Y-27632 for ESCs or rsESCs, respectively. These cells were electroporated with 20 µg of Cas9-2A-GFP expression vector (pCas9_GFP) and 20 µg of LRRK2 target mCherry-gRNA expression vectors, and were plated onto 100-mm dishes pre-coated with Matrigel. Two days after electroporation, the cells were dissociated by TrypLE, and Cas9 and gRNA expression cells were sorted out as eGFP/mCherry double-positive cells by BD influx cell sorter (BD), and ~10,000 cells were plated onto 100-mmdishes pre-coated with MMC-treated MEFs. Two weeks later, visible colonies were counted and each ~96 colonies were transferred to a 96-well plate and genomic DNA was extracted following a previous report46. To determine targeted mutant clones, the target LRRK2 site was PCR-amplified with the following primers: forward 5′-AGTCTCCAAAAATTGGGTCTTTGCCTGAGATAG ATTTGTC-3′ and reverse 5′-CCCAGTTTCTATTGGTCTCCTTAAACCTGT-3′ with PrimeSTAR GXL DNA Polymerase (TAKARA) following the manufacturer’s protocol. Amplicons were sequenced using an ABI 3730 sequencer (Applied Biosystems) with reverse primer.
Measurement of gene targeting efficiencies with CRISPR/Cas9 and TALEN in human ESCs and rsESCs
To compare the targeted mutagenesis efficiency in human mutant eGFP reporter ESCs and rsESCs, 2 × 10⁵ feeder-free cultured cells were dissociated by TrypLE (Invitrogen), and plated into 1 well of a 6-well plate with (ESCs) or without (rsESCs) 10 µM ROCK inhibitor Y-27632. The following day, the cells were transfected with a total of 2 µg of DNA using FuGENE HD (Promega). For CRISPR/Cas9-meditated gene targeting, 0.5 µg of Cas9 expression vector (hCas9), 0.5 µg of mutated GFP target gRNA expression vector and 1 µg of donor vector (tGFP) were co-transfected. For TALEN-mediated gene targeting, 0.5 µg of TALEN-L, 0.5 µg of TALEN-R and 1 µg of donor vector (tGFP) were co-transfected. Five days after transfection, GFP-positive cells were detected by BD LSRFortessa, and the gene-targeting frequencies per 5 × 10⁵ cells were determined.
Human iPSC generation
Reprogramming of human fibroblasts with episomal vectors was performed as previously described47 with minor modifications. Episomal plasmids pCXLE-EGFP (27082), pCXLE-hOCT3.4-shp53-F (27077), pCXLE-hSK (27078) and pCXLE-hUL (27080) were obtained from Addgene. 2 × 10⁶ human foreskin fibroblasts (HFF, ATCC, CRL-2429) or BJ fibroblasts (ATCC CRL-2522) were nucleofected with the episomal vectors using 4D-Nucleofector (Lonza) using P2 Primary Cell 4D-Nucleofector kit (Lonza, V4XP). Five days post-nucleofection fibroblasts were replated onto mitotically inactivated MEFs. The next day, medium was changed to human ESC culture media or human rsESC culture medium. Putative iPSC colonies were picked between day 24 and day 32 and transferred to newly prepared MEFs. For evaluating the efficiency and colony quality of iPSCs, on day 25 cells were fixed with 4% PFA for 15 min at room temperature and stained for alkaline phosphatase activity with Vectastain ABC-AP kit (Vector Laboratories).
RNA preparation and real-time PCR
Total RNAs were extracted by using the QIAGEN RNeasy mini kit or the micro kit according to the manufacturer’s instructions. RNAs were reverse-transcribed using iScript RT Supermix (Bio-Rad), and real-time PCR was performed using SsoAdvanced Universal SYBR Green Supermix in CFX384 (Bio-Rad). Expression levels of each gene were normalized to GAPDH (mouse) and HPRT (human) expression and calculated using comparative CT method.
Bisulfite sequencing
Genomic DNA was purified using DNeasy kit (Qiagen). Bisulfite conversion of genomic DNA was carried out using the Zymo EZ DNA Methylation-direct Kit (Zymo Research). Oct4, stella and Dppa5a promoter regions were amplified by EpiTaq HS (Takara) under the nested PCR condition: 1st PCR, 98 °C for 30 s, 35 cycles (98 °C for 10 s, 55 °C for 30 s, 72 °C for 30 s), 72 °C for 5 min; 2nd PCR, modified to 25 cycles. The sequences of PCR primers are described in Supplementary Table 8. PCR products were cloned into the pCR2.1-TOPO vector (Invitrogen) and sequenced. Sequence data was analysed using QUMA (http://quma.cdb.riken.jp).
DNA microarray and data analysis
Total RNA of all samples was extracted using TRIzol Reagent (Invitrogen) and purified by RNeasy Mini Kit (QIAGEN). Affymetrix Mouse Gene 2.0 ST Gene Expression Arrays were performed by the Genomics Core Facility at the Center for Regenerative Medicine in Barcelona according to the manufacturer’s protocol (Affymetrix). Gene expression clustering was performed using Cluster 3.0 and visualized using Java TreeView. PCA analysis was performed using R (http://www.r-project.org) and visualized in 3D using the rgl library.
RNA-seq and data analysis
RNA-seq libraries were sequenced on an Illumina HiSeq 2500 according to the manufacturer’s instructions. Reads were aligned to the human genome (hg19, GRCh37) using STAR (PMID: 23104886). RNA-seq alignments were normalized to the total number of aligned reads and visualized by using HOMER (http://homer.salk.edu/homer/)48 to generate custom tracks for the UCSC Genome Browser (http://genome.ucsc.edu/). Gene expression values were generating for RefSeq annotated transcripts using HOMER and differential expression calculations were performed using EdgeR49. Gene Ontology analysis was performed using DAVID (http://david.abcc.ncifcrf.gov/). GSEA analysis was performed using the GSEA software with default parameters and permutation number set to 100. Gene expression clustering was performed using Cluster 3.0 and visualized using Java TreeView. PCA analysis was performed using R and visualized in 3D using the rgl library. Spearman’s rank correlation matrix was used to compare rsEpiSCs with in vivo isolated four quadrants of the E6.5 epiblasts (anterior-proximal, anterior-distal, posterior-proximal and posterior-distal). Genes were selected from the RNA-seq data sets if the standard deviation of their fragments per kilobase of exon per million reads mapped (FPKM) values among the four in vivo epiblast samples is greater than 25% of the mean.
Chromatin Immunoprecipitation
ChIP experiments were carried out as described previously50 with modifications. In brief, cells were fixed with 1% formaldehyde at 37 °C for 10 min and then quenched with glycine at 37 °C for 5 min. Fixed cells were sonicated using Epishear (Active Motif) to achieve 200–700 bp size chromatin fragments. Solubilized chromatin was immunoprecipiated with antibody against H3K4me3 (Abcam 8580) and H3K27me3 (Millipore 07- 449). Antibody–chromatin complexes were pulled down using Dynabeads protein A (Invitrogen), washed and then eluted. After cross-linking reversal, RNase and proteinase K treatment, immunoprecipiated DNA was purified using AMPure beads (Beckman Coulter).
Library preparation and Illumina sequencing
ChIP DNA were end-repaired and 5′ phosphorylated using T4 DNA Polymerase, Klenow and T4 Polynucleotide Kinase (Enzymatics). A single adenine was added to 3′ ends by Klenow (3→5′ exo-), and double-stranded Bioo Illumina Adapters (Bioo Scientific) were ligated to the ends of the ChIP fragments. Adaptor-ligated ChIP DNA fragments were subjected to 15 cycles of PCR amplification using Q5 polymerase (NEB). AMPure beads were used to purify DNA after each step (Beckman Coulter). Pooled libraries were sequenced on the NextSeq500 for single-end 75 bp using high-output flowcell according to the manufacturer’s instructions. Reads were aligned to the reference genome (hg19, GRCh37) by using the program bowtie2 with default parameters. Mapped reads were then investigated for the presence of enrichment against the input. Peaks with a false-discovery rate lower or equal to 0.05 were kept for the further analysis. BEDtools package was used for detecting the Ensembl genes (version 70) overlapping with the detected peaks.
Preparation of methylC-seq libraries and sequencing
MethylC-seq libraries were prepared as previously described22,51,52. The only significant modification of the procedure was that the library amplification was performed with KAPA HiFi HotStart Uracil+ReadyMix (Kapa Biosystems KK2802) using the following PCR conditions: 2 min at 95 °C, 30 s at 98 °C, 4 cycles of (15 s at 98 °C, 30 s at 60 °C, 1 min at 72 °C), and 10 min at 72 °C. Libraries were sequenced on an Illumina HiSeq 2500 up to 101 cycles.
Processing of methylC-seq data and DMR calling
MethylC-seq reads were processed with MethylPy pipeline. (https://bitbucket.org/schultzmattd/methylpy/)53. Bowtie index for methylome mapping was constructed using the build_ref function imported from the methylpy.call_mc library. The mapping of methylC-seq reads were performed using the run_methylation_pipeline function imported from methylpy.call_mc library. The identification of differentially methylated regions (DMRs) was performed using the methylpy.DMRfind. DMRfind function imported from the methylpy.DMRfind library with a FDR cutoff of 0.01 for calling differentially methylated sites (DMSs). DMSs with methylation changes in the same direction were combined into DMRs if they were located within 250 bp of one another. DMRs containing less than four DMSs were discarded. DMRs showing consistent hyper- or hypomethylation states in biological replicates as determined by MethylPy were used for further analyses.
Bioinformatics of analysis of methylC-seq data
UMRs and LMRs were identified using MethylSeekR54 withm = 0.5 and a FDR cutoff of 0.05. The list of CpG islands was downloaded from the UCSC genome browser for the mm10 reference genome. Transcription start sites were defined by GENCODE M2 transcripts annotation. Gene Onotlogy analysis of rsEpiSCs hyper-DMRs was performed with GREAT with the default setting of ‘basal plus extension’ method55.
Extraction and metabolomics
Prepare 80:20 methanol:water solution (estimating 1 ml per sample), cool to −80 °C (4–16 h). Prepare another batch of 80:20 methanol:water solution (estimating 1 ml per sample), cool to 4 °C (overnight is preferred, but a few hours should be fine also). Thaw cell pellets on ice (approximately 20 min) and remove all residual PBS from top of cell pellets. Add 1 ml of −80 °C 80:20 methanol:water solution (keep this solution on dry ice to keep it cold) to cell pellet, mix and leave on dry ice for 15 min. Centrifuge at 2,000g, 5 min, 4 °C. Transfer supernatant onto precooled 4 ml glass vial on ice, set aside on ice. Add 0.5 ml 4 °C 80:20 methanol:water solution to cell pellet, mix and leave on ice for 15 min. Centrifuge at 2,000g, 5 min, 4 °C. Transfer supernatant into previous glass vial containing extract on ice, set aside on ice. Repeat with another 0.5 ml 4 °C 80:20 methanol:water, combine all supernatants (approximately 2 ml total volume). Dry under a gentle stream of nitrogen, flush each sample briefly with nitrogen, cap and store lipids at −80 °C and reconstitute in 1:1 methanol:- water for liquid chromatography–mass spectrometry.
Samples were analysed using a 15 cm SeQuant EMD Millipore ZIC pHILIC column (15 cm, 5 µm particle size, 2.1 mm inner diameter (ID)) at a flow rate of 0.100 ml per minute. Mobile phases A and B were 20 mM ammonium carbonate with 0.1% v/v ammonium hydroxide and acetonitrile, respectively. The mobile phase composition started at 100% B and decreased to 40% B over 20 min. Mobile phase B was then raised to 20% over 0.1 min and maintained at 20% B for 4.9 min for washing out the most strongly retained hydrophilic metabolites. The column was then allowed to re-equilibrate to starting conditions over 0.1 min of 100% B and kept there for the next 11.9 min. Samples were run on the Bruker Impact HD q-TOF mass spectrometer with internal calibration of each liquid chromatography– mass spectrometry run using sodium formate clusters at the beginning and end of the run. The instrument was carefully tuned to transmit low m/z ions.
Extraction and lipidomics
Harvest cells by scraping into cold PBS on ice, pellet cells at 1,400g, 3 min, 4 °C. Suspend cell pellet in small amount (50–100 µl) of PBS and transfer rest of cells into Teflon-capped glass vials on ice. Add aqueous buffer to 1 ml. Add 1 ml methanol followed by 2 ml chloroform. Shake vigorously for 30 s, then vortex on high for 15 s (room temperature). Centrifuge at 2,200g, 6 min, 4 °C. Gently remove chloroform (bottom) layer and transfer the chloroform into a clean vial, transfer again from the first clean vial into a second vial to remove additional aqueous contaminants. Dry chloroform under a gentle stream of nitrogen (30–45 min), flush each sample briefly with nitrogen, cap and store lipids at –80 °C and reconstitute in chloroform for liquid chromatography–mass spectrometry.
A Gemini C18 reversed phase column (5 µm, 4.6 × 50 mm, Phenomonex) and a C18 reversed phase guard column (3.5 µm, 2 × 20 mm, Western Analytical) were used for liquid chromatography–mass spectrometry analysis in negative mode. In positive mode, a Luna C5 reversed phase column (5 µm, 4.6 × 50 mm, Phenomonex) was used together with a C4 reversed phase guard column (3.5 µm, 2 × 20 mm, Western Analytical). 30 µl of each sample was injected using an autosampler. Mobile phase A consisted of a 95:5 water:methanol mixture and mobile phase B consisted of 60:35:5 2-propanol:methanol:water. In negative mode, 0.1% ammonium hydroxide was added to the mobile phases and in positive mode, 0.1% formic acid plus 5 mM ammonium formate were added. An Agilent 1200 series binary pump was set to a flow rate of 0.1 ml per min for the first 5 min followed by 0.4 ml per min for the remainder of the gradient. At 5 min, concomitant with the increase in flow rate, the gradient was increased from 0% B to 20% B. The gradient increased linearly to 100% B at 45 min, followed by an 8-min wash at 0.5 ml per min with 100% B before re-equilibrating the column with 0% B for 7 min. Mass spectrometry analysis was performed using an Agilent 6220 ESI-TOF fitted with an electrospray ionization (ESI) source. The capillary voltage was set to 3,500 kV and the fragmentor voltage to 100 V. The drying gas temperature was set to 350 °C at a flow rate of 10 l per min with a nebulizer pressure set to 45 p.s.i. Untargeted data were collected using a mass-to-charge range of m/z 100–1,500.
Mass spectrometry data analysis
Data analysis was performed with XCMS online to identify changing metabolites between samples. Samples (EpiSCs and rsEpiSCs) were compared and differences were ranked according to statistical significance as calculated by an unpaired Student’s t test. For the volcano plot, data were obtained from the 60-min profiling analysis in negative and positive mode and the data were filtered based on retention time range (5–40 min) and abundance (>5 × 10³ counts). For the metabolite and lipid identification each ion was inspected to ensure that the differences identified by XCMS were reflected in the raw data. Many of the ions in the volcano plots belonged to di-, tri- and tetrapeptides and were not annotated in our final metabolite lists. The metabolite IDs listed are based on metabolites in the METLIN database that are within 5 p.p.m. of the experimental mass measured. This is all done automatically in XCMS online. In several cases, more than one metabolite is identified for a given mass because they all have the same formula. Where required we selected the metabolite that was most appropriate (that is, a mammalian metabolite versus a drug with the same formula) and listed that metabolite.
Extended Data
Extended Data Figure 1. The effects of culture parameters on epiblast explants.
Isolated epiblasts from E5.75 embryos were plated onto mitotically inactivated MEFs in the following media. a, In EpiSC derivation medium containing 20% KnockOut serum replacement (KSR), 20 ng ml−1 Activin-A and 12 ng ml−1 FGF2. Day 3 outgrowth was stained with pluripotency markers OCT4 and SSEA-1. b, In N2B27 media supplemented with indicated growth factors and small molecules. After 4 days, outgrowths of plated epiblasts were stained forOCT4 and SSEA-1. c, Percentages of SSEA-1+/OCT4+ cells in day 4 epiblast outgrowths in N2B27KSR+F/A and N2B27F/R1 culture conditions. A simple randomization method was applied to randomly pick the microscope fields of views for counting the number of SSEA-1+/OCT4+ cells and total cell numbers. PC, phase contrast. For examining different culture parameter effects, all isolated E5.75 epiblasts were pooled together and randomly allocated to each condition.
Extended Data Figure 2. Mechanistic studies of rsEpiSC derivation.
Isolated epiblasts from E5.75 embryos were plated onto mitotically inactivated MEFs in the following media. a, In N2B27 media with indicated treatments. NT, no treatment. After 4 days, outgrowths of plated epiblasts were stained with endodermal marker FOXA2, mesodermal marker T, neuroectodermal marker SOX2 and pluripotent marker OCT4. b, In N2B27 media supplemented with either 20% FBS (top) or 20% KnockOut serum replacement (KSR; bottom). Day 4 outgrowths were fixed and stained with mesodermal marker T and pluripotency marker OCT4. Nuclei were counterstained with DAPI. Scale bar, 125 µm.
Extended Data Figure 3. Highly efficient derivation of rsEpiSCs.
a, Derivation of rsEpiSCs with different passaging methods: collagenase IV (top) and trypsin (bottom). Shown are phase-contrast images of day 4 epiblast outgrowths and cells at passage 1 (P1) and passage 10 (P10). b, Derivation efficiency is compared between EpiSCs and rsEpiSCs using isolated E5.75 epiblasts from three different mouse strains. c, Derivation of rsEpiSCs using epiblasts isolated from different developmental stages of postimplantation embryos. Typical morphologies of staged embryos at E5.25, 5.75, 6.5, 7.25 and 7.5 are shown in the left panel. Day 2 and day 4 epiblast outgrowths as well as colonies of P1 are shown. d, Real-time quantitative PCR analysis of expression of pluripotent (Oct4, Sox2 and Nanog), naive (Rex1 and Klf2) and primed (Otx2 and Fgf5) PSC marker genes in mouse ESCs and rsEpiSCs derived from different post-implantation developmental stages. Error bars indicate s.d. (n = 3, biological samples). e, Derivation of rsEpiSCs from E3.5 pre-implantation blastocysts. Zona pellucida was removed with acidic Tyrode’s solution, followed by the removal of trophectoderm by immunosurgery. Isolated inner cell mass was used for the derivation of rsEpiSCs. Arrows and arrowheads point to the intact trophectoderm and destroyed trophectoderm, respectively. f, Schematic representation of dissection of isolated E6.5 epiblasts into four pieces: anterior-proximal (AP), anterior-distal (AD), posterior-proximal (PP) and posterior-distal (PD). g, Derivation of rsEpiSCs from four regions of E6.5 epiblasts. Day 2 and day 4 epiblast outgrowths as well as colonies of passage 5 (P5) are shown. h, Real-time quantitative PCR analysis of expression of pluripotent (Oct4, Sox2 and Nanog), naive (Rex1 and Klf2) and primed (Otx2 and Fgf5) PSC marker genes in rsEpiSCs derived from whole, AP, AD, PP and PD regions of E6.5 epiblasts. Error bars indicate s.d. (n = 3, biological samples). i, Derivation of rsEpiSCs using other Wnt inhibitors: XAV939 (2.5 µM) and IWP2 (2.5 µM). Day 4 epiblast outgrowths and colonies at passage 10 (P10) were shown. j, Real-time quantitative PCR analysis of expression of pluripotent (Oct4, Sox2 and Nanog), endodermal (Sox17 and Gsc), mesodermal (Eomes and Mixl1) and neuroectodermal (Sox1 and Pax6) marker genes in rsEpiSCs derived using different Wnt inhibitors. Error bars indicate s.d. (d, h, j, n = 3, biological replicates).
Extended Data Figure 4. Characterization of rsEpiSCs.
a, Quantitative PCR analysis of expression of pluripotent, naive and primed PSC markers in mouse ESCs, EpiSCs and rsEpiSCs. Error bars indicate s.d. (n = 3, biological replicates); t-test, **P < 0.01, *P < 0.05. b, Expression of OCT4, NANOG, SOX2, DNMT3B and SSEA-1 proteins in mouse rsEpiSCs was analysed by immunofluorescence. Mouse rsEpiSCs also displayed weak alkaline phosphatase activity and showed positive H3K27me3 foci confirming an inactivated X chromosome in female rsEpiSCs. c, Western blot analyses of OCT4, NANOG and SOX2 protein levels in mouse ESCs, EpiSCs and four different lines of rsEpiSCs. β-actin was used as loading control. For NANOG, an additional long-exposure image was shown (without ESC sample loaded). For full scan associated with b, refer to Supplementary Information. d, DNA methylation patterns of Oct4, Dppa5 and Stella promoters in mESCs, EpiSCs and rsEpiSCs. e, Representative bright-field images showing colonies stained by immunohistochemistry for OCT4 expression after being plated at clonal density (500 cells per well), and cultured for 5 days. Y27632 was added at 10 µM. f, Karyotype analysis of mouse rsEpiSCs indicates a normal diploid chromosome content. g, Flow cytometry analysis of OCT4, SOX2 and NANOG expression in mouse ESCs, EpiSCs and rsEpiSCs. h, Cell-cycle profiles of mouse ESCs and rsEpiSCs analysed by flow cytometry. i, Haematoxylin and eosin staining images of teratomas generated by rsEpiSCs show lineage differentiation towards three germ layers. j, Teratomas generated by rsEpiSCs showed tri-lineage differentiation as examined by immunofluorescence analysis using FOXA2 (endoderm), TUJ1 (neuroectoderm) and ASMA (mesoderm) antibodies. k, Teratomas generated by injecting indicated number of cells in testis of NOD/SCID male mice. EpiSCs and three different lines of rsEpiSCs were used for comparison. After one month, mice were euthanized. Teratomas were retrieved and measured in size and weight. (EpiSCs, n = 1, biological replicate, two technical replicates; rsEpiSCs, n = 3, biological replicates, two technical replicates per line; error bars, s.d.) l, Flow cytometry analysis of TUJ1, ASMA and Ep-CAM expression in teratomas generated by EpiSCs and three different lines of rsEpiSCs. m, Bright-field images of isolated non-intact and non-viable E7.25–7.5 mouse embryos before and after in vitro embryo culture.
Extended Data Figure 5. Mechanistic studies of rsEpiSCs self-renewal.
a, Phase-contrast images showing colony morphologies of rsEpiSCs after 4 days of indicated treatments. Left, N2B27 media alone; right, N2B27F/R1. b, Quantitative PCR analysis of expression of pluripotent (Oct4, Sox2 and Nanog), endodermal (Sox17 and Gsc), mesodermal (Eomes and Mixl1) and neuroectodermal (Sox1 and Pax6) markers after indicated treatments for 4 days in culture. Error bars indicate s.d. (n = 3, biological replicates). c, Schematic representation of how different signalling pathways are involved in promoting or inhibiting self-renewal of rsEpiSCs.
Extended Data Figure 6. Global transcriptomic and epigenomic analysis.
a, Hierarchical clustering of microarray gene expression data from ESCs, EpiSCs, rsEpiSCs and in vivo isolated E5.75 and E6.5 epiblasts. b, Two-way scatter plot of gene expression data from RNA-seq of EpiSCs and rsEpiSCs. Black lines indicate fourfold cut-off in expression level difference. Pearson correlation coefficient (r) between samples is shown at the upper right corner. c, Top five Gene Ontology (GO) terms enriched in the set of genes that are differentially expressed by at least fourfold (either up or down) between rsEpiSCs and EpiSCs. d, Average H3K27me3 signal at Polycomb target genes in rsEpiSCs (purple) and EpiSCs (green). e, Plots of DNA methylation and histone methylation (H3K4me3 and H3K27me3) signals around the transcription start sites of representative classes of genes. Examples given include pluripotent genes (Sall4, Klf4 and Lin28a), neuronal-related genes (Sox2, Gbx2 and Sox1) and cell-membrane-related genes (Cldn6, Cldn3 and Cdh1). f, Global cytosine methylation at CG sites (mCG) levels of EpiSCs and rsEpiSCs (top left). The numbers of hyper- and hypo-DMRs discovered in rsEpiSCs (top right). The numbers of promoter-associated (transcription start site ± 2.5 kb), distal (>10 kb from transcription start site) and proximal (transcription start site ± 2.5 to 10 kb) rsEpiSCs hyper- and hypo-DMRs (bottom). g, Positive correlation between the amount of gene body non-CG DNA methylation and the level of gene expression. h, Gene Ontology biological process and molecular function term enrichment for genomic regions associated with rsEpiSCs hyper-DMRs. i, PC1–PC2 plane from PCA analysis of transcriptome comparison between samples from this study (rsEpiSCs (circled with red line) and EpiSCs (circled with yellow line)) and a published data set6 (in vivo epiblast isolated from different developmental stages (CAV, cavity; PS, pre-streak; LMS, late mid-streak; LS, late streak; OB, no bud; EB, early bud; LB, late bud) and EpiSCs (circled with thick blue line)). The green arrow through the in vivo samples delineates a progressing ‘developmental axis’. j, Hierarchical clustering of rsEpiSCs (red), EpiSCs (both from this study (yellow) and ref. 6 (blue)) and epiblasts of CAV, PS, LMS, LS, OB, EB and LB stages (green) using data from all annotated probes. k, Relative expression between rsEpiSCs and in vivo late-streak-stage epiblast (ref. 6) of genes characteristic of anterior mesendoderm (AME), anterior definitive endoderm (ADE), anterior primitive streak (APrS), whole primitive streak (PrS) and posterior primitive streak (PPrS). i, Primordial germ cell induction from Blimp1–YFP mESCs and rsEpiSCs. Left, before induction, both mESCs and rsEpiSCs were found negative for YFP; successful induction was observed with mESCs, as indicated by a positive YFP signal in cell aggregates, but not with rsEpiSCs. Right, PGC induction efficiency was compared between Blimp1–YFP mESCs and rsEpiSCs. Error bars indicate s.d. (n = 3, independent experiments); t-test, **P < 0.01, *P < 0.05. CAV, cavity; PS, pre-streak; ES, early streak; MS, mid-streak; LMS, late mid-streak; LS, late streak; OB/EB, no bud/early bud; LB, late bud.
Extended Data Figure 7. Metabolic profiling of EpiSCs and rsEpiSCs.
a, Basal respiration, b, c, Maximum respiration (b) and ATP production (c) were determined by calculating the average oxygen consumption rate (OCR) for each phase in EpiSCs and rsEpiSCs. d, e, f, Glycolysis (d), glycolytic capacity (e) and reserve glycolysis (f) were determined by calculating the average extracellular acidification rate (ECAR) for each phase in EpiSCs and rsEpiSCs. (Graph Pad Prism v5). g, Representative graph showing the oxygen consumption rate in response to oligomycin, FCCP and rotenone/antimycin of EpiSCs and rsEpiSCs (n = 4). h, Heat map of differentially expressed genes for mitochondrial complex COX and enzymes involved in glycolysis and the tricarboxylic acid cycle selected from the RNA-seq data set, P < 0.05. i, j, Volcano plots of hydrophilic (metabolomics) and hydrophobic (lipidomics) metabolites show broad changes in metabolite levels between EpiSCs and rsEpiSCs. Error bars indicate s.d.; t-test, **P < 0.01, *P < 0.05 (a–g, n = 6, technical replicates).
Extended Data Figure 8. F/R1-based culture supports self-renewal of human ESCs as well as iPSC generation.
a, Expression of pluripotency markers SOX2, NANOG, TRA-1-60, TRA-1-80 and SSEA-4 in human H1 rsESCs. b, Representative bright-field images showing colonies visualized by alkaline phosphatase (AP) staining after being plated at clonal density (1,000 cells per well) and cultured for 6 days. Y27632 was added at 10 µM. c, Real-time quantitative PCR analysis of expression of pluripotency marker genes (OCT4, SOX2, NANOG and LIN28) and lineage marker genes (T, NKX1-2 andWNT3) in H1 ESCs, human-foreskin-fibroblast-derived iPSCs, H1 rsESCs and human-foreskin-fibroblast-derived rs-iPSCs. Error bars indicate s.d. (n = 3, biological replicates). d, Haematoxylin and eosin staining images of teratomas generated from human H1 rsESCs show lineage differentiation towards three germlayers. e, Karyotype analysis of human H9 rsESCs indicates a normal diploid chromosome content. f, Representative bright-field images showing morphologies of putative iPSC colonies in conventional F/A-based human ESC culture and F/R1-based culture conditions (top). Alkaline phosphatase staining at day 25 post-nucleofection indicates a larger colony size in F/R1-based culture (bottom). g, Efficiency of iPSC generation in conventional F/A-based human ESC culture conditions and F/R1-based culture conditions. Error bars indicate s.d. (n = 3, independent experiments). h, Quality of human iPSC-like colonies generated in F/A-based and F/R1-based culture conditions. Partial and full alkaline-phosphatase-positive iPSC-like colonies were counted separately using the criteria shown on the right. Error bars indicate s.d. (n = 3, independent experiments). i, Phase-contrast image showing morphology of human-foreskin-fibroblast-derived rs-iPSCs. j, Graphic representation of H3K4me3 and H3K27me3 ChIP-Seq signals near the transcription start site (TSS) for Polycomb target genes in H1 ESCs and H1 rsESCs. k, Average H3K27me3 signal at Polycomb target genes in H1 rsESCs (purple) and H1 ESCs (green). i, Cell-cycle profiles of H1 ESCs and H1 rsESCs were analysed by flow cytometry. m, Flow cytometry analysis of OCT4, SOX2, NANOG and TRA-1-60 protein expression in H1 ESCs and H1 rsESCs.
Extended Data Figure 9. Genome editing in human rsESCs.
a, Schematic representation of the targeted mutagenesis approach employed in human ESCs and rsESCs by CRISPR/Cas9. b, Targeted mutagenesis efficiencies at the LRRK2 locus in human ESCs (treated with Y27632, 10 µM) and rsESCs. c, Schematic representation of the CRISPR/Cas9- or TALEN-mediated gene correction approaches in human ESCs and rsESCs containing a mutated GFP gene. d, GFP correction efficiencies in human ESCs (treated with Y27632, 10 µM) and rsESCs by CRISPR/Cas9 or TALEN. The y axis shows the gene correction efficiency, which was calculated as GFP-positive cells per 5 × 10⁵ cells. Error bars indicate s.d. (n = 3, independent experiments).
Extended Data Figure 10. Non-human primate rsPSCs.
a, Phase-contrast images of colony morphologies of rhesus macaque rsESCs (ORMES22 and ORMES23), rhesus macaque rsiPSCs and chimpanzee rsiPSCs. b, Immunofluorescence images of NANOG, SOX2, DNMT3b, TRA-1-60 and TRA-1-80 protein expression in ORMES23 rsESCs. ORMES23 rsESCs were also stained for alkaline phosphatase (AP) activity and OCT4 immunohistochemistry (top right). c, Haematoxylin and eosin staining images of teratomas generated by chimpanzee rsiPSCs show lineage differentiation towards three germ layers. d, Schematic representation of epiblast grafting experiment with GFP-labelled ORMES23 rsESCs (Please refer to Supplementary Fig. 1 for details). A, anterior; P, posterior; D, distal. e, Fluorescence images of grafted embryos after in vitro culture. GFP-labelled ORMES23 rsESCs were grafted to posterior, distal and anterior regions of epiblasts of isolated non-intact and non-viable E7.5 mouse embryos and cultured in vitro for 36 h before fixation and visualization by an inverted fluorescence microscope. Arrowhead indicates a cell clump failed to distribute. Dashed line indicates dispersed cells in the posterior region of grafted embryo. Blue, DAPI. Insets show higher-magnification images of GFP-labelled cells. f, Top, quantification of the extent of cell spreading of GFP-labelledORMES23 rsESCs after being grafted to different regions of E7.5 mouse epiblasts. Bottom, incorporation efficiency of grafted GFP-labelled ORMES23 rsESCs in mouse E7.5 epiblasts. Error bars indicate s.d. (n, indicated on the graph, independent experiments); t-test, *P < 0.05.
Supplementary Material
Acknowledgments
We would like to thank S. Mitalipov and J. Thomson for providing rhesus ESCs and iPSCs, respectively, F. Gage for providing chimpanzee iPSCs, K. Zhang for assistance with cell line derivation, M. Ku of the H. A. and Mary K. Chapman Charitable Foundations Genomic Sequencing Core for performing RNA-seq and mouse ChIP-seq experiments, M. Chang of the Integrative Genomic and Bioinformatics Core for bioinformatics analysis, W. T. Berggren and the staff of the Salk STEM Core for preparation of custom-mTeSR1 base medium and supply of validated stem culture materials, G. Pao and K. Hasegawa for discussions, Y. Dayn from transgenic core facility and J. Luo for blastocyst injections, Y. Tsunekawa for providing the mutant eGFP human ESCs reporter line, E. O’Connor and K. Marquez of Human Embryonic Stem Cell Core Facility of Sanford Consortium for Regenerative Medicine for FACS sorting, R. H. Benitez, A. Goebl, R. D. Soligalia for assistance with genome editing, M. F. Pera for critical reading of the manuscript, and M. Schwarz, and P. Schwarz for administrative help. M.L. and K.S. are supported by a California Institute for Regenerative Medicine Training Grant. We thank J. L. Mendoza for his support on this project. This work was funded in part by UCAM (mouse studies). J.R.E. is an Investigator of the Howard Hughes Medical Institute. P.G. was supported by Fundacion Pedro Guillen. Work in the laboratory of J.C.I.B. was supported by G. Harold and Leila Y. Mathers Charitable Foundation, The Leona M. and Harry B. Helmsley Charitable Trust and The Moxie Foundation.
Footnotes
Online Content Methods, along with any additional Extended Data display items and Source Data, are available in the online version of the paper; references unique to these sections appear only in the online paper.
Supplementary Information is available in the online version of the paper.
Author Contributions J.W., D.O. and J.C.I.B. conceived the study. J.W. and D.O. derived mESC, EpiSC and rsEpiSC lines. J.W., D.O. and C.R.E. designed and performed in vivo embryo grafting experiments. J.W., D.O., M.L., K.S., L.M., Z.L., T.H. and P.R. designed and performed all in vitro experiments; J.M.C., J.L. and P.G. helped project design and discussions and performed microarray experiments. I.T., Y.T. performed bisulfite sequencing experiments; M.K. performed teratoma studies; C.L., Y.H., Z.Z., J.R.N. and J.E. performed whole-genome bisulfite sequencing experiments and analysed data. T.D. and B.R. performed ChIP-seq experiments. C.B. and M.L. performed bioinformatics analysis. A.S. analysed global metabolic profiling data; E.A. and N.K. provided technical support. J.W., D.O., M.L. and J.C.I.B. prepared the manuscript.
Microarray, RNA-seq, ChIP-seq and MethylC-seq data have been deposited in the Gene Expression Omnibus under accession number GSE60605.
The authors declare no competing financial interests.
References
- 1.Evans MJ, Kaufman MH. Establishment in culture of pluripotential cells from mouse embryos. Nature. 1981;292:154–156. doi: 10.1038/292154a0. [DOI] [PubMed] [Google Scholar]
- 2.Martin GR. Isolation of a pluripotent cell line from early mouse embryos cultured in medium conditioned by teratocarcinoma stem cells. Proc. Natl Acad. Sci. USA. 1981;78:7634–7638. doi: 10.1073/pnas.78.12.7634. [DOI] [PMC free article] [PubMed] [Google Scholar]
- 3.Martello G, Smith A. The nature of embryonic stem cells. Annu. Rev. Cell Dev. Biol. 2014;30:647–675. doi: 10.1146/annurev-cellbio-100913-013116. [DOI] [PubMed] [Google Scholar]
- 4.Tesar PJ, et al. New cell lines from mouse epiblast share defining features with human embryonic stem cells. Nature. 2007;448:196–199. doi: 10.1038/nature05972. [DOI] [PubMed] [Google Scholar]
- 5.Brons IGM, et al. Derivation of pluripotent epiblast stem cells from mammalian embryos. Nature. 2007;448:191–195. doi: 10.1038/nature05950. [DOI] [PubMed] [Google Scholar]
- 6.Kojima Y, et al. The transcriptional and functional properties of mouse epiblast stem cells resemble the anterior primitive streak. Cell Stem Cell. 2014;14:107–120. doi: 10.1016/j.stem.2013.09.014. [DOI] [PubMed] [Google Scholar]
- 7.Nichols J, Smith A. Naive and primed pluripotent states. Cell Stem Cell. 2009;4:487–492. doi: 10.1016/j.stem.2009.05.015. [DOI] [PubMed] [Google Scholar]
- 8.Zhou W, et al. HIF1α induced switch from bivalent to exclusively glycolytic metabolism during ESC-to-EpiSC/hESC transition. EMBO J. 2012;31:2103–2116. doi: 10.1038/emboj.2012.71. [DOI] [PMC free article] [PubMed] [Google Scholar]
- 9.Tam PPL, Loebel DAF. Gene function in mouse embryogenesis: get set for gastrulation. Nature. Rev. Genet. 2007;8:368–381. doi: 10.1038/nrg2084. [DOI] [PubMed] [Google Scholar]
- 10.Tam PP, Zhou SX. The allocation of epiblast cells to ectodermal and germ-line lineages is influenced by the position of the cells in the gastrulating mouse embryo. Dev. Biol. 1996;178:124–132. doi: 10.1006/dbio.1996.0203. [DOI] [PubMed] [Google Scholar]
- 11.Chenoweth JG, McKay RDG, Tesar PJ. Epiblast stem cells contribute new insight into pluripotency and gastrulation. Dev. Growth Differ. 2010;52:293–301. doi: 10.1111/j.1440-169X.2010.01171.x. [DOI] [PubMed] [Google Scholar]
- 12.Greber B, et al. Conserved and divergent roles of FGF signaling in mouse epiblast stem cells and human embryonic stem cells. Cell Stem Cell. 2010;6:215–226. doi: 10.1016/j.stem.2010.01.003. [DOI] [PubMed] [Google Scholar]
- 13.Hayashi K, Ohta H, Kurimoto K, Aramaki S, Saitou M. Reconstitution of the mouse germ cell specification pathway in culture by pluripotent stem cells. Cell. 2011;146:519–532. doi: 10.1016/j.cell.2011.06.052. [DOI] [PubMed] [Google Scholar]
- 14.Tsakiridis A, et al. Distinct Wnt-driven primitive streak-like populations reflect in vivo lineage precursors. Development. 2014;141:1209–1221. doi: 10.1242/dev.101014. [DOI] [PMC free article] [PubMed] [Google Scholar]
- 15.Sumi T, Oki S, Kitajima K, Meno C. Epiblast ground state is controlled by canonical Wnt/β-catenin signaling in the postimplantation mouse embryo and epiblast stem cells. PLoS ONE. 2013;8:e63378. doi: 10.1371/journal.pone.0063378. [DOI] [PMC free article] [PubMed] [Google Scholar]
- 16.Berge D&t, et al. Embryonic stem cells require Wnt proteins to prevent differentiation to epiblast stem cells. Nature Cell Biol. 2011;13:1–8. doi: 10.1038/ncb2314. [DOI] [PMC free article] [PubMed] [Google Scholar]
- 17.Kim H, et al. Modulation of β-catenin function maintains mouse epiblast stem cell and human embryonic stem cell self-renewal. Nat. Commun. 2013;4:2403. doi: 10.1038/ncomms3403. [DOI] [PMC free article] [PubMed] [Google Scholar]
- 18.Ying Q-L, et al. The ground state of embryonic stem cell self-renewal. Nature. 2008;453:519–523. doi: 10.1038/nature06968. [DOI] [PMC free article] [PubMed] [Google Scholar]
- 19.Najm FJ, et al. Isolation of epiblast stem cells from preimplantation mouse embryos. Cell Stem Cell. 2011;8:318–325. doi: 10.1016/j.stem.2011.01.016. [DOI] [PMC free article] [PubMed] [Google Scholar]
- 20.Watanabe K, et al. A ROCK inhibitor permits survival of dissociated human embryonic stem cells. Nature Biotechnol. 2007;25:681–686. doi: 10.1038/nbt1310. [DOI] [PubMed] [Google Scholar]
- 21.Huang Y, Osorno R, Tsakiridis A, Wilson V. In vivo differentiation potential of epiblast stem cells revealed by chimeric embryo formation. Cell. Rep. 2012;2:1571–1578. doi: 10.1016/j.celrep.2012.10.022. [DOI] [PubMed] [Google Scholar]
- 22.Lister R, et al. Human DNA methylomes at base resolution show widespread epigenomic differences. Nature. 2009;462:315–322. doi: 10.1038/nature08514. [DOI] [PMC free article] [PubMed] [Google Scholar]
- 23.Tautenhahn R, Patti GJ, Rinehart D, Siuzdak G. XCMS Online: a web-based platform to process untargeted metabolomic data. Anal. Chem. 2012;84:5035–5039. doi: 10.1021/ac300698c. [DOI] [PMC free article] [PubMed] [Google Scholar]
- 24.Tautenhahn R, et al. An accelerated workflow for untargeted metabolomics using the METLIN database. Nature Biotechnol. 2012;30:826–828. doi: 10.1038/nbt.2348. [DOI] [PMC free article] [PubMed] [Google Scholar]
- 25.Okamura D, Kimura T, Nakano T, Matsui Y. Cadherin-mediated cell interaction regulates germ cell determination in mice. Development. 2003;130:6423–6430. doi: 10.1242/dev.00870. [DOI] [PubMed] [Google Scholar]
- 26.Okamura D, Hayashi K, Matsui Y. Mouse epiblasts change responsiveness to BMP4 signal required for PGC formation through functions of extraembryonic ectoderm. Mol. Reprod. Dev. 2005;70:20–29. doi: 10.1002/mrd.20136. [DOI] [PubMed] [Google Scholar]
- 27.Downs KM, Davies T. Staging of gastrulating mouse embryos by morphological landmarks in the dissecting microscope. Development. 1993;118:1255–1266. doi: 10.1242/dev.118.4.1255. [DOI] [PubMed] [Google Scholar]
- 28.Alev C, et al. Transcriptomic landscape of the primitive streak. Development. 2010;137:2863–2874. doi: 10.1242/dev.053462. [DOI] [PubMed] [Google Scholar]
- 29.Fossat N, Pfister S, Tam PPL. A transcriptome landscape of mouse embryogenesis. Dev. Cell. 2007;13:761–762. doi: 10.1016/j.devcel.2007.11.011. [DOI] [PubMed] [Google Scholar]
- 30.Acloque H, Adams MS, Fishwick K, Bronner-Fraser M, Nieto MA. Epithelialmesenchymal transitions: the importance of changing cell state in development and disease. J. Clin. Invest. 2009;119:1438–1449. doi: 10.1172/JCI38019. [DOI] [PMC free article] [PubMed] [Google Scholar]
- 31.Mitalipov S, et al. Isolation and characterization of novel rhesus monkey embryonic stem cell Lines. Stem Cells. 2006;24:2177–2186. doi: 10.1634/stemcells.2006-0125. [DOI] [PubMed] [Google Scholar]
- 32.Marchetto MCN, et al. Differential L1 regulation in pluripotent stem cells of humans and apes. Nature. 2013;503:525–529. doi: 10.1038/nature12686. [DOI] [PMC free article] [PubMed] [Google Scholar]
- 33.Pera MF. In search of naivety. Cell Stem Cell. 2014;15:543–545. doi: 10.1016/j.stem.2014.10.013. [DOI] [PubMed] [Google Scholar]
- 34.Beddington RS, Robertson EJ. Axis development and early asymmetry in mammals. Cell. 1999;96:195–209. doi: 10.1016/s0092-8674(00)80560-7. [DOI] [PubMed] [Google Scholar]
- 35.Wu J, Belmonte JCI. Stem cells: a designer’s guide to pluripotency. Nature. 2014;516:172–173. doi: 10.1038/516172a. [DOI] [PubMed] [Google Scholar]
- 36.Tonge PD, et al. Divergent reprogramming routes lead to alternative stem-cell states. Nature. 2014;516:192–197. doi: 10.1038/nature14047. [DOI] [PubMed] [Google Scholar]
References
- 37.Yoshimizu T, et al. Germline-specific expression of the Oct-4/green fluorescent protein (GFP) transgene in mice. Dev. Growth Differ. 1999;41:675–684. doi: 10.1046/j.1440-169x.1999.00474.x. [DOI] [PubMed] [Google Scholar]
- 38.Fooksman DR, Nussenzweig MC, Dustin ML. Myeloid cells limit production of antibody-secreting cells after immunization in the lymph node. J, Immunol. 2014;192:1004–1012. doi: 10.4049/jimmunol.1300977. [DOI] [PMC free article] [PubMed] [Google Scholar]
- 39.Ciruna B, Rossant J. FGF signaling regulates mesoderm cell fate specification and morphogenetic movement at the primitive streak. Dev. Cell. 2001;1:37–49. doi: 10.1016/s1534-5807(01)00017-x. [DOI] [PubMed] [Google Scholar]
- 40.Tong C, Huang G, Ashton C, Li P, Ying Q-L. Generating gene knockout rats by homologous recombination in embryonic stem cells. Nature Protocols. 2011;6:827–844. doi: 10.1038/nprot.2011.338. [DOI] [PMC free article] [PubMed] [Google Scholar]
- 41.Glanville-Jones HC, Woo N, Arkell RM. Successful whole embryo culture with commercially available reagents. Int. J. Dev. Biol. 2013;57:61–67. doi: 10.1387/ijdb.120098ra. [DOI] [PubMed] [Google Scholar]
- 42.Ludwig TE, et al. Feeder-independent culture of human embryonic stem cells. Nature Methods. 2006;3:637–646. doi: 10.1038/nmeth902. [DOI] [PubMed] [Google Scholar]
- 43.Hayashi K, Saitou M. Generation of eggs from mouse embryonic stem cells and induced pluripotent stem cells. Nature Protocols. 2013;8:1513–1524. doi: 10.1038/nprot.2013.090. [DOI] [PubMed] [Google Scholar]
- 44.Mali P, et al. RNA-guided human genome engineering via Cas9. Science. 2013;339:823–826. doi: 10.1126/science.1232033. [DOI] [PMC free article] [PubMed] [Google Scholar]
- 45.Zhang F, et al. Efficient construction of sequence-specific TAL effectors for modulating mammalian transcription. Nature Biotechnol. 2011;29:149–153. doi: 10.1038/nbt.1775. [DOI] [PMC free article] [PubMed] [Google Scholar]
- 46.Okita K, et al. A more efficient method to generate integration-free human iPS cells. Nature Methods. 2011;8:409–412. doi: 10.1038/nmeth.1591. [DOI] [PubMed] [Google Scholar]
- 47.Li M, et al. Efficient correction of hemoglobinopathy-causing mutations by homologous recombination in integration-free patient iPSCs. Cell Res. 2011;21:1740–1744. doi: 10.1038/cr.2011.186. [DOI] [PMC free article] [PubMed] [Google Scholar]
- 48.Heinz S, et al. Simple combinations of lineage-determining transcription factors prime cis-regulatory elements required for macrophage and B cell identities. Mol. Cell. 2010;38:576–589. doi: 10.1016/j.molcel.2010.05.004. [DOI] [PMC free article] [PubMed] [Google Scholar]
- 49.Robinson MD, McCarthy DJ, Smyth GK. edgeR: a Bioconductor package for differential expression analysis of digital gene expression data. Bioinformatics. 2010;26:139–140. doi: 10.1093/bioinformatics/btp616. [DOI] [PMC free article] [PubMed] [Google Scholar]
- 50.Mikkelsen TS, et al. Genome-wide maps of chromatin state in pluripotent and lineage-committed cells. Nature. 2007;448:553–560. doi: 10.1038/nature06008. [DOI] [PMC free article] [PubMed] [Google Scholar]
- 51.Lister R, et al. Hotspots of aberrant epigenomic reprogramming in human induced pluripotent stem cells. Nature. 2011;471:68–73. doi: 10.1038/nature09798. [DOI] [PMC free article] [PubMed] [Google Scholar]
- 52.Ma H, et al. Abnormalities in human pluripotent cells due to reprogramming mechanisms. Nature. 2014;511:177–183. doi: 10.1038/nature13551. [DOI] [PMC free article] [PubMed] [Google Scholar]
- 53.Lister R, et al. Global epigenomic reconfiguration during mammalian brain development. Science. 2013;341:1237905. doi: 10.1126/science.1237905. [DOI] [PMC free article] [PubMed] [Google Scholar]
- 54.Burger L, Gaidatzis D, Schübeler D, Stadler MB. Identification of active regulatory regions from DNA methylation data. Nucleic Acids Res. 2013;41:e155. doi: 10.1093/nar/gkt599. [DOI] [PMC free article] [PubMed] [Google Scholar]
- 55.McLean CY, et al. GREAT improves functional interpretation of cis-regulatory regions. Nature Biotechnol. 2010;28:495–501. doi: 10.1038/nbt.1630. [DOI] [PMC free article] [PubMed] [Google Scholar]
- 56.Zou J, et al .Gene targeting of a disease-related gene inhuman induced pluripotent stem and embryonic stem cells. Cell Stem Cell. 2009;5:97–110. doi: 10.1016/j.stem.2009.05.023. [DOI] [PMC free article] [PubMed] [Google Scholar]
- 57.Kutner RH, et al. Production, concentration and titration of pseudotyped HIV-1-based lentiviral vectors. Nature Protocol. 2009;4:495–505. doi: 10.1038/nprot.2009.22. [DOI] [PubMed] [Google Scholar]
Associated Data
This section collects any data citations, data availability statements, or supplementary materials included in this article.


